


Key Points:
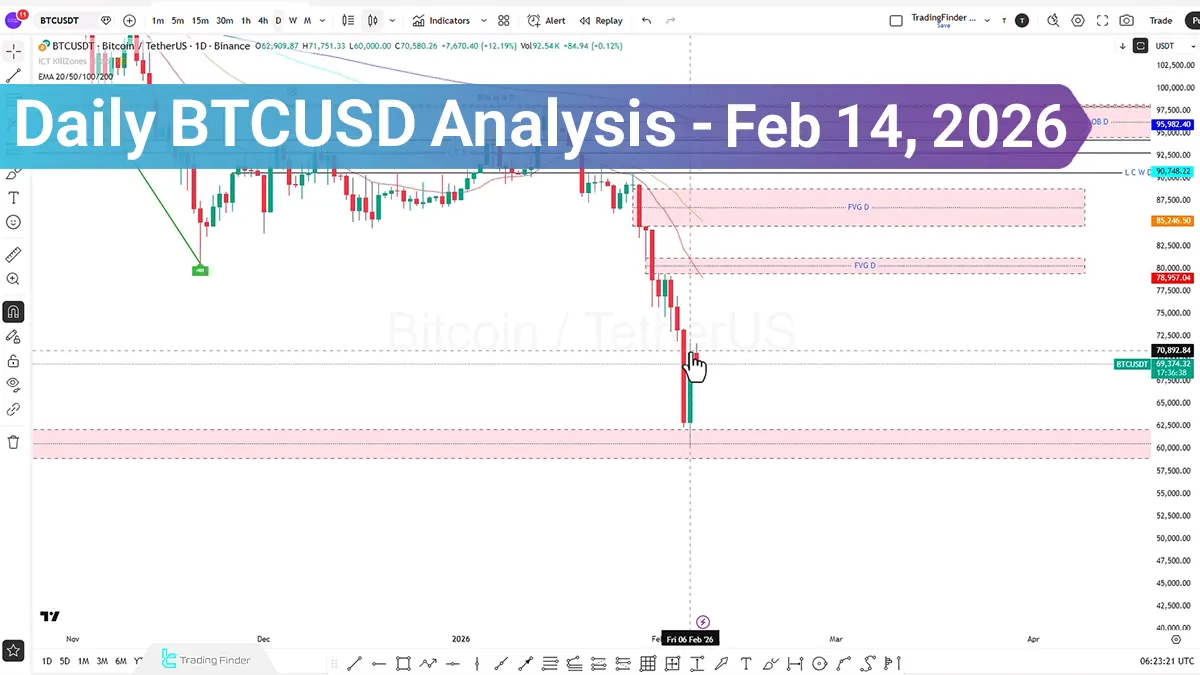
- On February 14, 2026, Bitcoin’s price decline to around $65,000 was met with demand, paving the way for a temporary recovery in the short-term market structure;
- The market’s current focus has shifted to buy-side order accumulation zones within the $70,000 to $72,000 range, as well as sell-side liquidity clusters at lower levels;
- On-chain data, ETF capital flows, and the Fear & Greed Index all indicate the persistence of liquidity pressure in the short-term horizon.
The performance gap between the growth of the U.S. stock market and Bitcoin’s decline since August 2025 may reflect capital outflows from risk-on assets under the influence of the Federal Reserve’s contractionary policies.
On February 14, 2026, amid continued selling pressure, Bitcoin reacted to the $65,000 range and, after reaching this level, generated a short-term bullish momentum.
Currently, the market’s focus is on price behavior within buy-side liquidity zones around $70,000 to $72,000, as well as sell-side liquidity ranges at lower levels. Simultaneously, on-chain data, ETF flows, and the Fear & Greed Index tool a picture of short-term liquidity pressure.
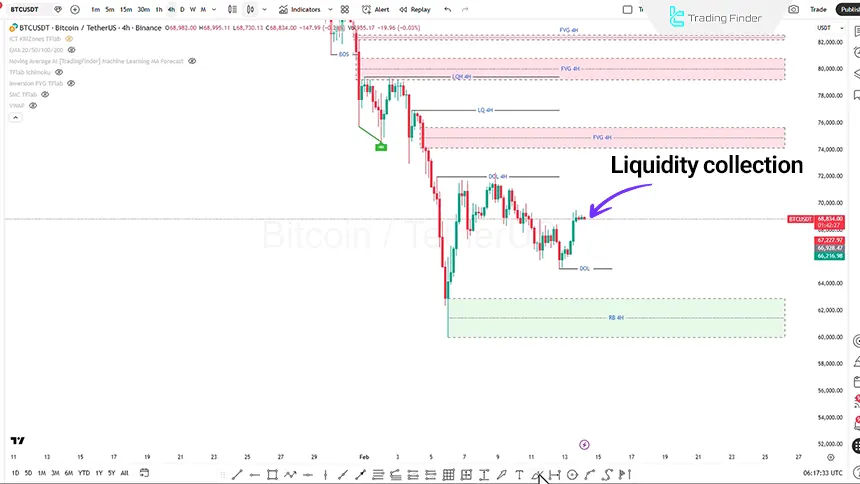
Bitcoin Analysis in the 4-Hour Time Frame (H4)
In the 4-hour time frame, Bitcoin’s movement following its reaction to the $65,000 level indicates the market’s attempt to accumulate liquidity at higher levels. Based on the current structure:
- If bullish momentum persists, the price may move toward the $70,000 to $72,000 range;
- This zone includes a significant concentration of market liquidity, and rejection from this range is possible in the absence of new incoming liquidity flows.
If the market encounters momentum weakness within this range, the likelihood of a continuation of the bearish trend and a return toward lower levels, including Draw on Liquidity zones, will increase.
Based on liquidation data from the Binance exchange:
- Buy-side liquidity is concentrated within the $69,500 to $70,000 range;
- The $70,000, $70,880, and $72,000 levels are identified as upper liquidity attraction zones;
- On the sell side, the $67,900 to $68,000 range is considered an important liquidation zone;
- Approximately $22 million in liquidity is concentrated at the $65,000 level.
These lines are not necessarily considered classic support or resistance levels; rather, they function as liquidity targets, and the market tends to activate these zones through liquidity-sweeping movements.
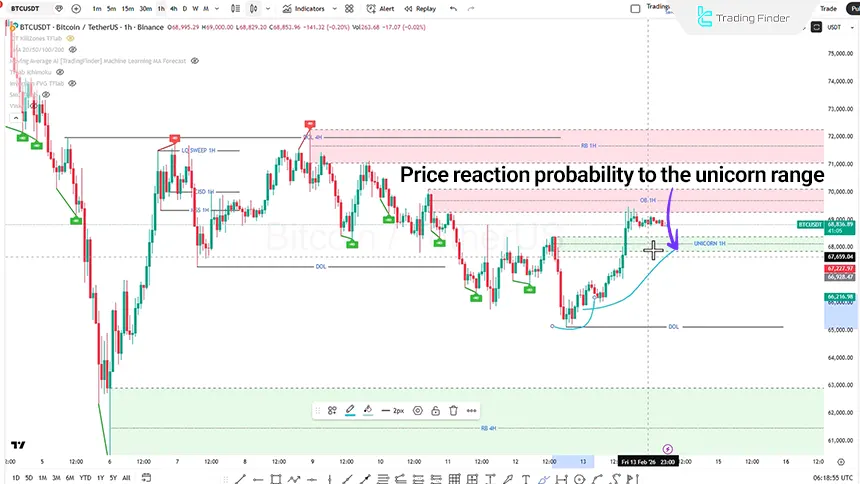
BTC Analysis in the 1-Hour Time Frame (H1)
In the 1-hour time frame, price behavior is primarily influenced by its interaction with liquidity zones and the quality of momentum in recent movements. On this time scale, the main focus is on buy-side liquidity accumulation at upper levels, as well as price reaction to structural zones such as the Unicorn pattern.
Under such conditions, two potential scenarios can be defined for the continuation of price movement, each depending on price behavior when interacting with liquidity and market structure:
Bearish Scenario:
- An increase in liquidity and price movement toward buy-side liquidity;
- Upper liquidity collection followed by observable momentum weakness;
- Formation of a Sell position with a stop loss above the liquidity collection zone.
Bullish Scenario:
- If the price moves downward and enters the 1-hour Unicorn zone;
- If weakness is observed in the continuation of the bearish trend;
- Entry into a Buy position with a stop loss placed behind the Unicorn zone.
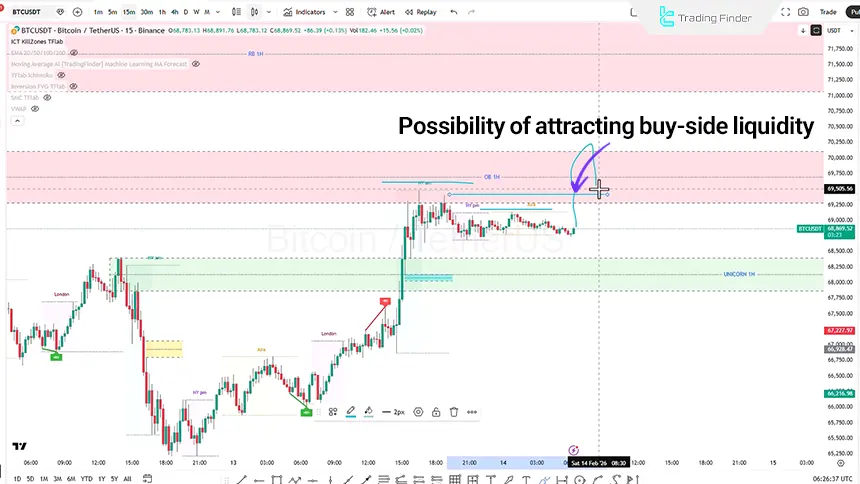
BTCUSD Analysis in the 15-Minute Time Frame (M15)
In the 15-minute time frame, considering the recent ranging phase during the New York morning session and the lack of sufficient momentum for a decisive breakout, the market’s focus shifts to price behavior at the beginning of the London session.
Under such conditions, an initial expansionary movement is often created to attract buy-side liquidity.
Accordingly, the potential scenario is defined as follows:
- A short-term bullish movement during the London session;
- Buy-side liquidity collection at short-term highs;
- A candle closing back inside the Order Block range.
In this case, a return of the price into the supply zone may signal weakness in the continuation of the bullish move and provide an opportunity to evaluate a Sell position targeting lower market liquidity.
Bitcoin Fundamental Analysis on February 14, 2026
Since August 2025, the U.S. stock market has experienced approximately 10% growth, while Bitcoin has faced a decline of around 25%.
This significant negative divergence between the equity market and the crypto market indicates additional pressure on risk-on assets and a relative outflow of liquidity from Bitcoin.
One potential reason for this differing behavior may be the Federal Reserve’s restrictive monetary policy and tightening interest rate conditions; a factor that typically has a direct impact on liquidity-sensitive markets.
Conclusion
Bitcoin is currently in a condition where, from a technical perspective, liquidity is being absorbed between the $65,000 and $72,000 levels, and the market structure is oscillating in a scenario-based manner between upper liquidity collection and the continuation of a mid-term correction.
On-chain data indicates a phase of capitulation and short-term liquidity pressure, while the liquidity concentration around the $70,000 range may be activated prior to any new directional move. Price behavior in these zones and its reaction to liquidity will determine the market’s short-term trajectory.


