


Key Points:
- Silver ounce on the 4-hour time frame remains within a bullish structure; however, negative divergence in the Multi RSI indicates weakening momentum;
- On the 4-hour time frame, following a Liquidity Sweep and reaction to the rejection block, price has collected sell-side liquidity and rebounded; if momentum increases, the target could be the 50% Order Block at the $90.53 level;
- If the bullish move is accompanied by structural weakness, the probability of a correction or short-term bearish phase increases; the daily close relative to the previous swing determines the validity of the bullish bias;
- On the 1-hour time frame, the formation of a Swing Failure Pattern after a stop hunt and the creation of a Pin Bar within the Order Block zone is observed.
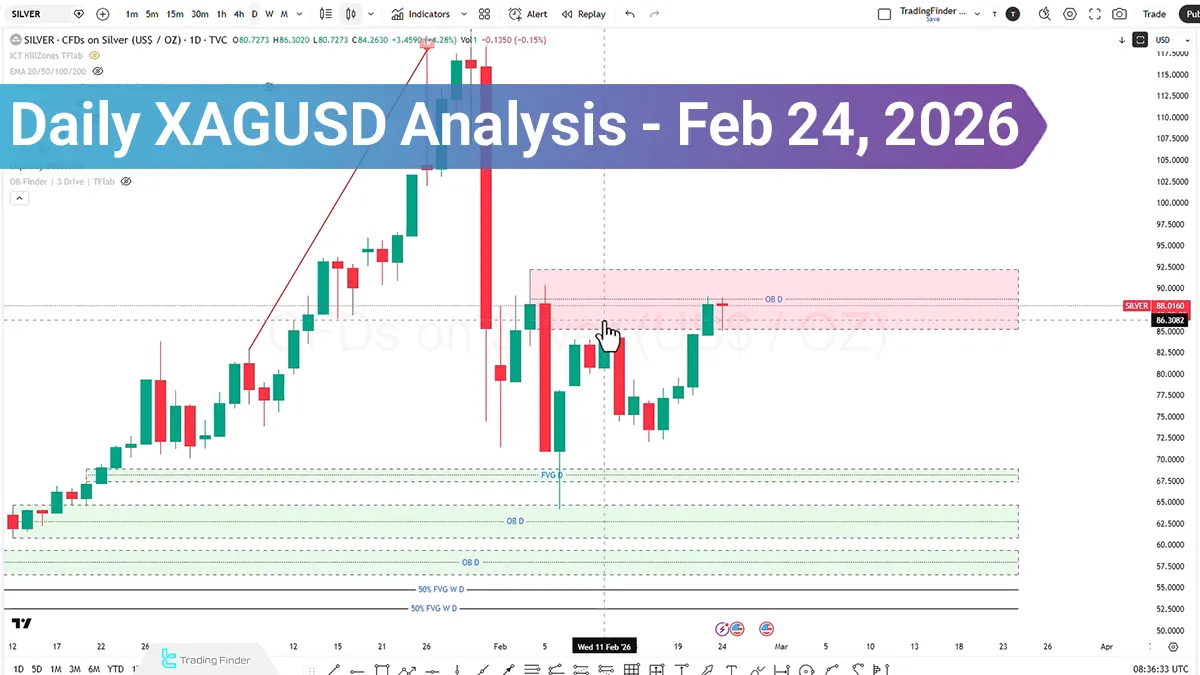
In today’s analysis of the silver symbol, the main focus is on price behavior relative to the previous swing and the manner in which the daily candle closes. Although we faced selling pressure at the beginning of the day, the renewed upward move indicates that the market is in a decision-making zone.
Correlation with gold is also considered as trend confirmation, and today’s candle may determine the direction of future market movements.
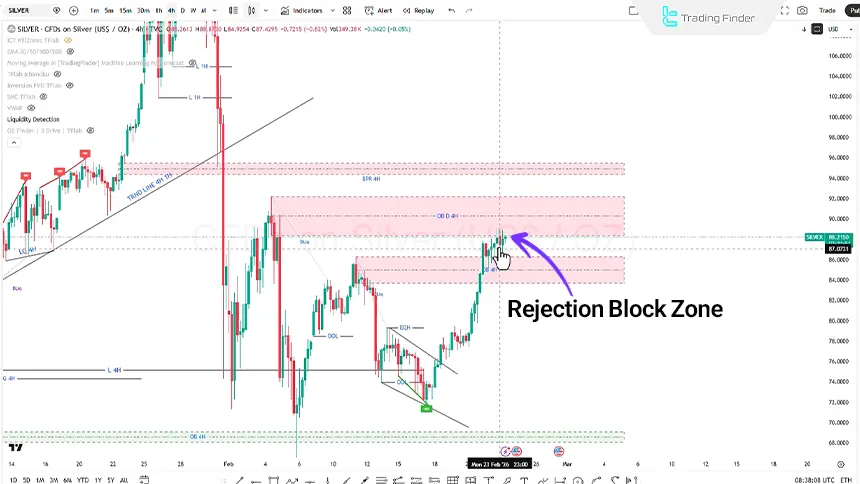
XAGUSD Analysis on the 4-Hour Time Frame (H4)
On the 4-hour time frame, the bullish trend has been accompanied by signs of weakness. After a Liquidity Sweep, price entered the rejection block zone and reacted to this area.
If momentum increases, price may collect buy-side liquidity up to the 50 percent Order Block level at $90.53 point.
However, if this move is accompanied by weakness in the bullish structure, there is a possibility of entering a corrective phase or even a short-term bearish move.
If price enters the specified candle zone, it can be considered as a potential area to evaluate buy positions.
Additionally, reviewing the Multi Relative Strength Index indicator shows negative divergence:
- Price is forming higher highs;
- While the Multi Relative Strength Index is registering lower highs.
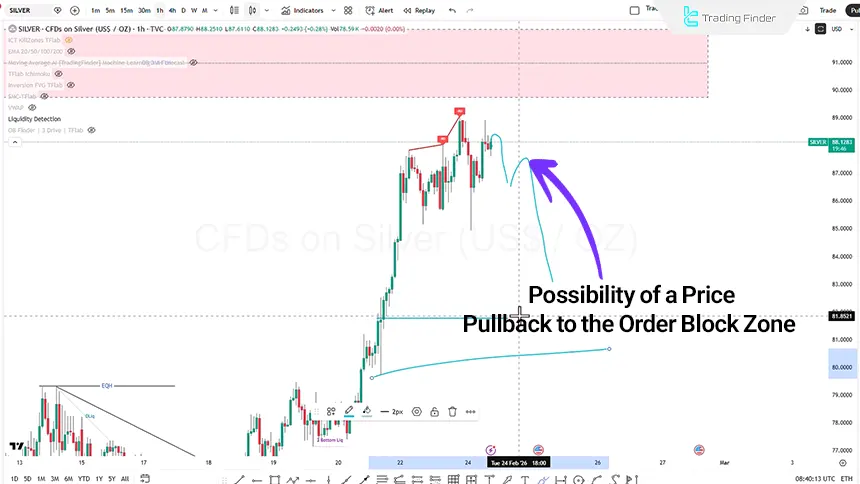
Silver Analysis on the 1-Hour Time Frame (H1)
On the 1-hour time frame, price movement has formed aggressively after taking stops to the downside, creating a structure similar to a Swing Failure Pattern.
If price makes a short-term correction and then moves downward with a strong-bodied candle, there is a possibility of a correction toward the Pin Bar candle zone at the $81.86 point level.
Also, if price moves downward and within the candle shadow (Shadow) forms a three-layer structure and a market structure shift occurs:
- A buy position can be considered with a Stop Loss below the formed structure;
- Targets can be the buy-side liquidity or the 50 percent Order Block zone.
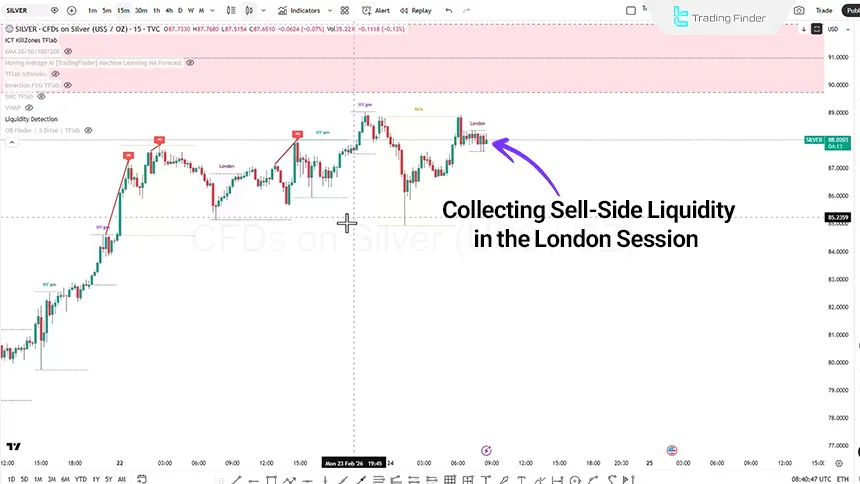
XAGUSD Analysis on the 15-Minute Time Frame (M15)
On the 15-minute time frame, the price movement structure has been accompanied by selling pressure. After collecting sell-side liquidity, the market once again moves upward.
The scenarios to consider during the London and New York sessions are as follows:
- In the London session, price moves downward, enters the rejection block zone, collects liquidity, and is followed by a bullish distributive move;
- In contrast, if during the London session price moves upward and re-enters the Asia range, it may be followed by a bearish move in the New York session.
Conclusion
Silver is positioned in a key zone from a market structure and liquidity perspective. The daily candle close relative to the previous swing, correlation with gold, and price behavior around the 90.53$ point level will be determining factors for the future direction.
Negative divergence in the Relative Strength Index (RSI) is also considered a warning of weakening bullish momentum. Overall, the market direction will depend on how price reacts to liquidity zones and the quality of confirmation candles on key time frames.


