


Key Points:
- WTI Crude Oil, after collecting Buy Side Liquidity around the $60 level, has entered a decision phase with the formation of a Doji candle, and a decline in short-term momentum is evident;
- On the 4-hour timeframe, oil’s reaction to the Order Block and the formation of a Pin Bar indicate that the market is fluctuating between bullish consolidation and the start of a deeper correction; a close below the consolidation range strengthens the bearish scenario;
- CVD divergence on the 1-hour oil chart signals a potential exhaustion of buying pressure, and the reaction to FVG and BPR zones will determine the short-term direction;
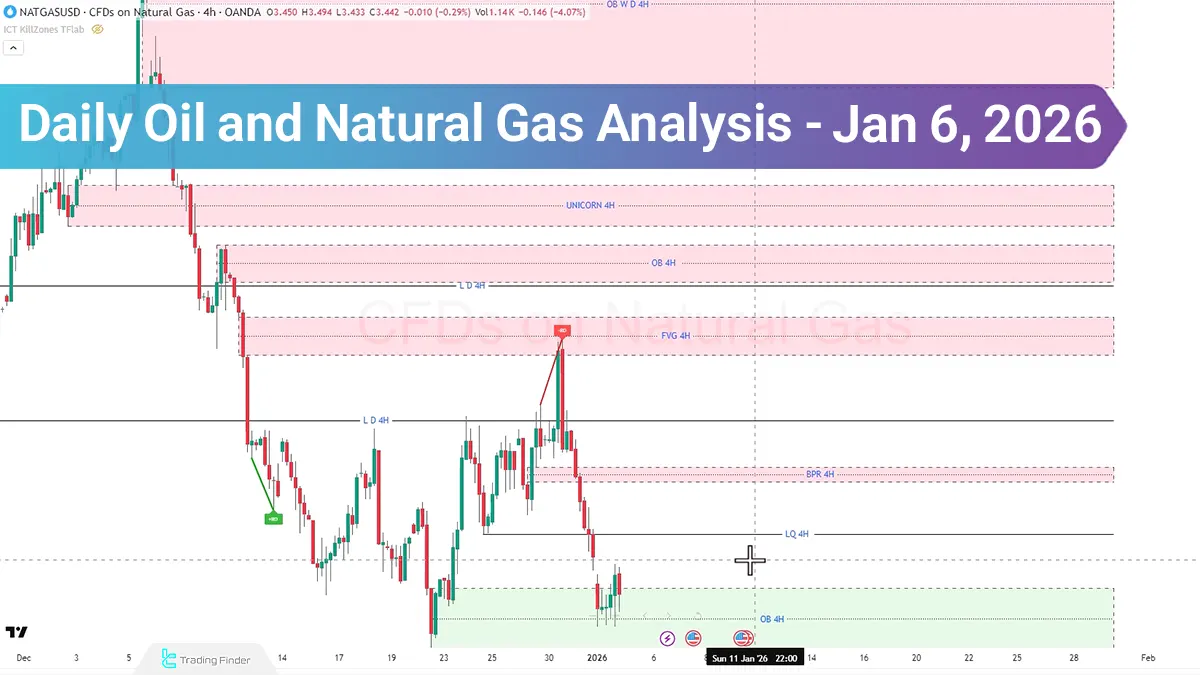
- Natural Gas USD remains within a sustained bearish structure and is trading under selling pressure on both the daily and 4-hour timeframes;
- The RSI entering the oversold region in natural gas may only lead to a limited correction unless a valid bullish Break of Structure forms; otherwise, the dominant scenario remains a continuation of the decline toward the weekly BPR zones and overlapping Order Blocks.
In daily energy market trading, U.S. crude oil and U.S. natural gas, as two key assets in the commodities market, continue to fluctuate within technical structures under the influence of fundamental data, U.S. energy policies, reports from the U.S. Energy Information Administration (EIA), and volatility in the U.S. Dollar Index (DXY).
Crude oil prices, after collecting Buy Side Liquidity, have entered a decision phase and are showing signs of weakening short-term momentum.
In contrast, natural gas, with continued selling pressure, maintains its bearish structure and is moving toward lower zones.
An examination of candlestick behavior, momentum, and liquidity zones keeps both bullish and bearish primary scenarios active for both assets.
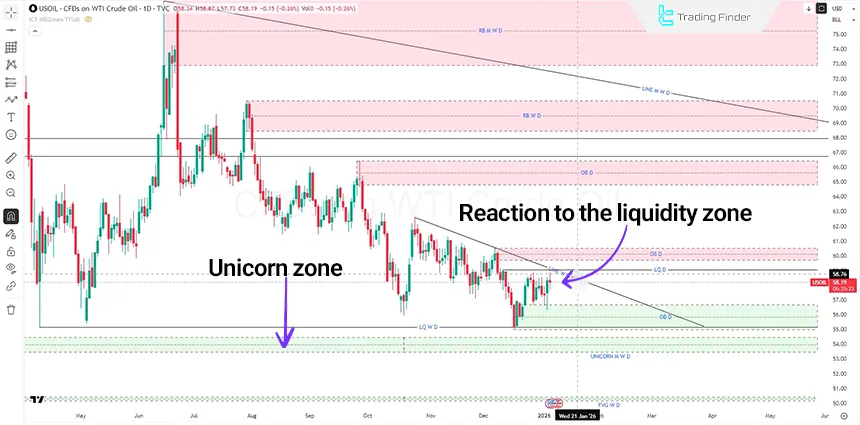
Analysis of Oil on the Daily Timeframe
On the daily timeframe, after continuing its upward trend, price has collected Buy Side Liquidity and is reacting to the $60 price area.
The market has formed a Doji candle in this zone, reflecting hesitation between buyers and sellers.
Price behavior in this section outlines several specific paths:
- Reaction to the 50% retracement level;
- Formation of selling pressure after liquidity collection;
- Assessment of the candle close relative to the liquidity accumulation range;
- Evaluation of bearish or neutral momentum.
If price closes decisively below the consolidation range, the bearish structure will strengthen and the market will move toward collecting Sell Side Liquidity.
Note: In this scenario, the Monthly Unicorn Zone, overlapping with the weekly and daily timeframes, serves as the mid-term target.
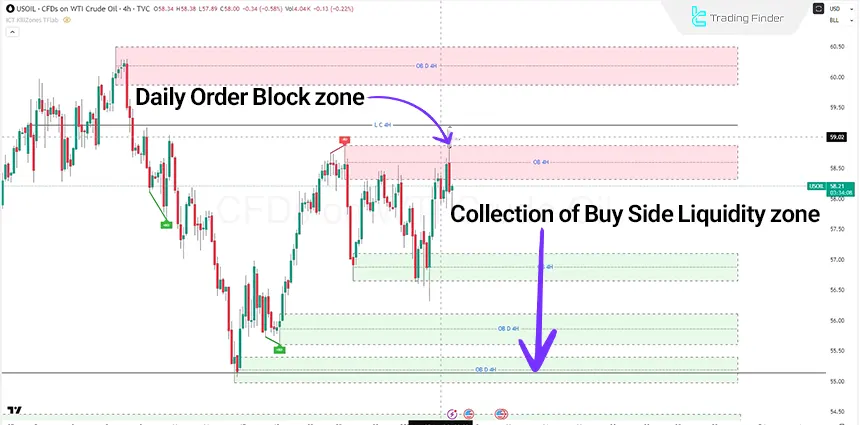
Analysis of US Oil on the 4-Hour Timeframe
On the four-hour timeframe, price has maintained its short-term uptrend and, after absorbing Buy Side Liquidity, breaks out below the 150-hour Order Block; this behavior reflects short-term selling pressure in the market.
Following this move, price forms a Pin Bar candle and collects sell-side liquidity at lower levels.
Active scenarios on this timeframe include:
- Price stabilization above the 150-hour candle;
- Return above the Order Block zone;
- Continuation of movement toward the multi-level daily Order Block;
- Activation of the Ryan Soldier Strategy structure.
Upon confirmation of this pattern, the trader can define the entry point, stop loss, and target toward sell-side liquidity based on the Swings structure.
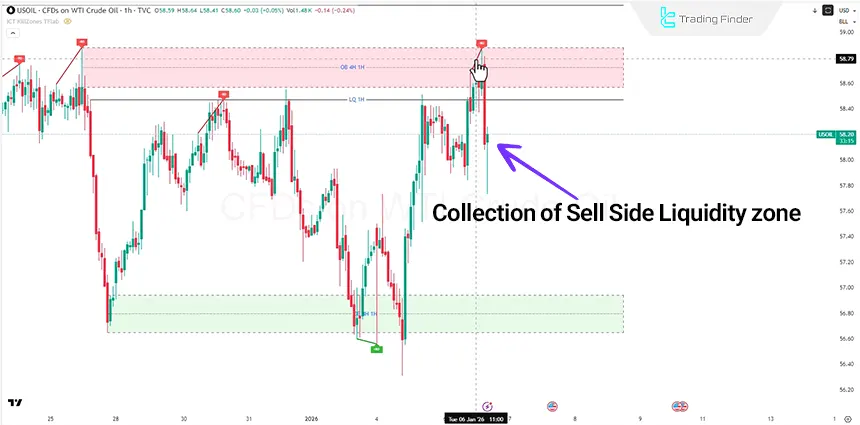
Analysis of Oil on the 1-Hour Timeframe
On the one-hour timeframe, the market has recorded CVD Divergence and simultaneously formed a bearish candle to release short-term buying pressure. After collecting sellers’ liquidity, price reacts to the Order Block zone and enters a phase of forming a bullish Pin Bar.
If this structure is confirmed, the short-term bullish scenario will be activated, and the next target could be the one-hour Balanced Price Range.
In the one-hour bearish scenario, the market may follow this path:
- Movement toward the Fair Value Gap;
- Reaction to the lower Order Block;
- Assessment of trend weakness in support zones;
- Continuation of decline if a close forms below the key level.
Note: A strong close below these levels will direct price toward daily Order Blocks overlapping with H4 and H1.
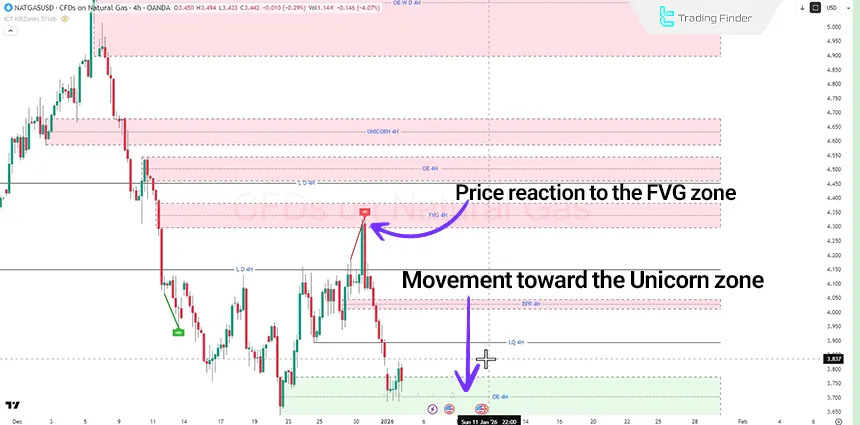
Natural Gas Analysis on the 4-Hour Timeframe (H4)
On the four-hour timeframe, price is under the dominance of sellers’ pressure, and the primary objective of this move is the collection of Sell Side Liquidity.
In this zone, the following confluences are observed:
- Unicorn Zone;
- Fair Value Gap;
- Reactive zone from a technical analysis.
Price behavior in this section can determine the short-term market path and identify signs of either a pause or continuation of the bearish trend.
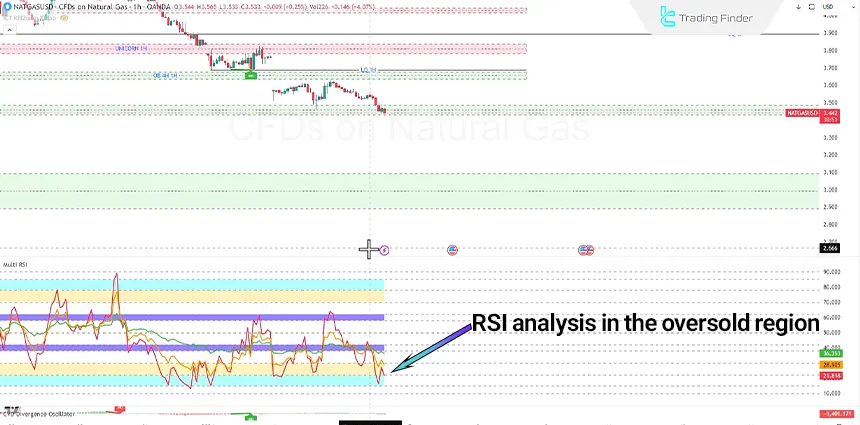
Natural Gas Analysis on the 1-Hour Timeframe (H1)
On the one-hour timeframe, the Relative Strength Index (RSI) indicator has entered the oversold region, and price is positioned within a high-potential support zone.
This condition simultaneously indicates high selling pressure and the possibility of a limited correction.
Active scenarios in this section include:
- Reaction to the Consolidation range or liquidity accumulation zone;
- Maintaining bearish momentum;
- Breaking support and continuing the decline;
- Entering a short-term consolidation phase.
If a candle closes below the consolidation range, the bearish structure will be reinforced and the market may enter a phased decline.
Conclusion
U.S. crude oil, after collecting Buy Side Liquidity, is entering a structural decision phase with declining momentum in the form of Doji and Pin Bar candles. Price reaction to Order Blocks, the 50% retracement level, and the Consolidation range illustrates the market’s next directional path.
As a result, price stabilization above these zones keeps the continuation of the bullish trend scenario active, while a candle close below the Consolidation range increases the probability of a bearish move.
In contrast, U.S. natural gas remains under Bearish Momentum and the market structure maintains its downward direction across all timeframes.
Price focus on collecting Sell Side Liquidity and reacting to the Weekly Balanced Price Range, Fair Value Gap, and overlapping Order Blocks confirms the continuation of selling pressure.


