


Key Points:
- The GBP/USD currency pair remains under selling pressure, and the 4-hour structure is bearish;
- In the 4-hour time frame, if after liquidity collection in the Order Block zone a valid close is recorded within the range, the short-term reversal scenario will be activated;
- In the 1-hour time frame, the formation of a Double Bottom at the lows and the presence of a liquidity line at the top indicate bilateral compression.
In today’s trading session, the British pound to US dollar pair has continued to face selling pressure, and price is attempting to fill part of the price gap range. Moreover, the recent price action structure indicates a compression phase prior to a bearish move aimed at collecting sell-side liquidity.
At the same time, signs of divergence between this instrument and EUR/USD can be observed, which may be considered as secondary confirmation for the potential reversal scenario.
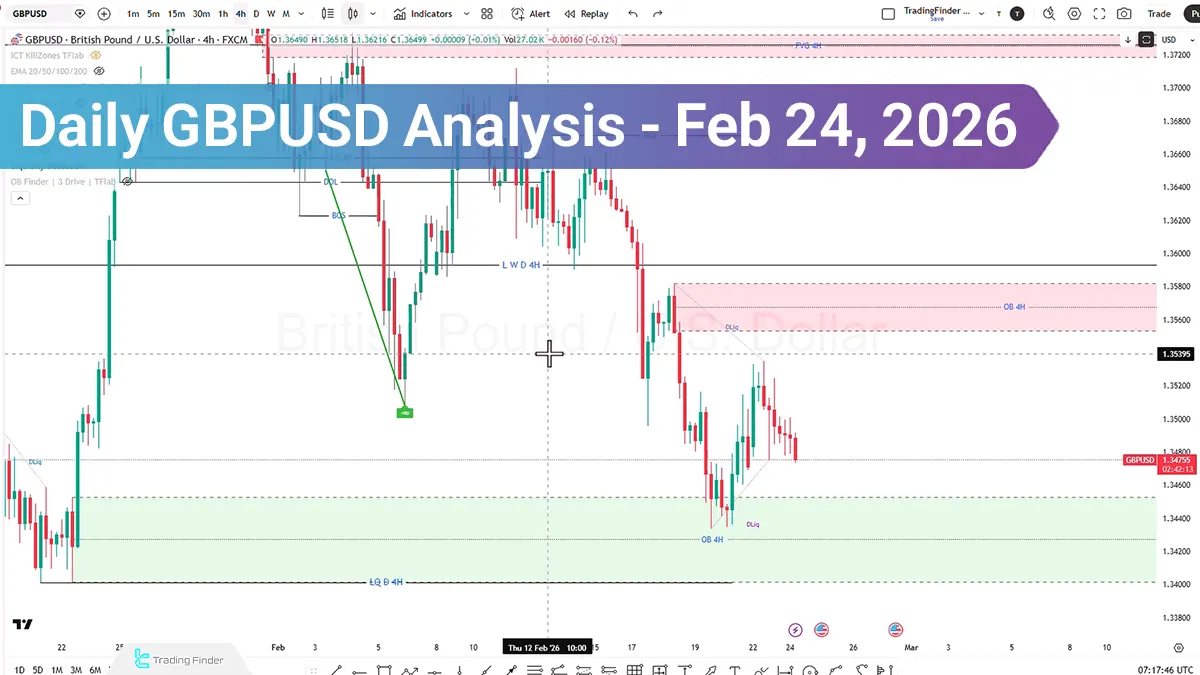
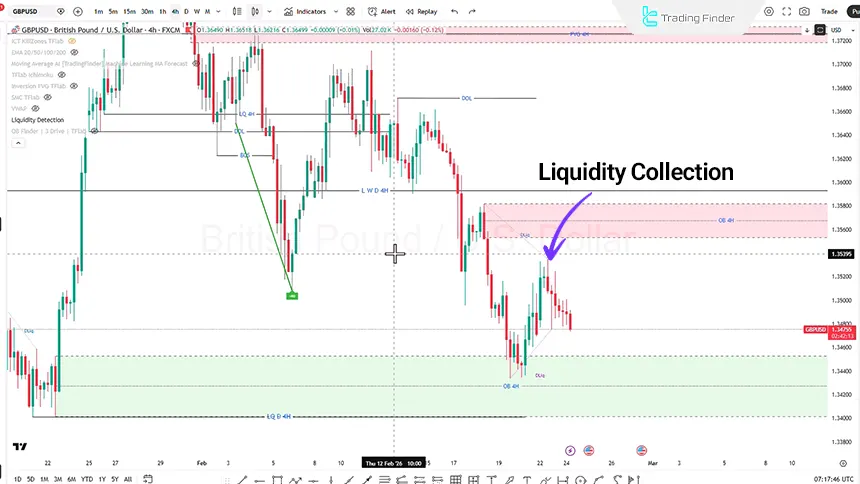
Daily Analysis of the GBP/USD in the 4-Hour Time Frame (H4)
In the 4-hour time frame, after several consecutive days of selling pressure, price has entered a compression phase and is now moving downward to collect sell-side liquidity. This behavior is typically regarded as part of the order absorption process prior to either a corrective move or a continuation move.
If price successfully collects liquidity and closes back within the specified range, it can be considered as a signal for activating the reversal scenario. In this case:
- Entry into a long position will be conditional upon price stabilization within the range;
- The stop loss will be placed beyond the liquidity zone;
- The target will be buy-side liquidity.
However, it should be emphasized that trading against the prevailing market trend carries higher risk, and priority remains with trend-aligned trades.
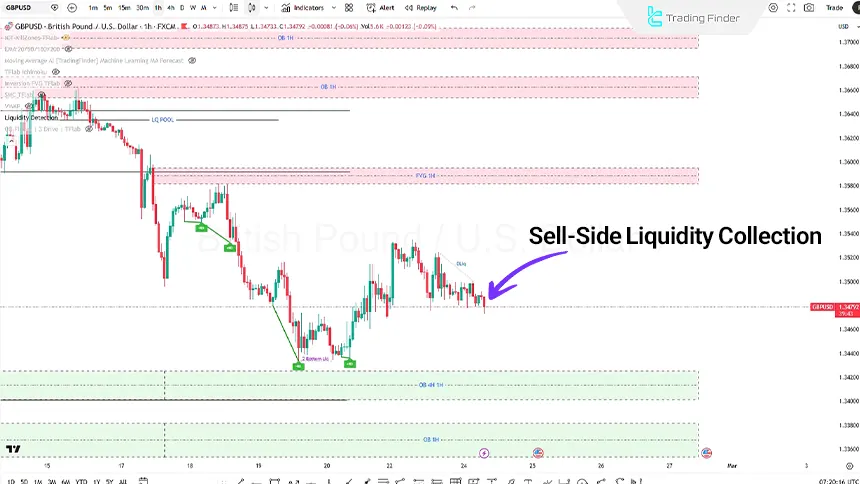
Daily Analysis of the GBP/USD in the 1-Hour Time Frame (H1)
In the 1-hour time frame, price is in the process of collecting sell-side liquidity. If, after liquidity collection, a candle close within the range is observed along with the formation of a Pin Bar, the probability of entering a bullish phase to capture buy-side liquidity increases.
Smart Money and ICT-style traders can identify liquidity zones using liquidity indicators. In the current structure:
- A liquidity line has been identified at the top;
- At the bottom, a Double Bottom structure acts as sell-side liquidity.
A plausible scenario could involve an initial move upward to capture buy-side liquidity, followed by a return downward to sweep sell-side liquidity.
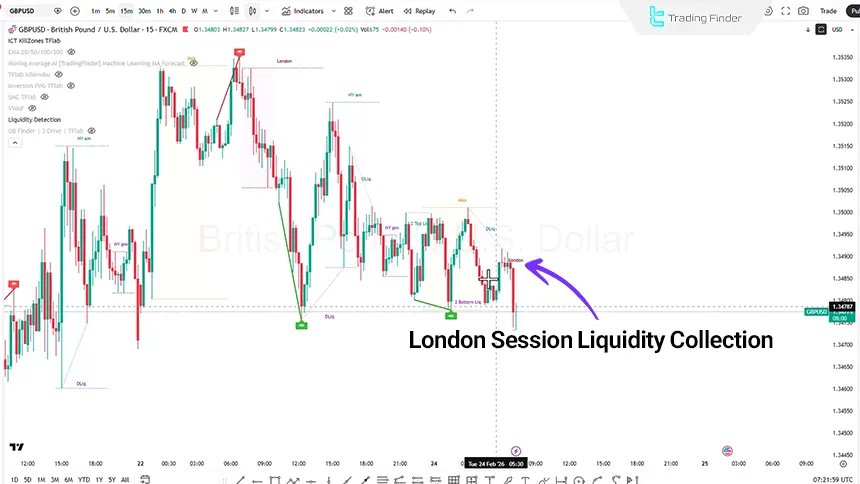
Analysis of the GBPUSD in the 15-Minute Time Frame (M15)
In the 15-minute time frame, the recent price action structure can be interpreted as an accumulation phase; especially considering that signs of liquidity collection are also observed during the London session. Based on the Power of Three strategy, two scenarios can be examined.
In the first scenario, if price performs an upward pullback during the London session and, upon entering the New York session, moves into the Fair Value Gap or Order Block zone, the activation of a buy scenario may be considered.
Conversely, if the London session’s upward move was merely aimed at collecting buy-side liquidity, there is a possibility that the market will enter a bearish distribution phase during the New York session and shift direction.
Conclusion
The overall structure of the British pound against the US dollar remains under selling pressure; however, signs of liquidity collection and intermarket divergence are visible. Price behavior around liquidity zones and reactions to Order Blocks will determine the dominant scenario.
Until a meaningful change in market structure and momentum is observed, priority remains with trades aligned with the prevailing trend.


