


Key Points:
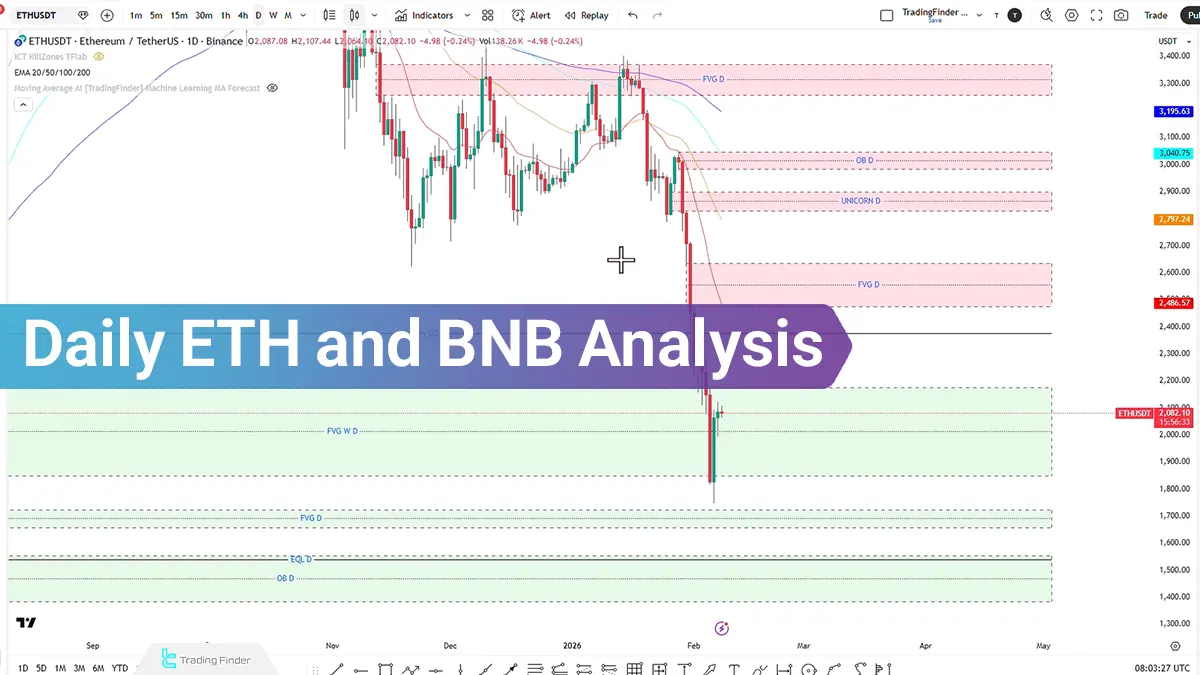
- Ethereum failed to hold above the daily candle after collecting Buy Side Liquidity;
- In the 4-hour timeframe for ETH, the dominant scenario first indicates liquidity collection and then evaluating a Sell position if momentum weakens and price fails to hold above resistance;
- On-chain data, with negative Netflow recorded and stablecoins exiting exchanges, reflect a cautious environment and a potential decline in fresh capital inflows;
- BNB is also trading in a consolidation phase with a bearish bias;
- In both assets, the short-term direction depends on how liquidity is collected and the strength of momentum during structural breakouts or rejections.
In recent trading sessions, both Ethereum and BNB have been in Consolidation phases with a lack of momentum. After collecting Buy Side Liquidity, Ethereum failed to stabilize above the previous daily candle, while Binance Coin is engaged with key levels under a bearish bias.
Additionally, on-chain data, particularly the outflow of stablecoins from exchanges and fluctuations in Ethereum inflows and outflows, present a cautious view of capital flow.
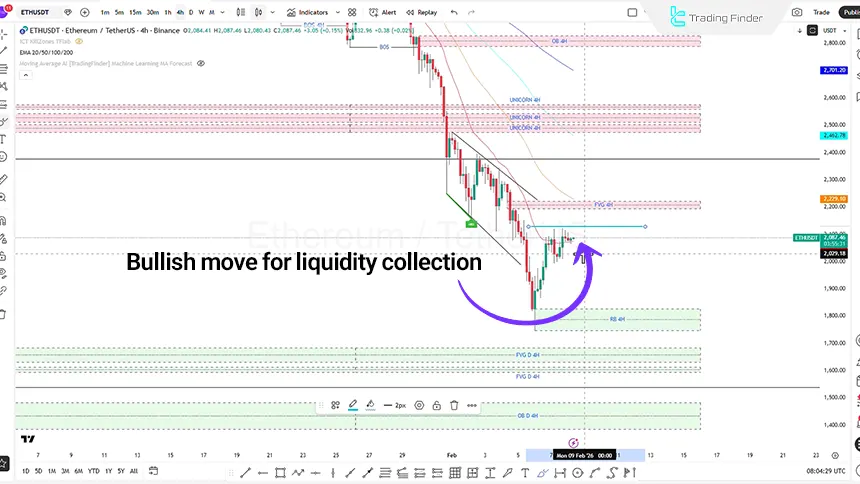
Ethereum (ETH) Analysis in the 4-Hour Timeframe (H4)
In the 4-hour timeframe, the market is facing low liquidity and reduced supply, with only one Buy Side Liquidity zone formed.
Trading scenarios in this timeframe:
- Bullish move to collect Buy Side Liquidity;
- If price closes within the consolidation range, evaluating a Sell position with the stop loss placed behind the Swing and risk-to-reward targets of 1:1 or 1:2 becomes relevant;
- If liquidity increases and the bullish move continues, reaction to the Fair Value Gap and ultimately entering a trade upon observing weakness in the bullish trend can be considered.
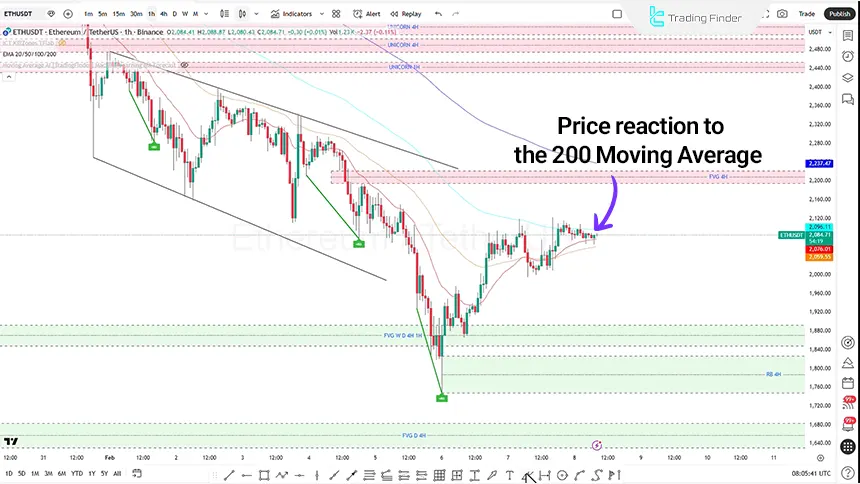
ETH Analysis in the 1-Hour Timeframe (H1)
In the 1-hour timeframe for Ethereum, the formation of a Doji candle within the consolidation range is observed, simultaneously creating liquidity on both sides of the market.
For continuation of the bearish trend:
- Price needs to collect Buy Side Liquidity;
- Reaction to a bearish Order Block or Fair Value Gap around the $400 level may trigger continued selling pressure;
- The 200 moving average is also located in this area and plays a significant role as dynamic resistance.
Furthermore, by reviewing on-chain data, the Netflow has been negative for three consecutive days, indicating stablecoin outflows from exchanges. Such behavior may suggest one of two conditions:
- Fresh capital inflow has declined;
- The market is in an Accumulation phase.
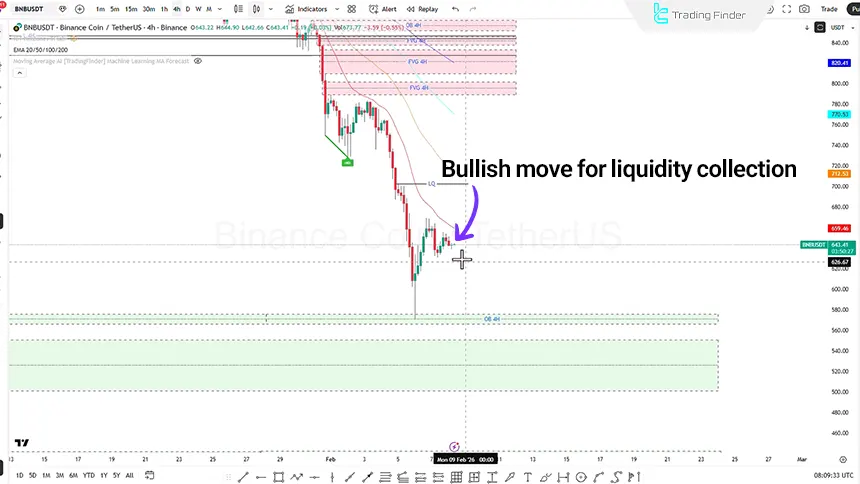
BNB Analysis in the 4-Hour Timeframe (H4)
In the 4-hour timeframe, the market is in a consolidation phase, and sufficient momentum for a decisive breakout in either direction is not observed.
Likely scenario:
- Short-term bullish move to collect Buy Side Liquidity;
- Reaction to the 20 moving average followed by continuation of the bearish trend.
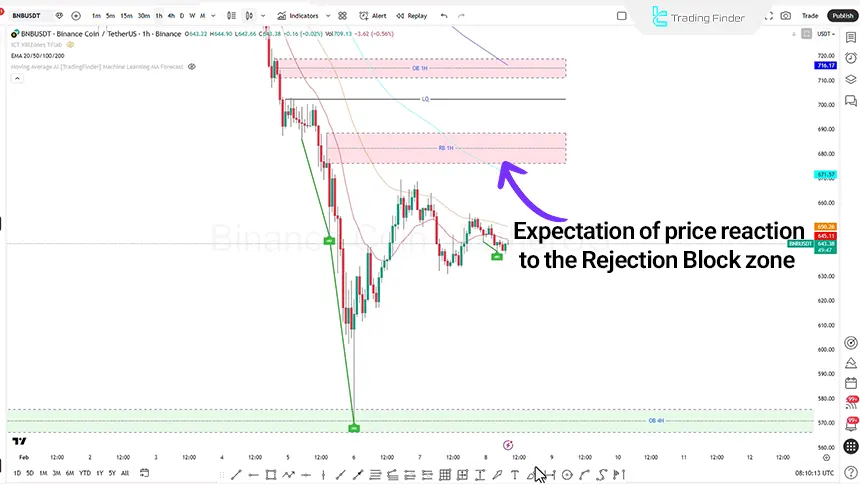
BNBUSDT Review in the 1-Hour Timeframe (H1)
In the 1-hour timeframe, liquidity on both sides of the market is active; however, considering the negative sentiment and bearish bias, the primary focus is on Sell positions.
Trading scenario:
- Bullish move to collect Buy Side Liquidity;
- Reaction within the bullish Rejection Block zone at $569.19;
- Entering a Sell position with the stop loss placed behind the zone and targeting the Swing Low.
If bullish momentum increases, the following scenario applies:
- Breakout of the Rejection Block;
- Collection of Buy Side Liquidity at $702.72;
- Potential reaction to the Order Block zone and creation of new trading opportunities.
Conclusion
Ethereum is in an accumulation phase with weak momentum, and until stabilization above resistance levels occurs, the corrective scenario remains dominant. On-chain data show stablecoin outflows and fluctuations in Ethereum inflows and outflows, which may signal investor caution.
Binance Coin is also engaged at important levels with a bearish bias, and price behavior relative to the $494.82 level will play a decisive role in the continuation of the move.
Overall, the market focus remains on liquidity collection and reactions to structural levels, while momentum will be the key factor in determining short-term direction.


