


Key Points:
- After collecting buy-side liquidity on the 4-hour timeframe, Bitcoin entered the order block zone with a bearish Displacement move and is now in a bullish corrective phase. The 69,000 to 70,000 USD range is the primary liquidity absorption and decision-making zone of the market;
- On the 4-hour timeframe, if weakness is observed during the bullish correction and a bearish structure forms, the sell scenario will be activated; the stop loss can be placed behind 70,126 or 71,136 USD, and the targets will be the swing low and lower levels;
- On the 1-hour timeframe, the market is in a Consolidation phase; after collecting External Liquidity, the focus is now on absorbing Internal Liquidity. A bullish structure break could push the price back toward the swing low;
- From a fundamental analysis perspective, ETF outflows in recent days and the return of positive net inflows on February 20, 2026 indicate a relative shift in capital flow.
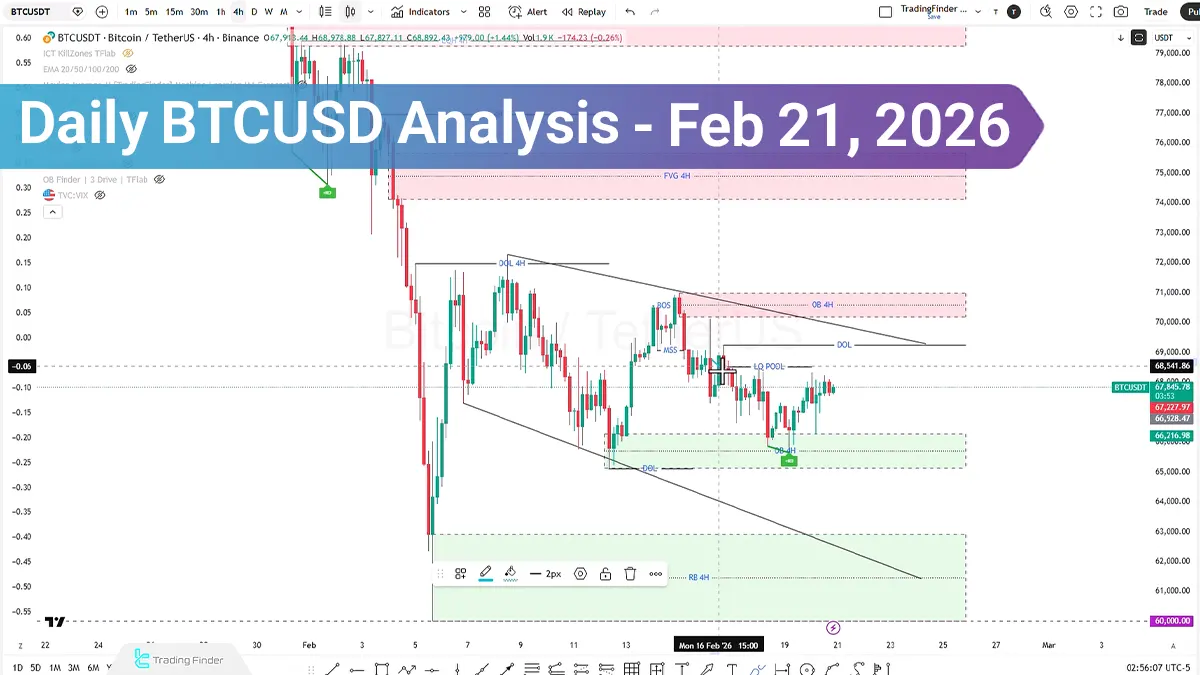
On February 21, 2026, Bitcoin faced selling pressure after collecting buy-side liquidity and entered the liquidity pool and the 4-hour order block zone.
Currently, the price is in a bullish corrective phase, and the upcoming scenarios depend on price behavior at key liquidity levels. Exchange-Traded Fund (ETF) data and the Fear & Greed Index tool also provide signs of a gradual shift in market sentiment, although the technical structure still requires confirmation.
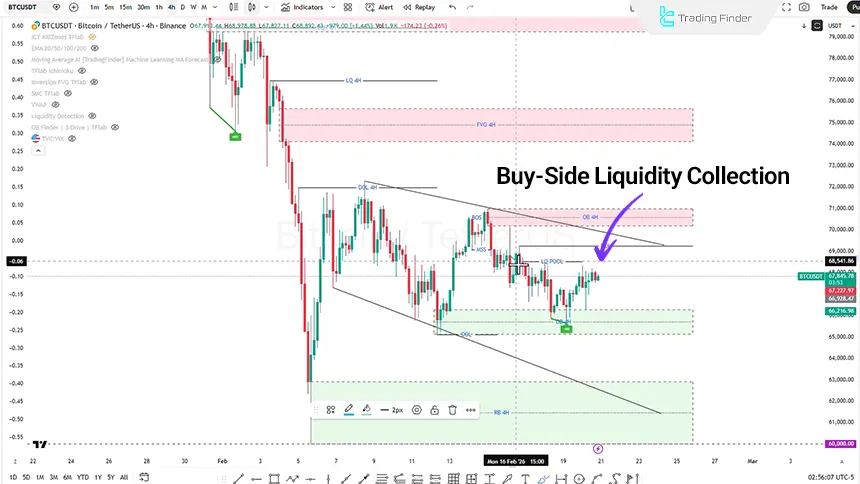
Bitcoin Analysis on the 4-Hour Timeframe (H4)
After collecting buy-side liquidity, the price moved toward the liquidity zone with a bearish displacement move and entered the 4-hour Order Block. At present, the market is in a bullish corrective phase.
In this area, there is a Draw on Liquidity level that could attract the price toward it. If the corrective move continues, the price is expected to once again collect buy-side liquidity. If signs of weakness appear in the bullish trend and a bearish market structure forms, sell positions can be considered.
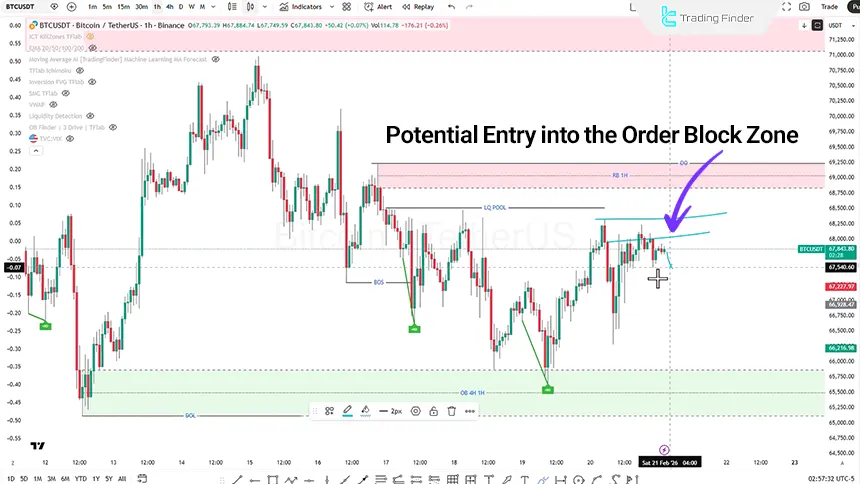
BTC Analysis on the 1-Hour Timeframe (H1)
On the 1-hour timeframe, the price is in a consolidation phase. After collecting External Liquidity, the market is moving toward collecting Internal Liquidity.
There is an order block zone within the current structure that, if accompanied by increased trading volume, could lead to the collection of Sell Side Liquidity and continuation of the bullish move. However, if structural weakness forms or a market structure shift occurs, the price may return toward the swing low.
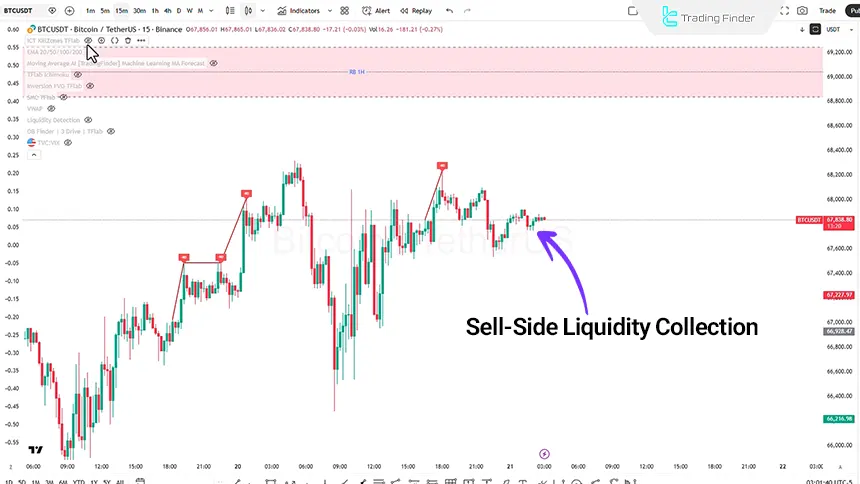
BTC Analysis on the 15-Minute Timeframe (M15)
On the 15-minute timeframe, using the ICT Kill Zone indicator, price behavior during trading sessions can be evaluated.
In the past two sessions, after collecting buy-side liquidity and reacting to the order block during the London session, the price has been accompanied by selling pressure. The likely scenario for the current London session:
- Collection of sell-side liquidity;
- Reaction to the BPR zone at the 67,146.6 to 67,312 USD level;
- A bullish move to collect buy-side liquidity;
- Entry into the rejection block zone.
If liquidity increases and strong buy orders are registered, continuation of the bullish trend without a deep correction is also possible; otherwise, a negative reaction from the rejection block zone could reactivate selling pressure.
Fundamental and Sentiment Analysis of Bitcoin
In recent days, the net inflow of Bitcoin ETF funds has been negative, and capital outflows from the funds have been recorded. However, on February 20, a positive net inflow was reported, which could indicate a relative return of demand.
If this capital flow change continues, it could support the bullish scenario; otherwise, a return to capital outflows would once again increase selling pressure. The Fear & Greed Index review shows that the market is exiting the extreme fear zone.
The index entering the neutral zone could indicate a gradual shift in sentiment from a bearish phase to a balanced or bullish phase. However, stabilization within this zone is necessary to confirm the phase transition.
Conclusion
Bitcoin is positioned in a range where the market’s main focus is on liquidity collection at the 69,000 to 70,000 USD levels. ETF net inflow data and the improvement in the Fear & Greed Index provide signs of strengthening momentum, but the short-term structure still requires confirmation. Additionally, the price reaction to key liquidity zones and order blocks will determine the market’s next direction.


