


Key Points:
- Global gold spot, after selling pressure, has reacted to a support zone overlapping with FVG and structural support, strengthening the probability of a reversal scenario;
- In the 4-hour timeframe, filling the gap and reacting to support simultaneously with the 20-day moving average has led to a price rebound; however, a close below the swing level at $5093 can activate a short-term bearish scenario and a move toward the order block and rejection block;
- In the 1-hour timeframe, the observation of CHoCH and a negative divergence in CVD Divergence indicates a temporary phase shift to bearish, and the current move may merely be a pullback to the Fair Value Gap;
- The price entering the overbought zone without stabilization in a high-potential trend continuation area increases the likelihood of a short-term correction;
- In the 15-minute timeframe, bearish distribution during the New York session and the formation of a new FVG indicate a confrontation between buyers and sellers in the decision zone.
In the previous trading session, gold price was accompanied by selling pressure and ultimately reacted to the Unicorn zone on the one-hour timeframe.
The overlap of this area with the price gap and structural support has strengthened the probability of a reversal scenario. However, price behavior at the daily close as well as reactions to key levels on lower timeframes will determine the continuation of the bullish trend or the start of a deeper correction.
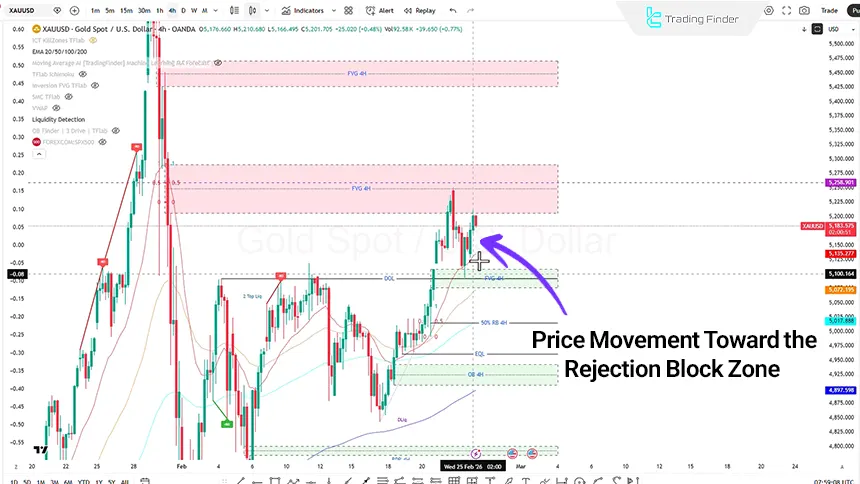
Gold Analysis on the 4-Hour Timeframe (H4)
On the 4-hour timeframe, after price entered the Fair Value Gap zone, selling pressure increased and the price gap was eventually filled.
In this timeframe, price reacted to a support level that also overlaps with the 20-period moving average. As a result, this technical confluence caused the price to rebound upward.
Currently, a short-term corrective move to the downside is expected as follows:
- Increased selling pressure;
- And a price close below the previous swing at the $5093 level;
There is a possibility of continued selling pressure toward the order block and rejection block zones. After price reaches these areas, a renewed reaction and an attempt to move upward can be expected.
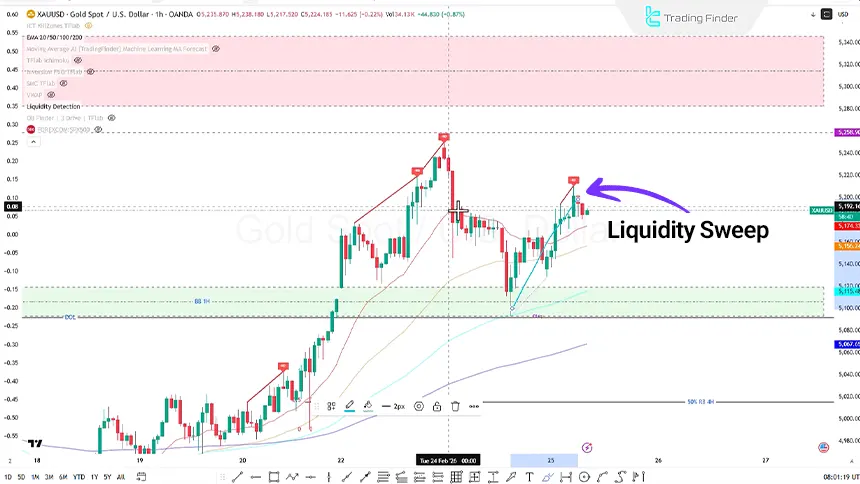
XAUUSD Analysis on the 1-Hour Timeframe (H1)
On the 1-hour timeframe, after the formation of sell-side liquidity and buy-side liquidity, price entered the breaker block zone under selling pressure. Then, with the formation of an order block candle, the bullish move began.
At present, using the CVD Divergence indicator, a negative divergence has been observed, which may signal a short-term correction.
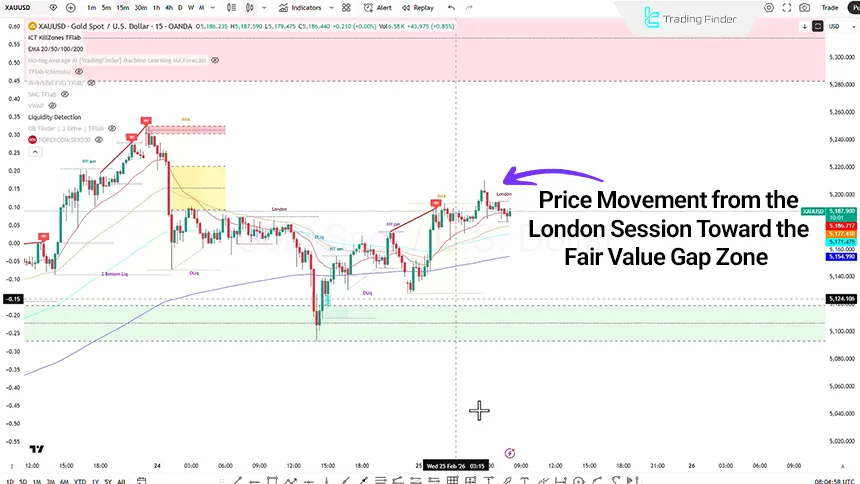
Gold Analysis on the 15-Minute Timeframe (M15)
On the 15-minute timeframe, using the Session and Kill Zone indicators, price behavior across trading sessions can be examined as follows:
- In the Asia session, after an aggressive move to the downside, price entered a consolidation phase;
- In the London session, the market was in a ranging condition;
- In the New York session, an aggressive bearish move and entry into the Distribution phase were observed.
Under current conditions, price has moved upward during the Asia session and formed a Fair Value Gap.
Conclusion
The overall structure of gold remains within a bullish framework; however, signs of a short-term correction are visible on lower timeframes. Price reactions to Fair Value Gap zones, order blocks, and candle close behavior will play a decisive role in the market’s next direction.
Confirmation through bearish displacement or weakening momentum is the key to distinguishing a corrective scenario from the continuation of the bullish trend.


