


Key Points:
- Solana remains in a bearish phase, and the negative price reaction at $67.50 and the 20-day moving average indicate continued weakness in market momentum;
- Ongoing capital outflows from Solana-related ETFs and the Fear & Greed Index being in extreme fear territory confirm dominant supply pressure and reinforce the bearish outlook;
- Price stability below the $67.20 level could pave the way for a move toward targets of $60, $55, and $50;
- A reversal scenario can only be considered if selling pressure significantly weakens and a Pin Bar pattern forms at valid support levels, and even then, it would remain short-term;
- The $55 to $50 price range is identified as a potential liquidity absorption zone and a key determinant for Solana's medium-term direction.
Solana's price continues in a bearish structure this week, with selling pressure dominating the market. The negative reaction to the $67.50 level and the 20-day moving average confirms ongoing momentum weakness.
At the same time, capital outflows from ETFs and the Fear & Greed Index in extreme fear territory have strengthened bearish scenarios.
Currently, the market's focus is on price reactions at lower support zones and its behavior within liquidity ranges.
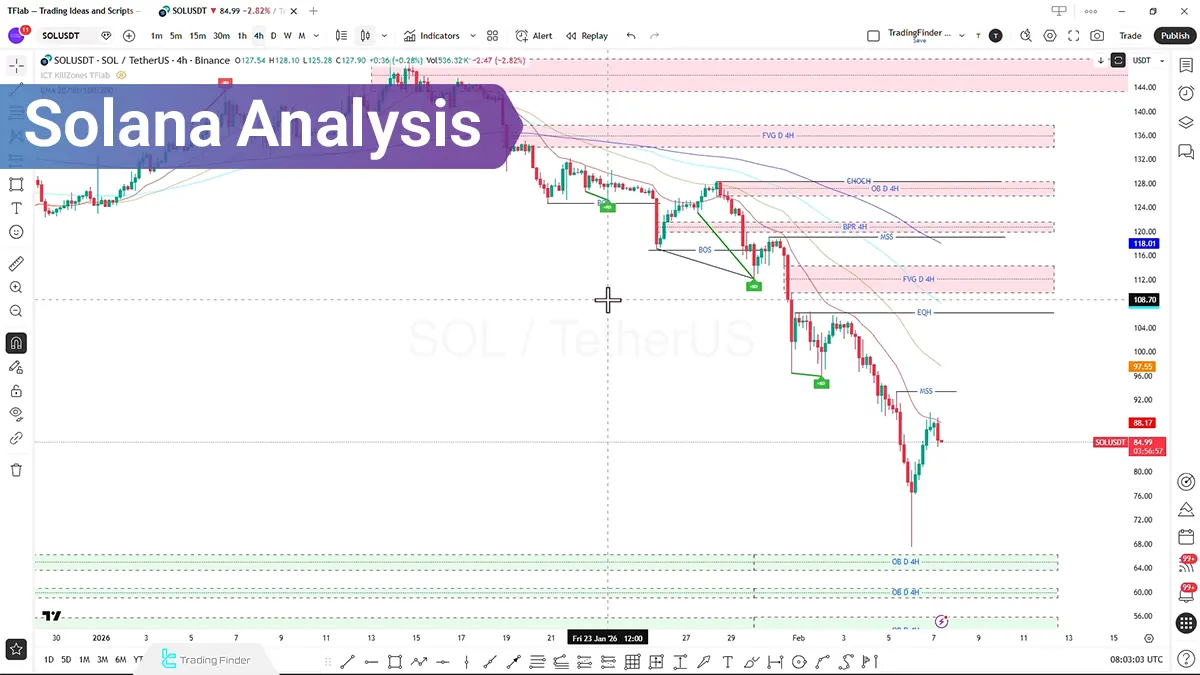
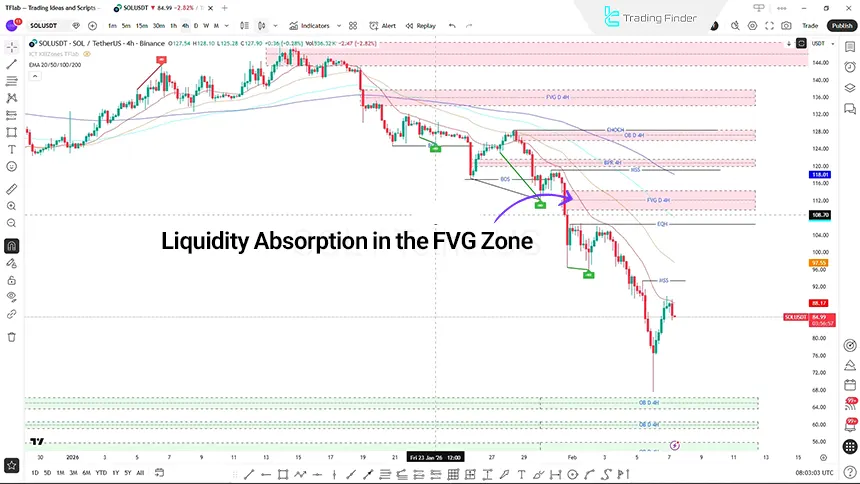
Solana Analysis Using Fair Value Gap (FVG) and Order Block
In the scenario of weakening bearish momentum, the possibility of a Pin Bar forming in the rejection block zone arises. In this case, an upward corrective scenario can be considered.
- The Fair Value Gap (FVG) is at $109.53;
- Internal Liquidity is observed at $106.31.
The absorption of buy-side liquidity in these areas has created the potential for a temporary price correction.
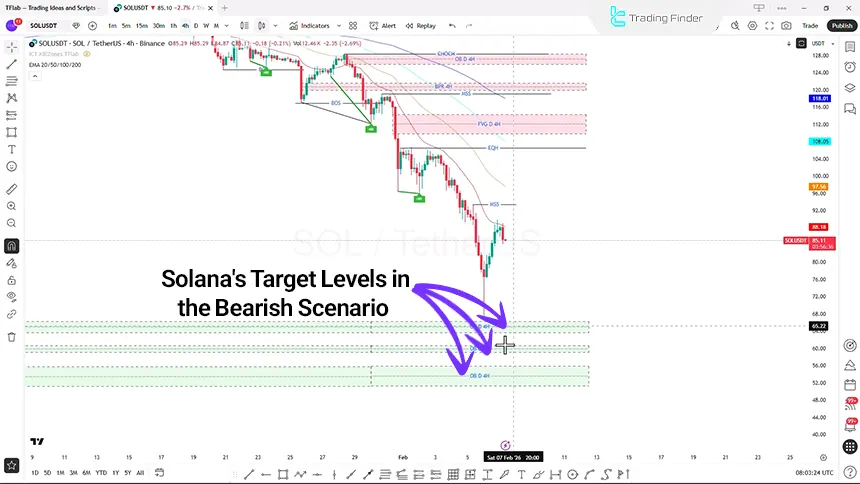
Solana Bearish Scenario
If the bearish structure holds and the price stabilizes below $67.20, the prevailing market scenario will be as follows:
- Activation Condition: Close below $67.20
- Confirmation Signal: Increased bearish momentum and no sustainable reversal
- Potential Targets: $60, $55, and $50
- Expected Behavior: Price entering the bearish order block zones and gathering sell-side liquidity
In this scenario, the market’s focus remains on continued selling pressure and weakened demand.
Solana Bullish and Corrective Scenario
If the market loses its ability to continue the downtrend and signs of selling weakness appear, a corrective scenario will be activated:
- Activation Condition: Formation of a Pin Bar and price rejection from the support zone;
- Entry Point: After confirmation of the corrective structure;
- Stop Loss: Behind the swing or behind the order block zone;
- Targets: 1:1 or 1:2 risk-to-reward ratio and FVG zone at $109.53.
This scenario is considered a temporary correction unless the market structure changes meaningfully.
On-Chain Data and Market Sentiment
Data from Solana-related ETFs shows a net outflow of approximately $12 million from these funds on the last trading day.
Additionally, the Fear & Greed Index is at 8, indicating extreme fear.
These data points suggest:
- Ongoing uncertainty in the cryptocurrency market;
- A decrease in investor willingness to inject new liquidity;
- Strengthening of conservative and bearish scenarios.
However, it is expected that in the $55 to $50 range, trading volume and capital inflow will gradually increase.
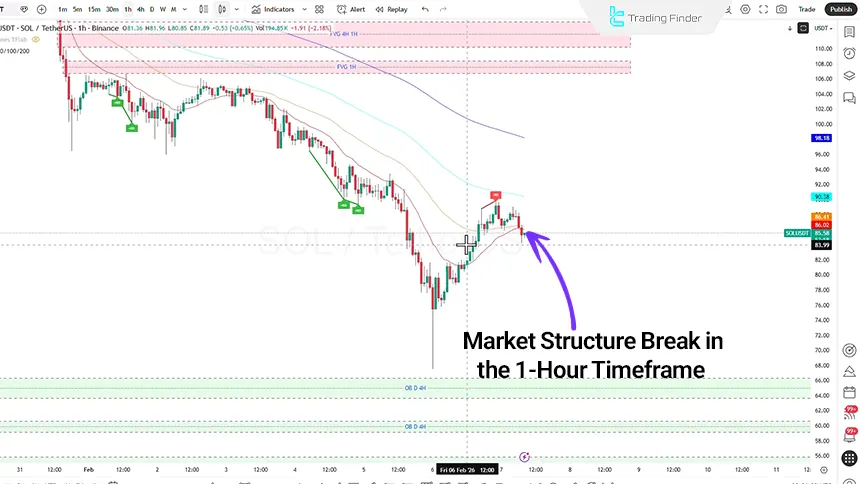
Solana Analysis in the 1-Hour Timeframe (H1)
In the 1-hour timeframe, a Hidden Head and Shoulders pattern has been observed. A break of the neckline, combined with a market structure change, signals a short position entry.
Key levels in this timeframe:
- Structure Break Level: $85.822
- Entry Point: $85.45
- Stop Loss: $90.50
- First Target: $78.66
- Second Target: $74.80
If liquidity increases and price moves upward, buy-side liquidity may be gathered, and a return to the Fair Value Gap (FVG) could trigger another short entry.
Analysis in the 15-Minute Timeframe (M15)
In the 15-minute timeframe, the market structure has entered an Accumulation phase. Price behavior during the London and New York sessions plays a crucial role in determining the short-term market direction.
The likely scenario in this period:
- Downward movement during the London session;
- Reaction to Fair Value Gap (FVG) or order block;
- Possible manipulation move;
- Potential distribution during the New York session.

Conclusion
Solana remains under the influence of the downward trend, momentum weakness, and selling pressure this week. The negative reaction at the $67.50 level, capital outflows from ETFs, and the Fear & Greed Index in extreme fear territory have strengthened the bearish outlook.
However, the $55 to $50 range is identified as a potential liquidity absorption zone and the beginning of a short-term correction. The price behavior at these levels will determine Solana's medium-term direction.


