


Key Notes:
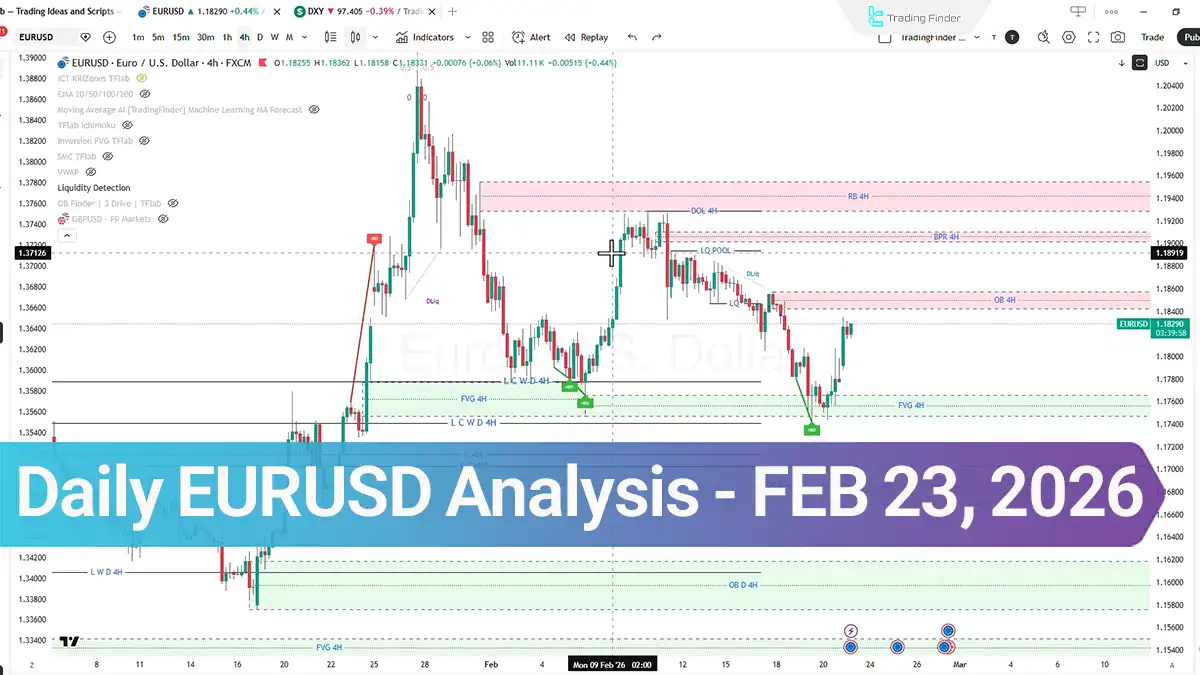
- The EUR/USD pair, after entering a bearish phase, has experienced a bullish corrective move which, if Buy Side Liquidity is collected, may continue toward the bearish Order Block zone;
- On the 1-hour timeframe, continued dollar weakness and increased buying pressure may drive price higher, while the DXY index is likely to continue its bearish trend toward the 97.232 or 96.672 levels;
- The Multi RSI indicator shows price entering the overbought zone, which in the case of a negative divergence may signal the end of the bullish correction and continuation of the bearish trend;
- On the 15-minute timeframe, a pullback to the Order Block zone and identification of a Change of Character (CHoCH) may provide a buy opportunity, while increased selling pressure may lead to the collection of Sell Side Liquidity.
The EUR/USD pair, after a strong move to the downside and entering a bearish phase, experienced a bullish move at the beginning of Monday’s trading session and the opening of Asian markets, which may indicate the continuation of the bullish corrective trend toward the bearish Order Block.
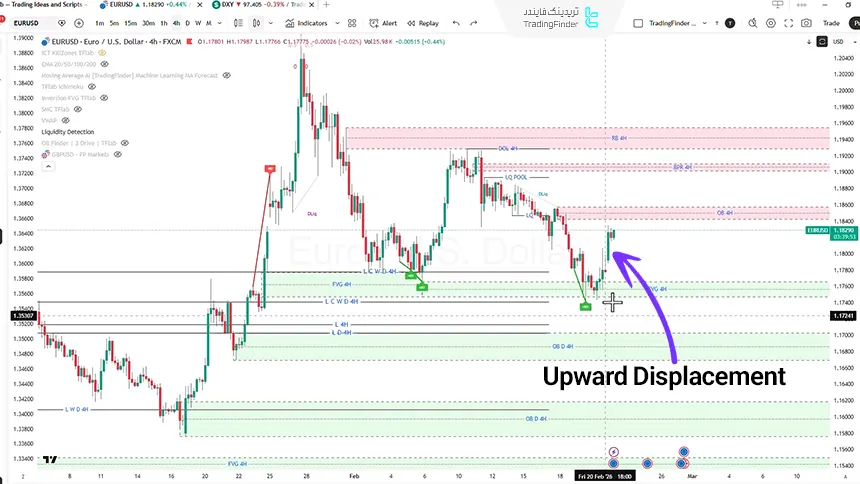
EUR/USD Analysis on the 1-Hour Timeframe
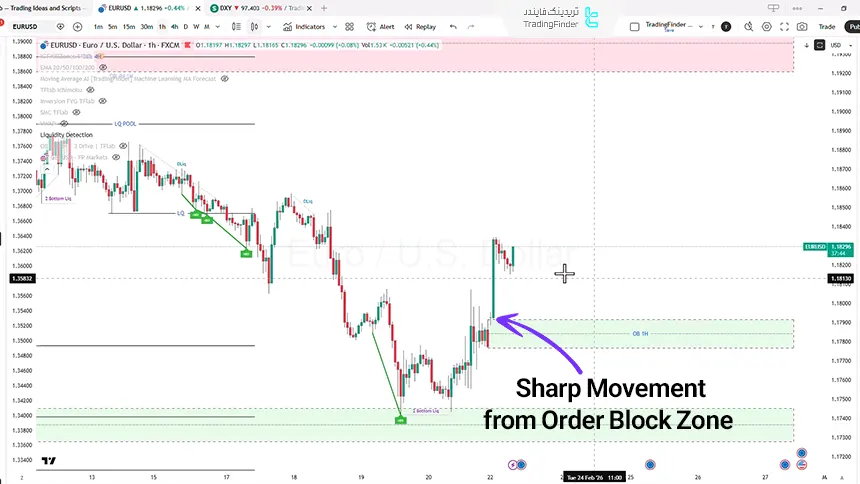
On the 1-hour timeframe, the price has experienced a strong bullish move and has not had sufficient correction in its upward trend. In case of increased buying pressure and continued dollar weakness, price may move higher and collect Buy Side Liquidity.
Analysis of the TradingFinder Multi RSI indicator shows that the price has entered the overbought zone. If this indicator enters the high-potential zone, it may indicate continuation of the bullish trend.
However, in case of identifying a negative divergence or exiting the overbought zone, the probability of the bullish correction ending and continuation of the bearish trend increases.
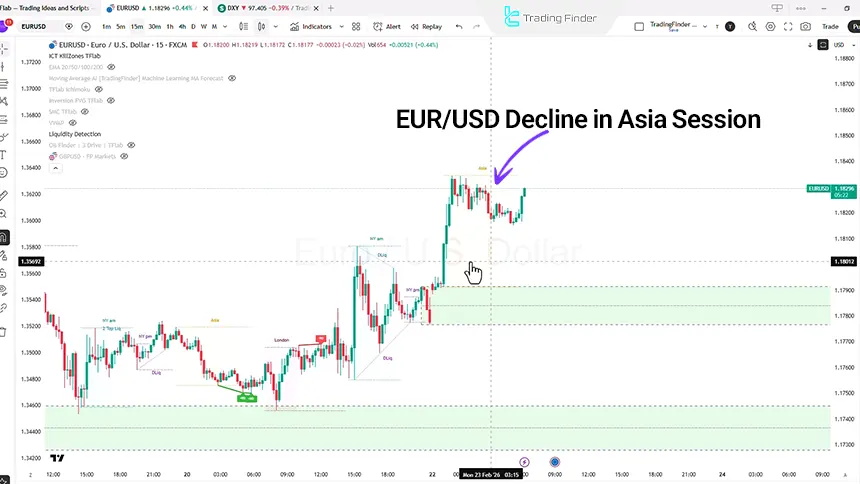
EURUSD Analysis on the 15-Minute Timeframe
On the 15-minute timeframe, price experienced a sharp bullish move at the start of the trading session, then entered a short-term bearish correction and is currently moving upward again.
If price returns to the Order Block zone and weakness in the bearish trend is identified, this zone may be used to enter a buy position.
Additionally, in case of increased selling pressure, price may move downward and collect Sell Side Liquidity.
In this zone, upon price reaction and identification of a structure break or Change of Character (CHoCH), entry into a buy position may become possible.
With increased market momentum, price may collect Buy Side Liquidity and enter the next Order Block zone.
EUR/USD Fundamental Analysis
After approximately 5 to 6 months of uncertainty, the United States Supreme Court declared the tariffs announced by Donald Trump illegal, with 6 judges voting against the legality of these tariffs.
This event increased selling pressure on the dollar, and at the start of the Asian session, the US dollar weakened against most major currencies including NZD, AUD, CAD, JPY, EUR, and even gold.
This movement occurred under Low Liquidity conditions and simultaneous closure of the Japanese and Chinese markets, which led to reduced market liquidity.
However, only a few hours after this ruling, Trump increased the global tariff from 10% to 15%, and this sudden decision pushed the market environment toward Risk-Off sentiment and exerted further pressure on the dollar.
Analysis of the DXY index shows that after an upward move, it has entered a bearish phase and is expected to move toward the Order Block zone at the 97.232 level or continue its bearish trend toward the 96.672 level in case of increased selling pressure. Dollar weakness may lead to euro strength.
On the other hand, the high Correlation between the euro and the GBP pair indicates that GBP weakness may also affect the euro and lead to a downward price movement.
Conclusion
Weakness in the DXY index alongside Low Liquidity conditions has created the foundation for a short-term bullish move in EUR/USD.
However, price positioning within the overbought zone and the potential formation of divergence in the Multi-RSI indicator may signal a correction or continuation of the bearish trend.
Price reaction to the 97.232 and 96.672 levels in DXY may play a key role in determining the next direction of EUR/USD from a momentum and liquidity structure perspective.


