


Key Points:
- Ethereum, after a Liquidity Sweep and Stop Hunt, has maintained its bearish structure, and the dominant scenario remains continued selling pressure; unless a meaningful weakness in bearish momentum is observed;
- In the 4-hour timeframe of ETH, if price stabilizes below supply zones, the target will be the swing low and Draw on Liquidity areas; a price return after collecting Buy Side Liquidity and closing inside the range can activate the renewed selling scenario;
- BNB on the 4-hour timeframe, after breaking the trendline and the triangle pattern, created a selling opportunity with a pullback and achieved a 1:3 risk-to-reward target;
- In the current BNB structure, Compression and a new triangle pattern may represent a Buy Side Liquidity accumulation zone; if upper liquidity is collected and price returns inside the range, the renewed selling scenario will be activated with a stop loss placed behind the swing.
In recent trades, both assets moved in line with the projected scenario, accompanied by selling pressure. Ethereum, after a Liquidity Sweep and execution of a stop hunt, maintained its bearish structure, and Binance Coin also achieved a 1:3 risk-to-reward return by breaking the trendline and the triangle pattern.
Under current conditions, the market focus is on collecting Buy Side Liquidity before a potential continuation of the bearish trend or the formation of a structural shift.
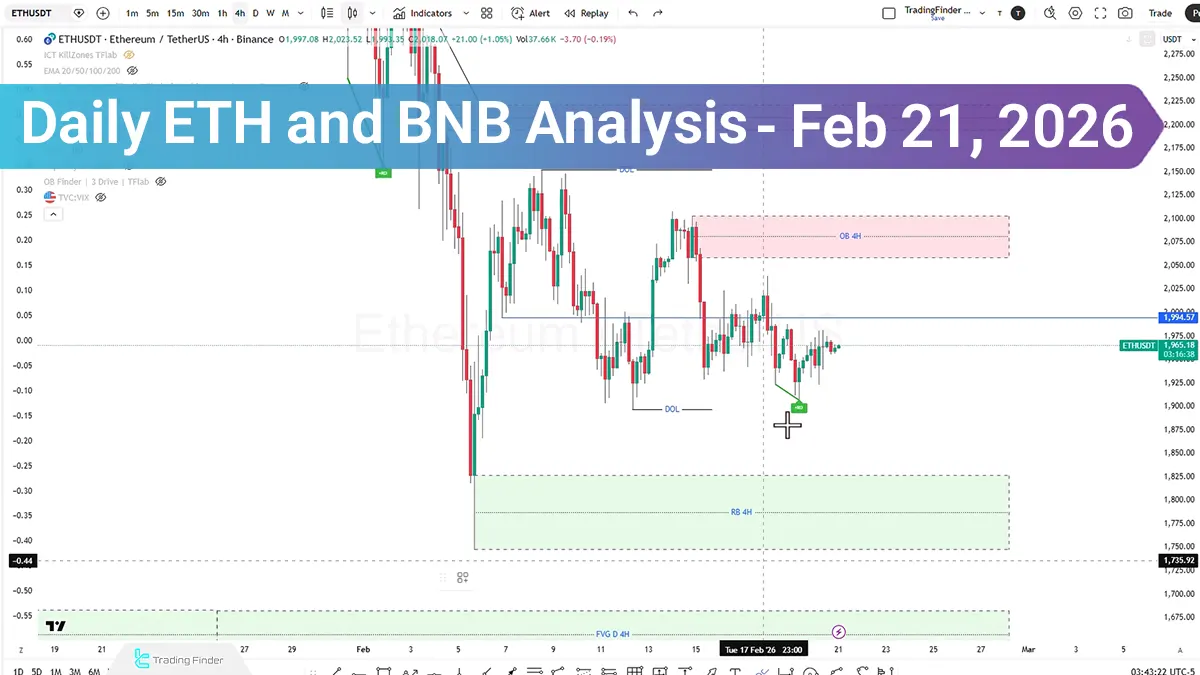
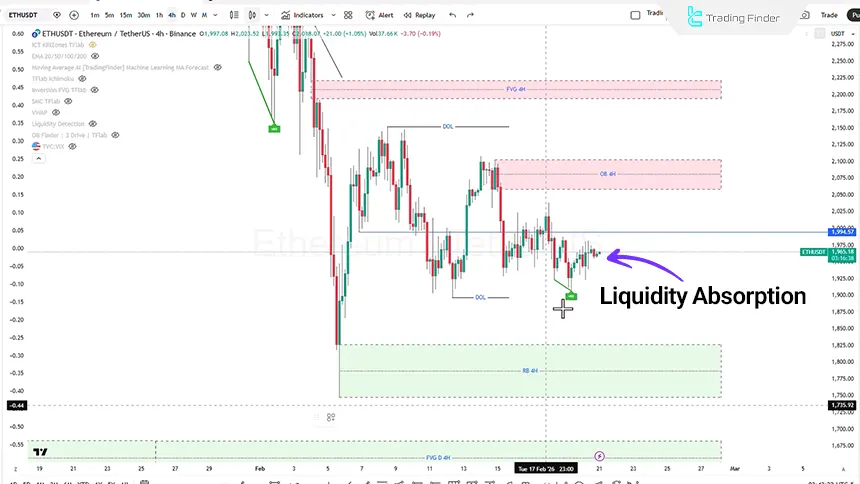
Analysis of ETH on the 4-Hour Timeframe (H4)
Ethereum, after executing a Liquidity Sweep and a short-term correction, carried out a stop hunt, which indicates liquidity absorption before the continuation of the main market move. Based on the current structure, the dominant scenario remains the continuation of the bearish trend, unless a significant weakness in bearish momentum is observed.
Additionally, if price moves upward and collects Buy Side Liquidity but closes again within the consolidation range, this behavior may signal selling pressure and weakness in the bullish trend; in this case, the selling scenario targeting the swing low will be activated.
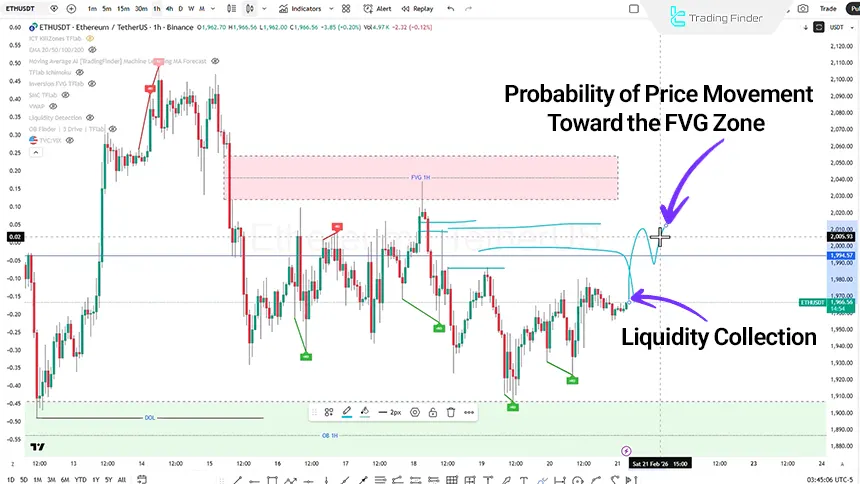
Analysis of ETH on the 1-Hour Timeframe (H1)
On the 1-hour timeframe, the previous trading signal was issued in the equilibrium zone and the entry point was precisely triggered.
In this situation, the stop loss was placed behind the identified swing to properly cover the market structure.
Subsequently, by maintaining price momentum, the market moved beyond the initial targets and ultimately achieved approximately a 1:3.5 risk-to-reward ratio, reflecting correct execution of the trading scenario and alignment with the market structure.
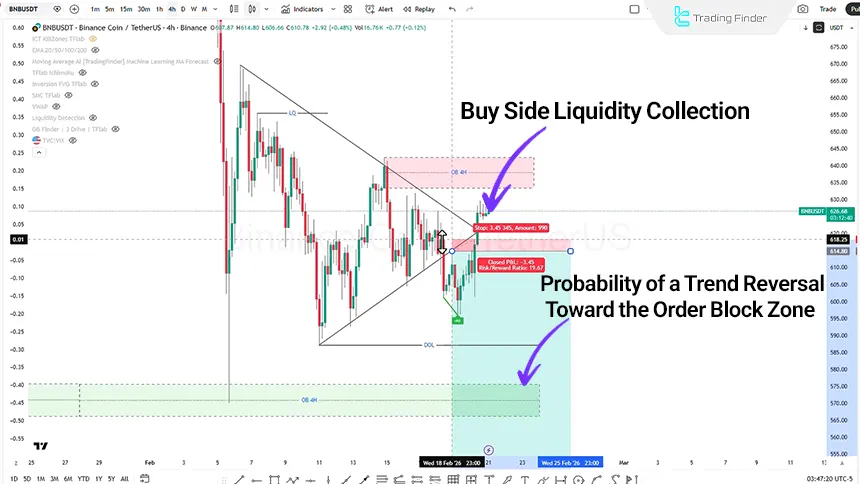
Analysis of Binance Coin on the 4-Hour Timeframe (H4)
On the 4-hour timeframe, after a candle closed outside the trendline and the triangle pattern, price provided a selling entry opportunity with a pullback as follows:
- The entry point was activated on the pullback;
- The stop loss was placed behind the specified candle;
- Targets of 1:1 and 1:2 were defined;
- Ultimately, price reached a 1:3 risk-to-reward ratio.
Currently, a triangle pattern and Compression are forming, which may act as a Buy Side Liquidity accumulation zone. If price moves upward and collects Buy Side Liquidity but closes again within the range, the Ryan Soldier strategy will be executed.
Conclusion
Ethereum and Binance Coin, after executing stop hunts and structural breaks, have entered a decision phase between liquidity collection and continuation of the bearish trend.
Price behavior in Rejection Block and Order Block zones, along with the manner of candle closures, will determine the dominant scenario. As long as no confirmed structural shift is observed on key timeframes, a scenario-based approach and liquidity-driven risk management will remain the primary trading priority.


