


MACD stands fo rin trading “Moving Average Convergence Divergence”. This indicator utilizes moving averages, historical data, divergence and convergence to determine market momentum.
The large number of MACD indicator components allows for the design of various trading macd strategies. trading using macd provides traders with insights into different sections of the chart.
Components of the MACD Indicator
The MACD Indicator consists of three components: the MACD Line, the Signal Line, and the MACD Histogram.
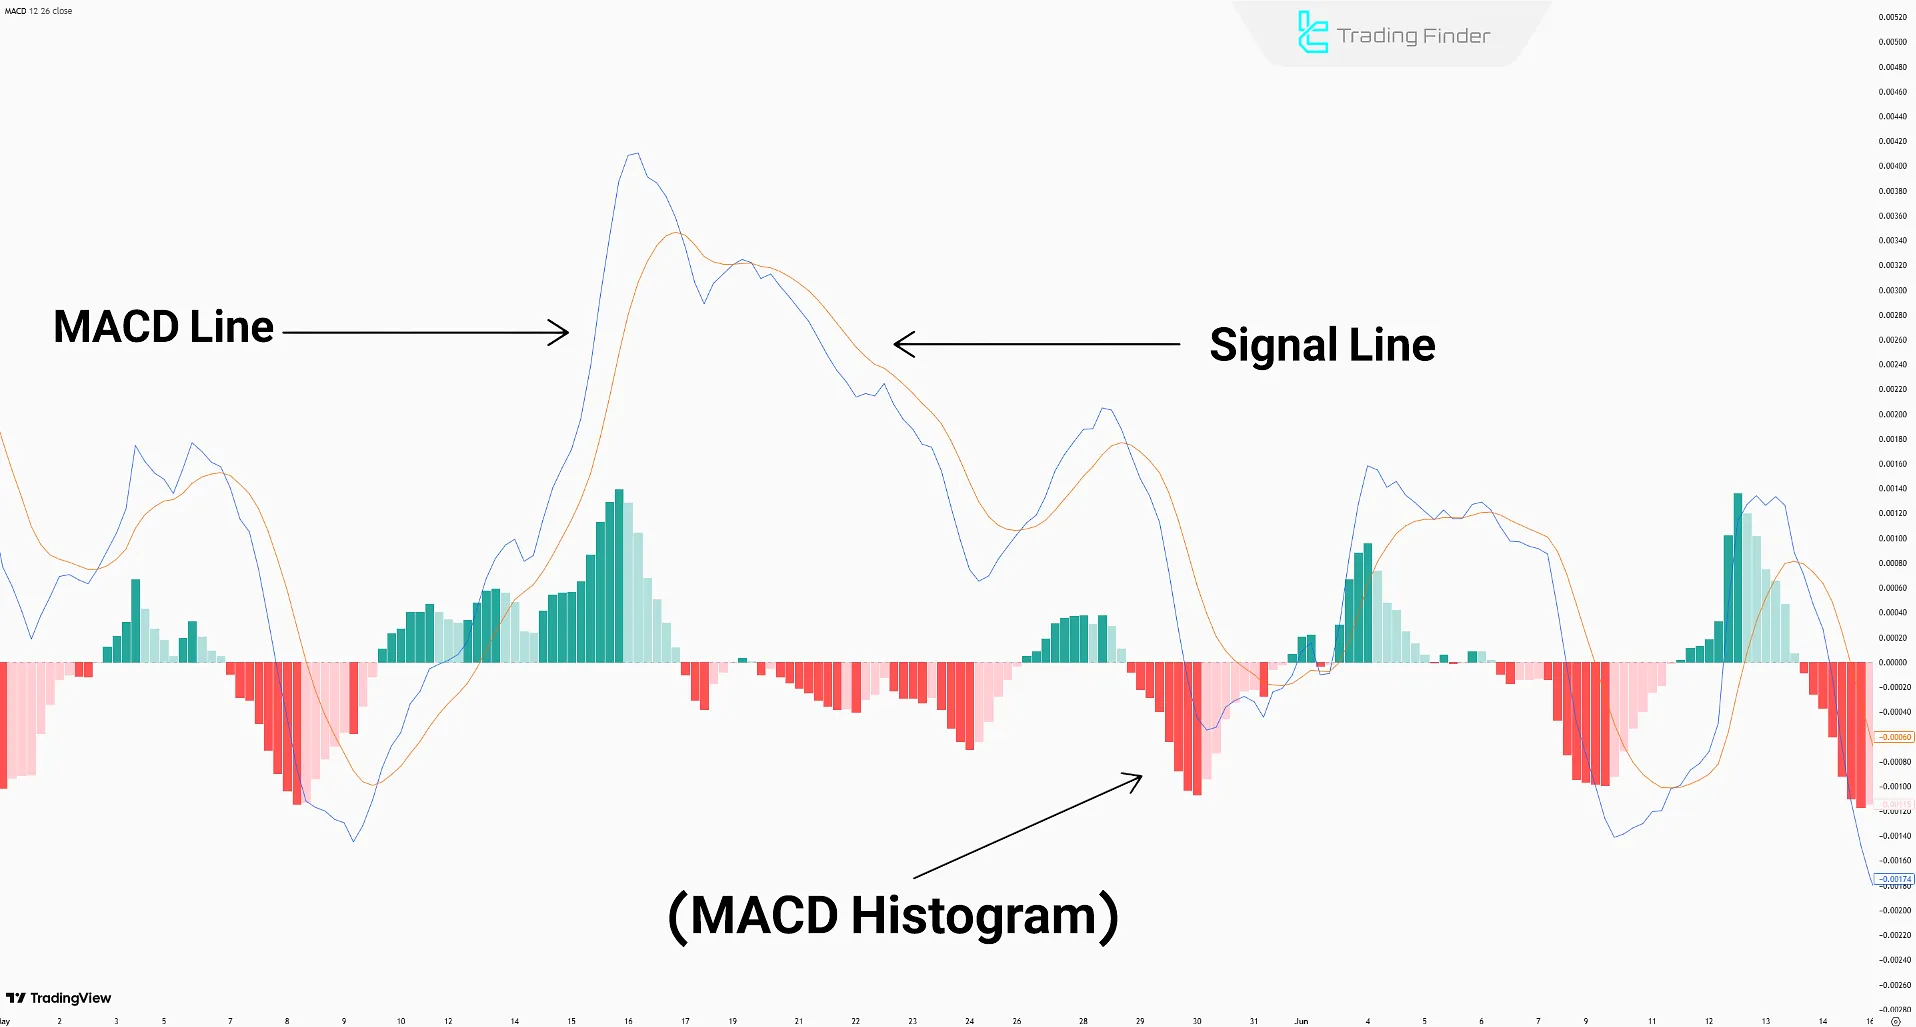
MACD Line
The MACD Line is calculated by subtracting the 26-period EMA from the 12-period EMA.
When the line is above the zero line, it indicates more substantial buying power. when it is below, it suggests more substantial selling power.
Signal Line
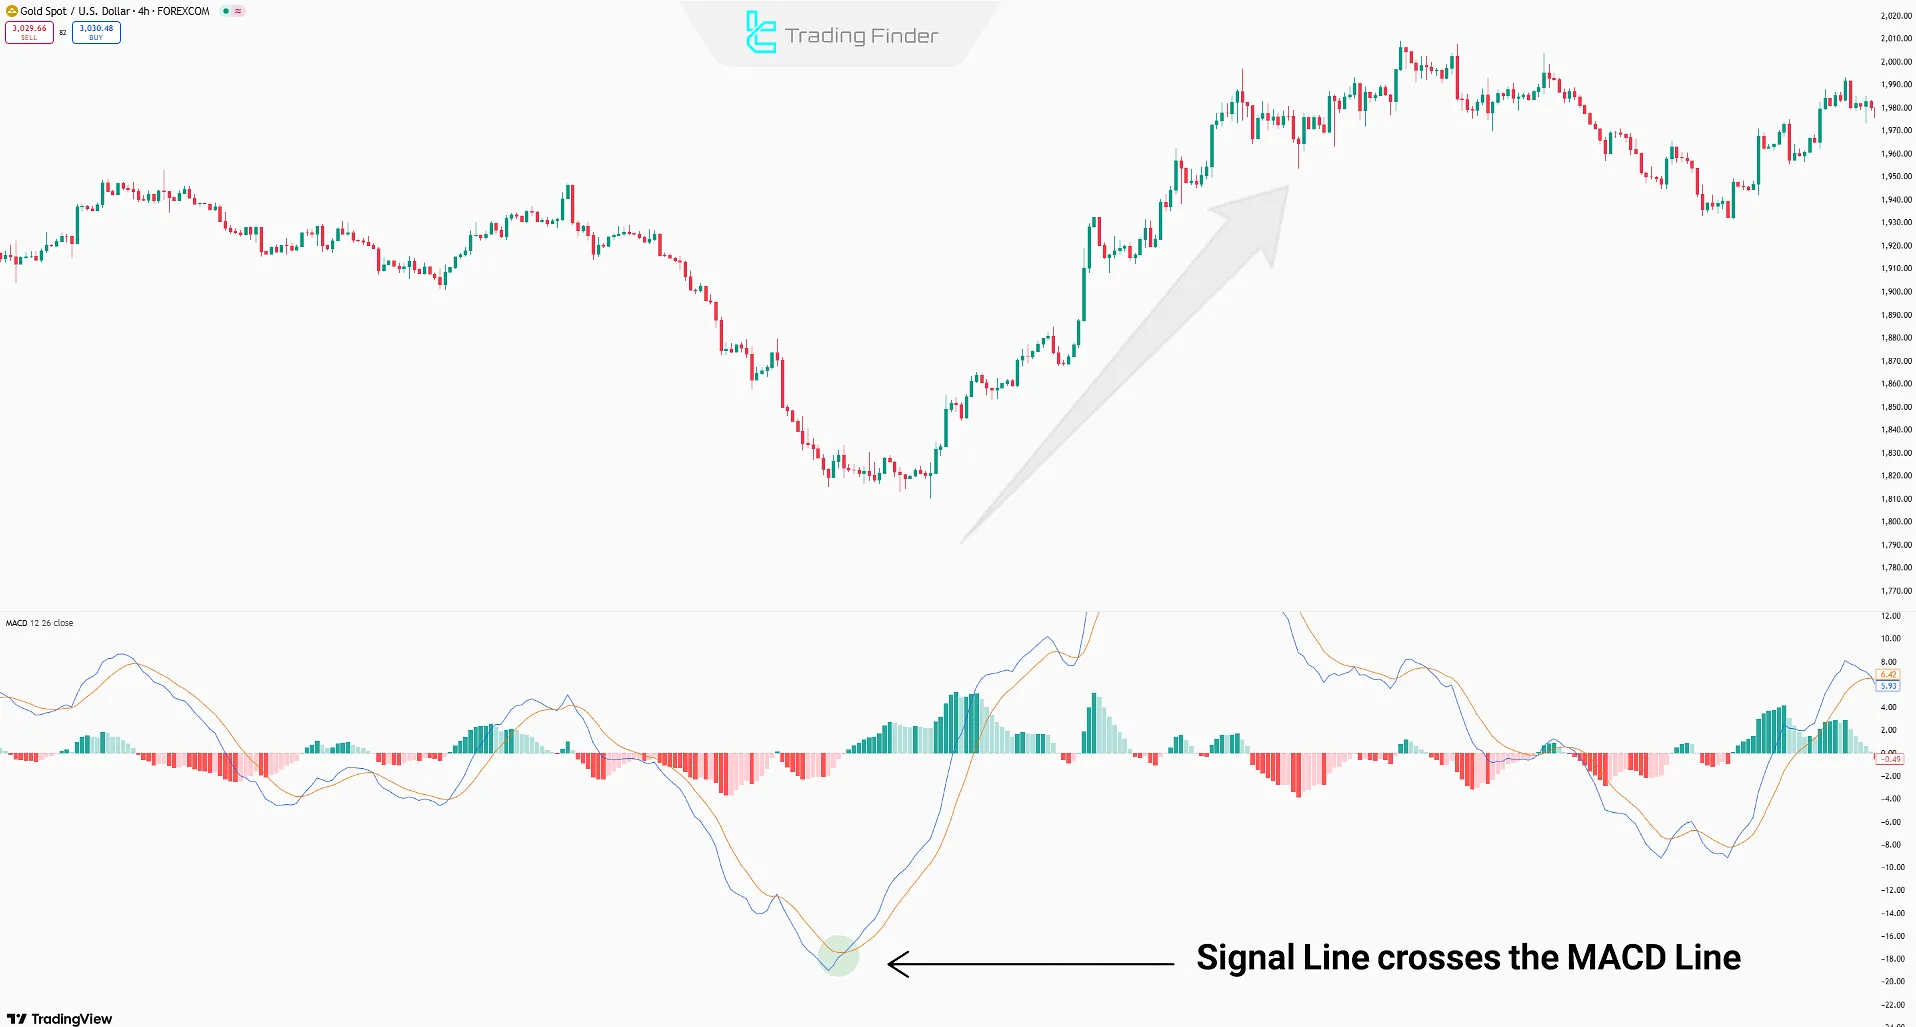
The signal line is a 9-period EMA of the MACD Line, acting as a filter to reduce noise.
When the signal line crosses the MACD Line from below, it suggests increasing buyer momentum, and when it crosses from above, it indicates stronger seller activity.
MACD Histogram
The MACD histogram is composed of bars that visualize market momentum. It calculates the difference between the MACD Line and the Signal Line.
Positive bars show buyer dominance, while negative bars indicate seller control. The size of the bars reveals the strength of the trend.
MACD Histogram Calculation Formula:
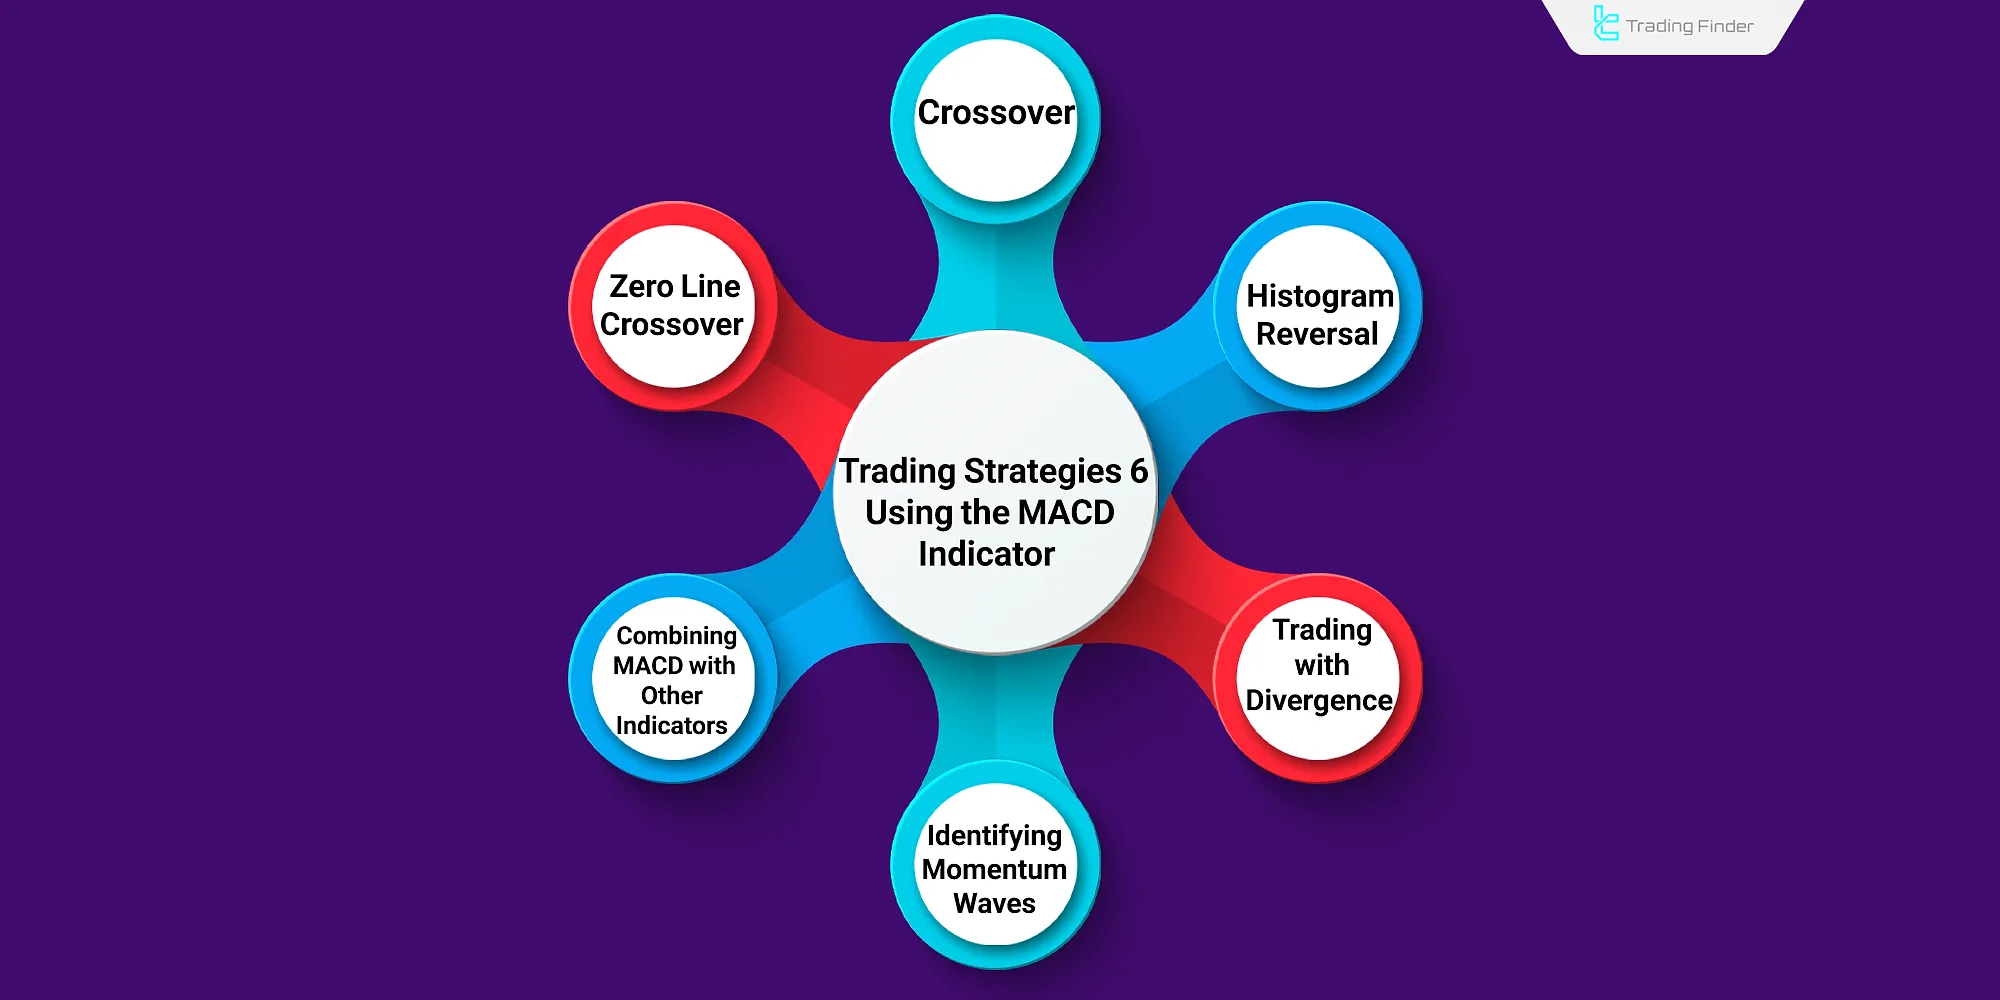
6 Trading Strategies Using the MACD Indicator
The MACD indicator, through its diverse moving averages and formation of the MACD Line, Signal Line, and Histogram, allows traders to implement various strategies across all financial markets, including the Forex market, stocks, and crypto. These strategies include:
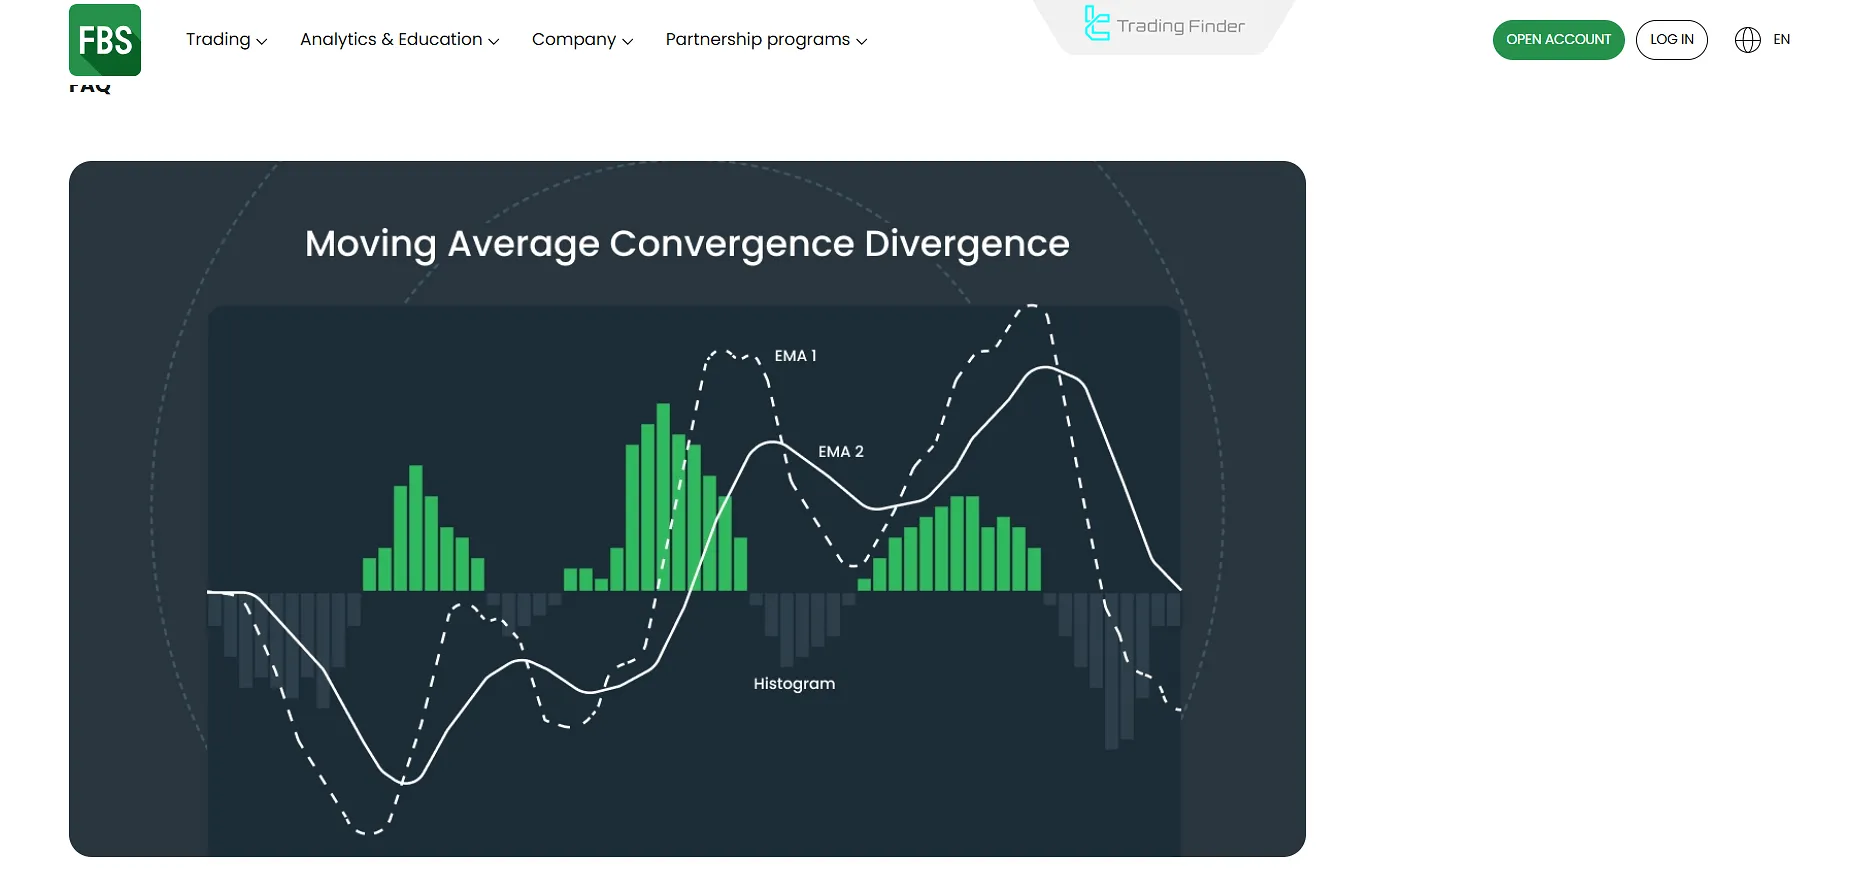
In the tutorial article on learning MACD strategy from the FBS.com website, the method of using this indicator in various trading strategies is explained.
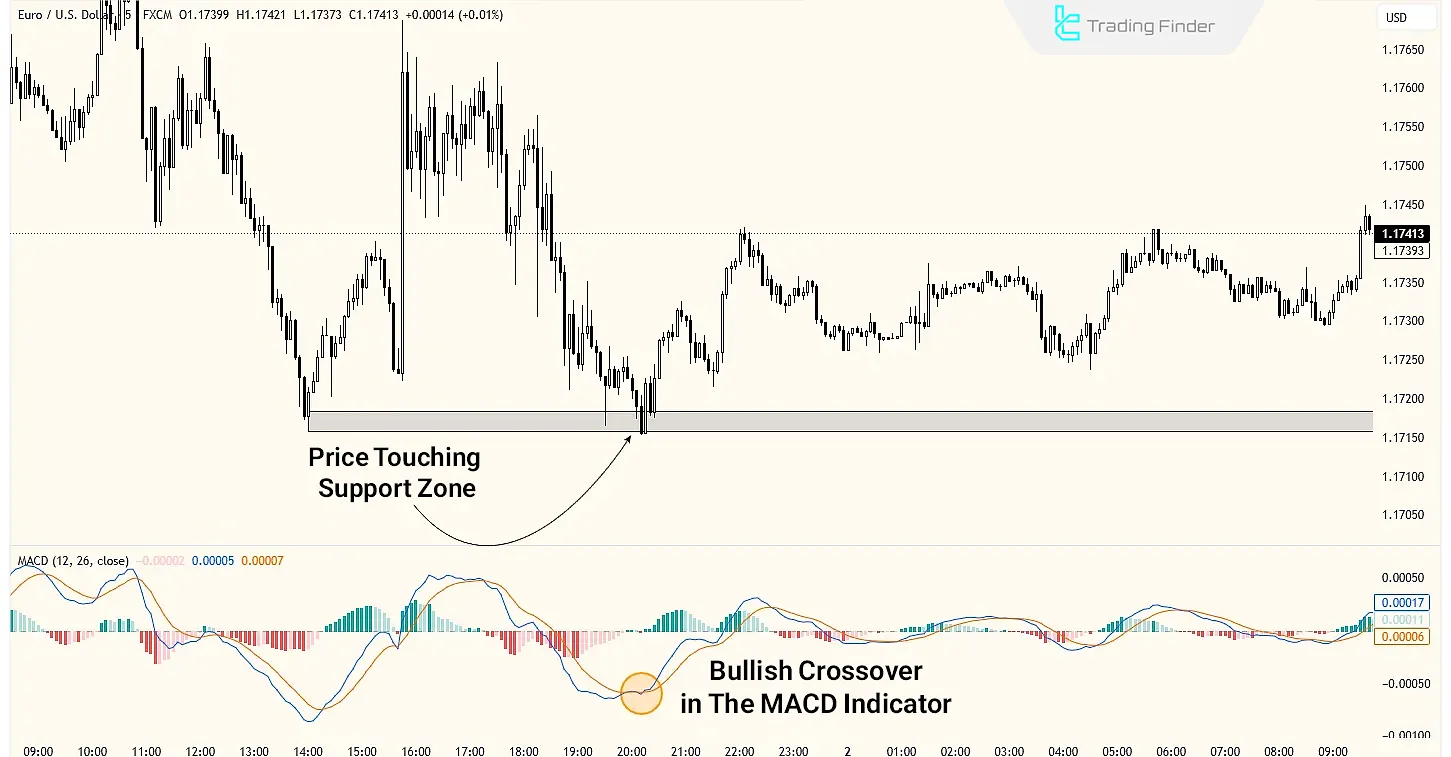
The Crossover Strategy
When the Signal Line crosses the MACD Line, it signals a potential trend change.
If the Signal Line crosses the MACD Line from below, it indicates a buy signal, and if it crosses from above, it indicates a sell signal.
Note: Combining the crossover strategy with other technical analysis concepts such as support and resistance increases the reliability of thismacd forex trading strategy’s signals. In addition, professional traders use concepts like price correction or candle structure alongside these techniques to enhance trading accuracy.
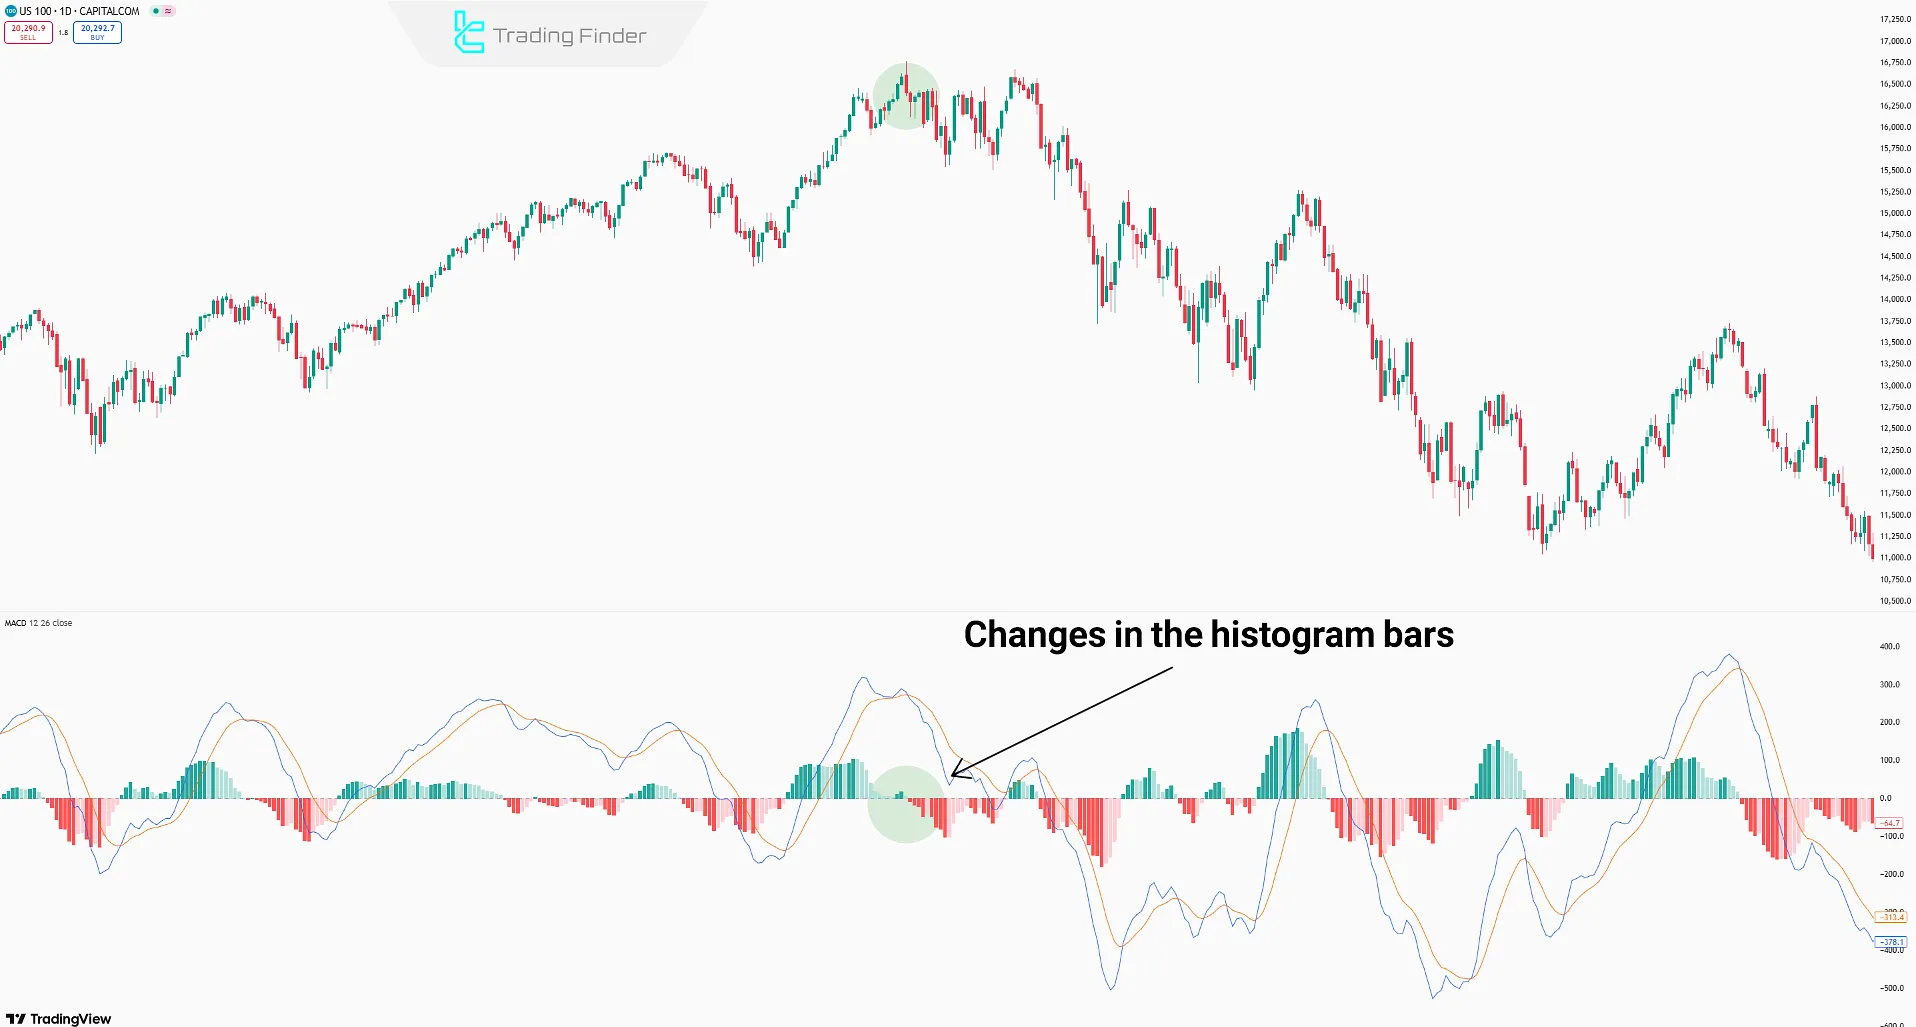
macd histogram strategy
Changes in the histogram bars on higher timeframes (daily and 4H) indicate shifts in buyer/seller strength.
A shift from positive to negative bars signals more substantial selling pressure (Sell Signal), while a change from negative to positive indicates growing buyer power (Buy Signal).
Note: The trading strategy is more reliable when the price is near support/resistance levels. Longer histogram bars also enhance signal strength.
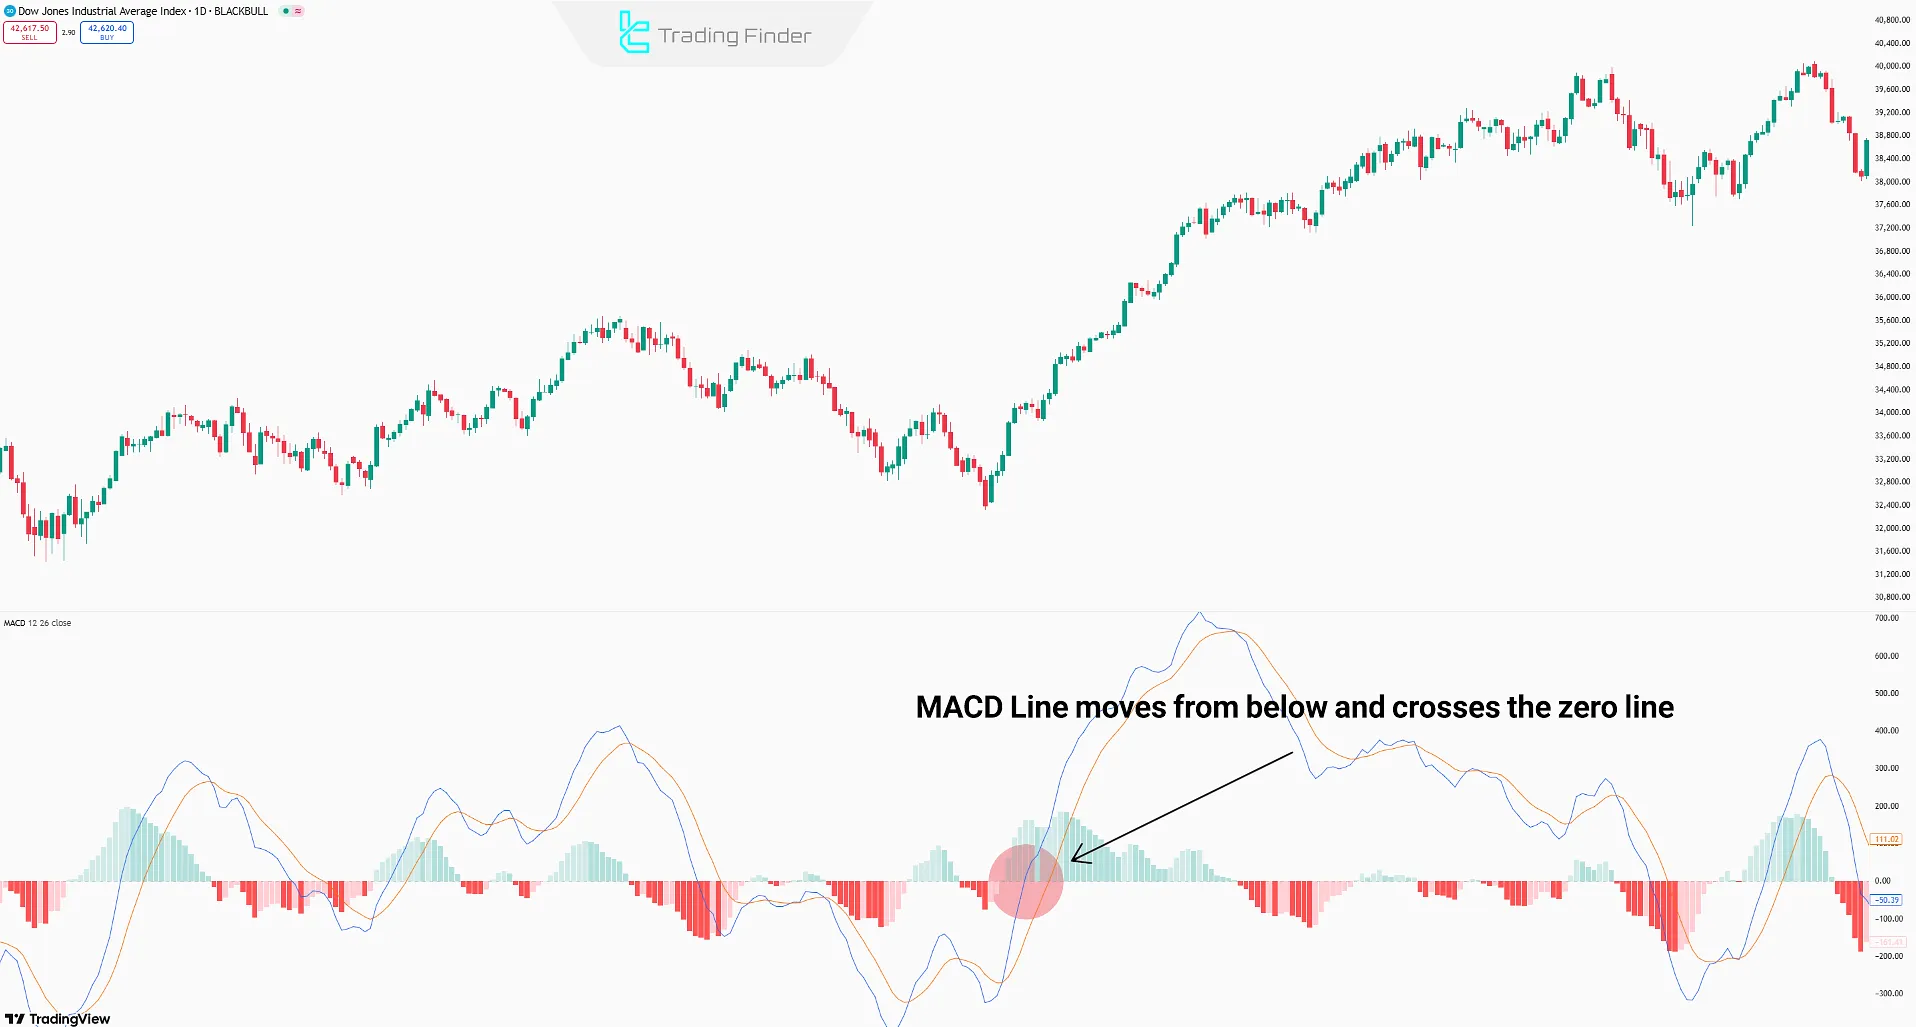
The Zero Crosses Strategy
The zero line in MACD represents market indecision and balance between buyers and sellers.
- When the MACD Line moves below the zero line and crosses it, it indicates a bullish reversal;
- When the MACD Line moves from above and drops below the zero line, it indicates a bearish reversal.
Note: The Zero Crosses strategy gains more credibility in higher timeframes (Daily/4H) and when breaking key support or resistance levels.
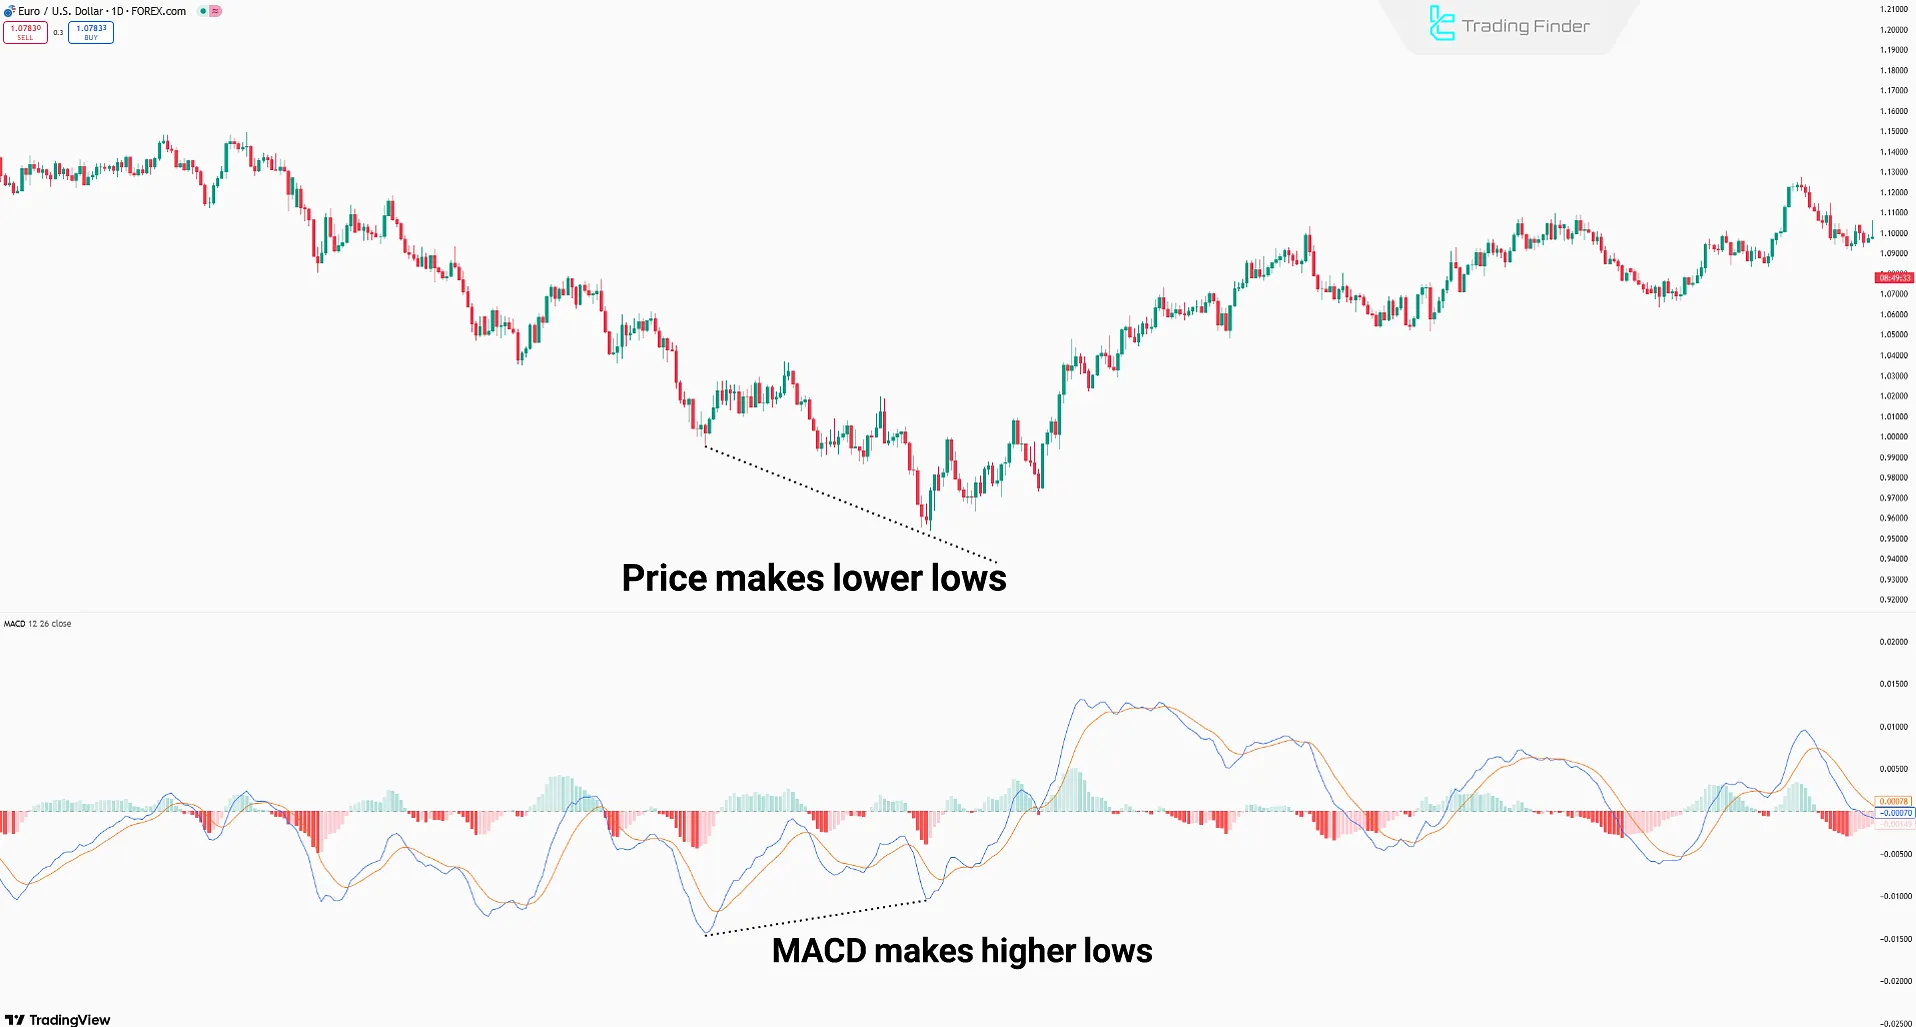
MACD divergence strategy
A divergence occurs when the highs and lows of price action move in the opposite direction to the MACD.
- Bullish Divergence: Price makes lower lows, while MACD makes higher lows (Possible buy setup);
- Bearish Divergence: Price forms higher highs, while MACD forms lower highs (Possible sell setup).
Note: Combining divergence with classic chart patterns reduces false signals and enhances entry accuracy.
MACD Combination Strategy with Other Indicators (MACD Combination Strategy)
One of the main challenges when using the MACD indicator is the generation of false signals in ranging or low-volatility markets.
To reduce this issue, many professional traders combine MACD with other indicators such as the Relative Strength Index (RSI) or the Stochastic Oscillator.
This combination helps better identify overbought and oversold conditions and filters out market noise.
For instance, when MACD gives a bullish signal and RSI is simultaneously above the 50 level, the probability of a successful trade increases.
Furthermore, combining MACD with candlestick patterns and key support and resistance levels significantly improves the accuracy of entry and exit signals.
Note: The combination strategy performs better on mid-term and long-term timeframes such as H4 and Daily, as false market fluctuations are less frequent in these periods.
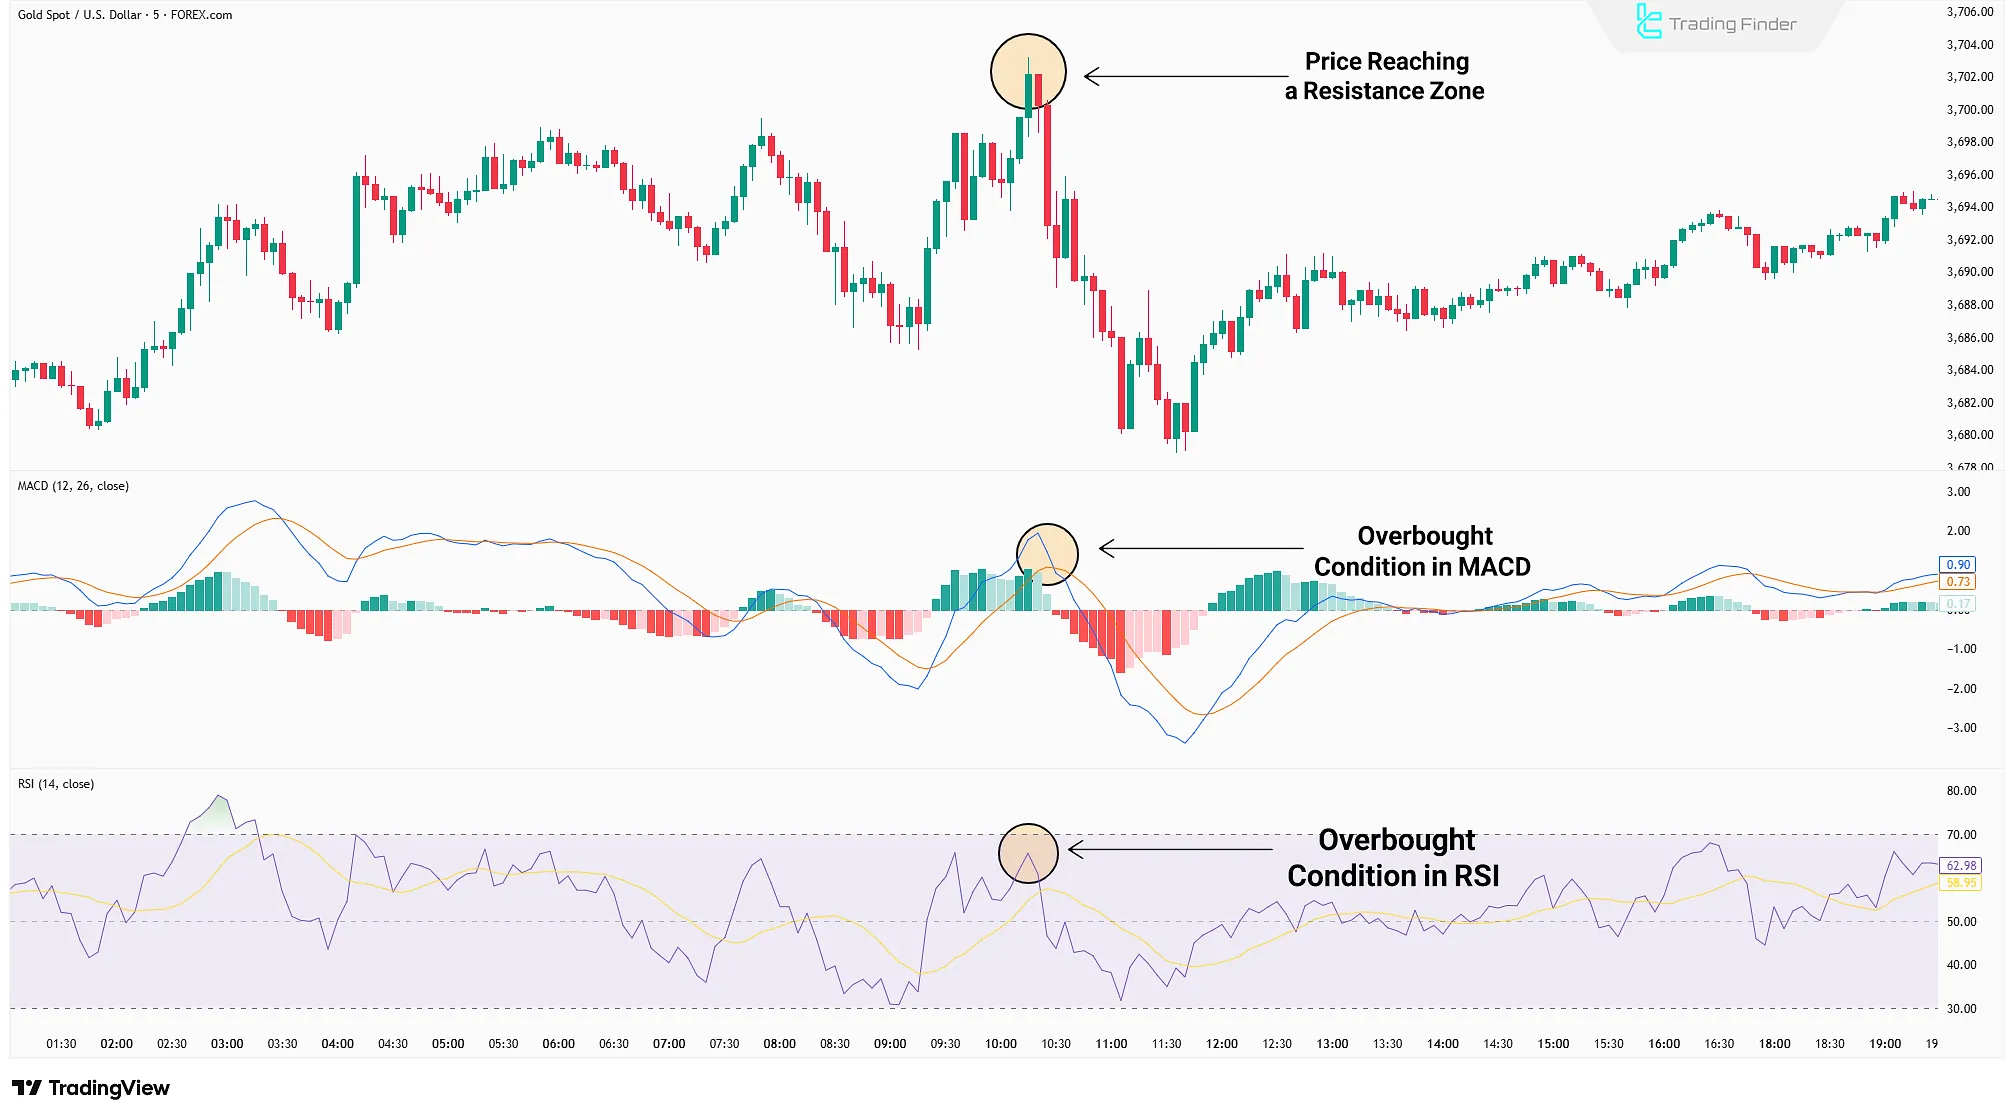
Example of Combining MACD and RSI Indicators
The combination of the MACD and RSI indicators filters out false signals from both tools and increases the trade win rate.
An entry signal in the MACD and RSI strategy occurs when both indicators show overbought or oversold conditions.
For example, in the chart below, the price of gold (XAU/USD) reaches a resistance area while both the MACD and RSI indicators show overbought levels. The overlap of these signals provides a strong confirmation for a sell trade setup.
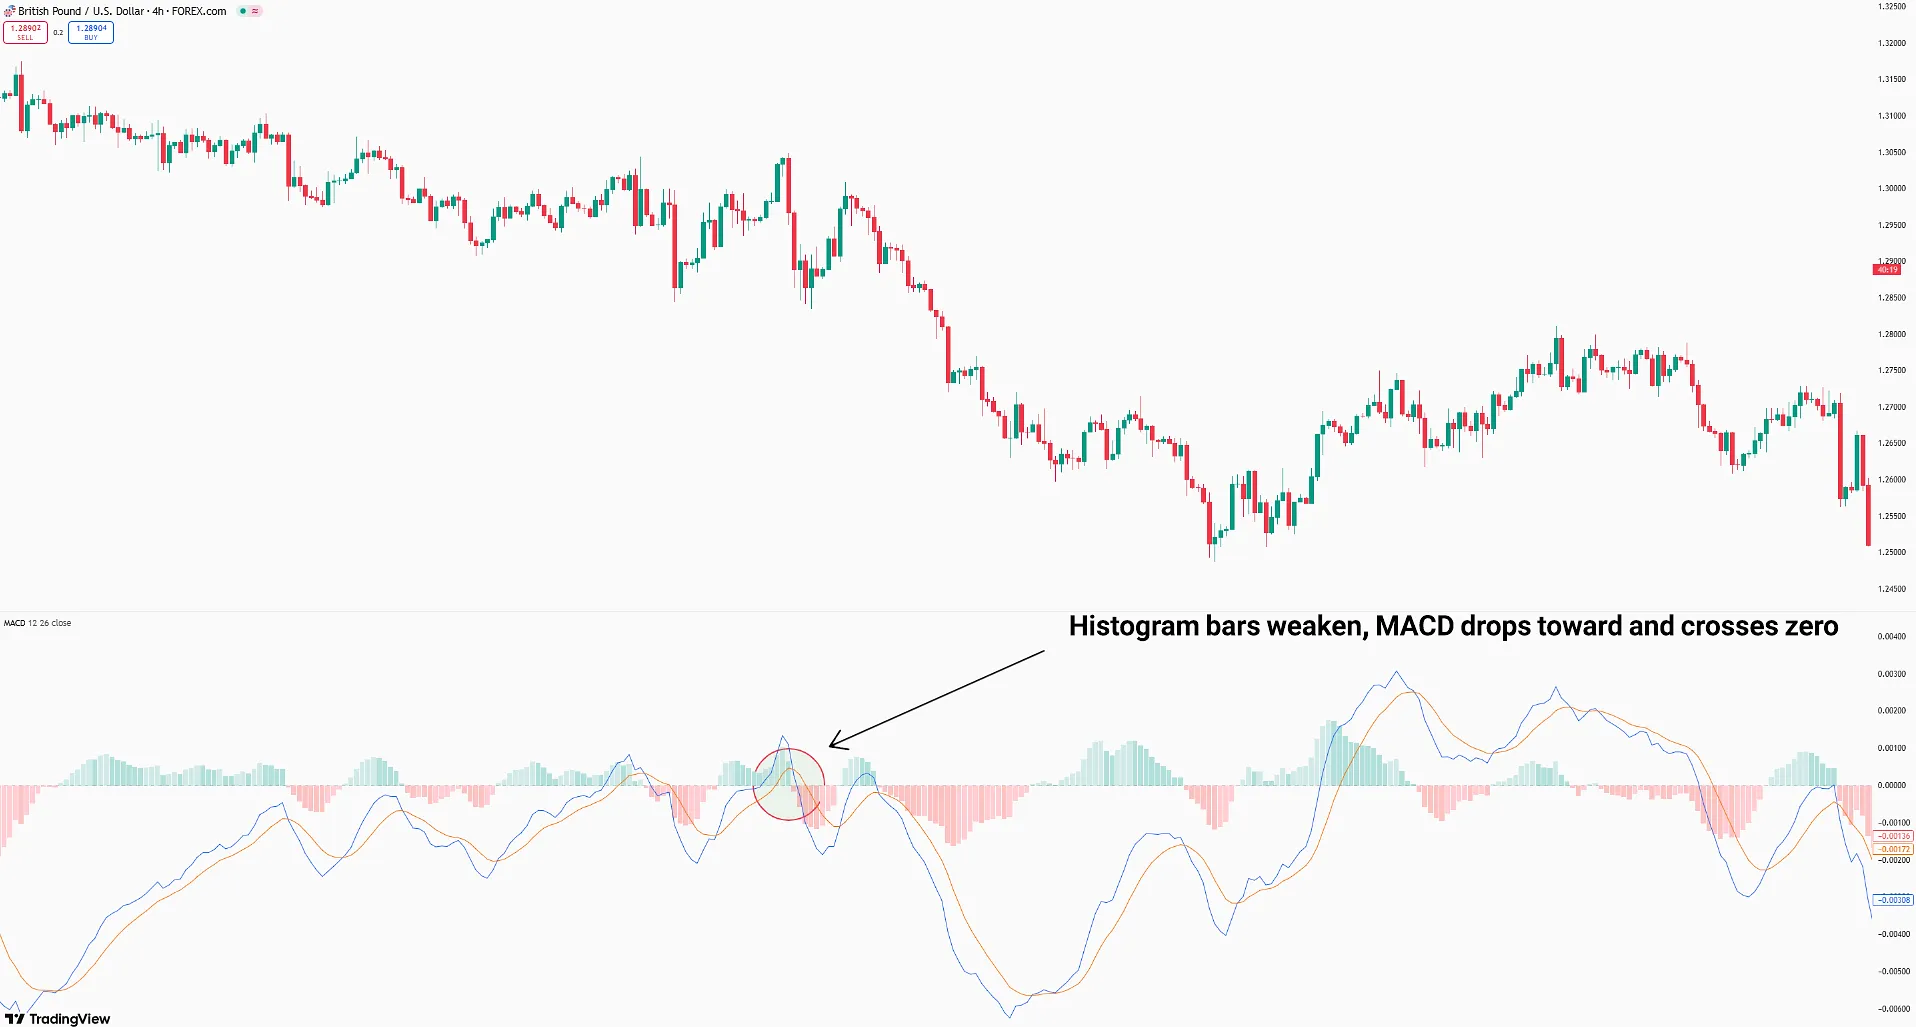
MACD Momentum Strategy
The strategy identifies market momentum shifts using histogram bar sizes and MACD Line movements.
- Buy Setup: MACD and histogram are below the zero line. Histogram bars shrink, and MACD rises toward and crosses zero (Buy signal);
- Sell Setup: MACD and histogram are above zero. Histogram bars weaken, and MACD drops toward and crosses zero (Sell signal).
Pros and Cons of MACD
Understanding MACD's strengths and limitations reveals where it is most effective and when additional filters are required:
Pros | Cons |
Combining trend and momentum analysis | False signals in ranging markets |
Usable in multiple timeframes | Delayed signals due to moving averages |
Detecting trend shifts via zero-line cross | No definitive signals from line crossovers |
Highlighting momentum weakness through divergence | Unstable histogram behavior in some cases |
Easily combined with other technical tools | Needs extra filters in high-volatility markets |
MACD Settings
MACD has default settings useful for mid-term trading. However, settings vary based on trading style:
Trading Style | Best Timeframe | MACD Line Settings | Signal Line Settings | Characteristic |
Scalping | 1 to 15 minutes | (5,13,16) | EMA (5) | Very fast reaction |
Day Trading | 15 min to 1 hour | (5,21,8) | EMA (5) | Reduced signal noise |
Swing Trading | 4H to Daily | (9,26,12) | EMA (9) | Standard settings |
Position Trading | Daily to Weekly | (18,52,24) | EMA (18) | Focus on major trends |
Advantages and Disadvantages of MACD Trading Strategies
Each MACD trading strategy has its own unique characteristics. Understanding the strengths and weaknesses of these strategies helps traders select the most suitable MACD strategy according to market conditions and their trading style.
On the YouTube channel Trade Prime, four different MACD trading strategies are explained through video examples:
Advantages and Disadvantages of MACD Trading Strategies
Strategy | Advantages | Disadvantages |
Crossover | Simple and easy to understand, suitable for beginner traders | Signal delay in fast-moving markets |
Histogram Reversal | High clarity in detecting momentum shifts | Too sensitive on lower timeframes, leading to false signals |
Zero Line Crossover | Good for identifying major trends and market direction changes | Generates fake signals in ranging or sideways markets |
Divergence | Allows early detection of trend reversals | Requires high experience to analyze correctly and avoid misinterpretation |
Combination Strategy | Improves signal accuracy by combining with other indicators | More complex execution and requires additional time for multi-layered analysis |
MACD Momentum Waves Strategy | Detects momentum shifts by combining MACD line and histogram; provides early entry signal after zero-line breakout | Risk of false signals in sideways markets or during low trading volume |
MACD Double Indicator
The MACD Double indicator is an upgraded version of the classic MACD, offering greater accuracy in trading signals by adding a higher timeframe filter.
This trading tool visually displays trend changes through candle color variations, allowing traders to quickly identify entry and exit points.
The core function of MACD Double is based on the crossover of the MACD line and signal line, as well as crossing the zero level. When candles change color from red to blue, it signals the start of a bullish move.
Conversely, a shift from blue to red indicates the beginning of a bearish trend. This visual display makes it easy even for beginner traders to use without additional complexity.
The indicator works effectively across various markets including Forex, cryptocurrency, and stocks, and is particularly suitable for short-term or intraday trading.
In currency pairs such as EUR/USD, as well as major indices like gold (XAU/USD) and cryptocurrencies like NEAR, the color changes clearly indicate potential entry or exit points.
From a technical standpoint, the MACD Double offers extensive customization options. Traders can modify parameters such as Fast EMA, Slow EMA2, and MACD SMA3 according to their strategy.
The tool is also equipped with multiple alert systems including Audible Alerts, Send Email, and Push Notifications for mobile alerts.
In conclusion, the MACD Double indicator is a practical tool for identifying bullish and bearish trend reversals. Traders can simply monitor candle color changes to receive reliable buy or sell signals while using alerts for quick responses.
This combination makes MACD Double a valuable addition to trading systems across multiple markets.
Application of the MACD Indicator in Different Markets
MACD is used across all financial markets including Forex, stocks, commodities, and cryptocurrencies.
For example, in the EUR/USD major pair, it helps identify long-term trends, while in highly volatile markets like Bitcoin or crude oil, it acts as part of an advanced macd trading system .
In crypto scalping, MACD becomes a practical tool for quick entries and exits when combined with smaller timeframes and volume confirmations.
- Forex: MACD is most effective on major currency pairs such as EUR/USD or GBP/USD. Combining it with higher timeframes like H4 or Daily helps clarify dominant trends;
- Stocks: In the stock market, MACD is often analyzed alongside trading volume. When the MACD line crosses the signal line with increasing volume, it generates a stronger trend change signal;
- Commodities: In markets like gold (XAU/USD) or crude oil, MACD effectively identifies sudden momentum shifts caused by economic news;
- Cryptocurrency: Due to high volatility, using MACD in crypto is more effective on mid-term timeframes to avoid short-term noise and false readings.
Note: In every market, using the MACD alone is not sufficient; it should be combined with tools such as support and resistance levels and volume indicators for optimal accuracy.
Conclusion
The MACD indicator analyzes market structure and momentum by combining moving averages. Its three components the MACD Line, Signal Line, and Histogram simultaneously reflect trend changes and momentum weakness.
macd indicator strategy such as the Crossover Strategy, the Histogram Reversal Strategy, and the Zero Crosses Strategy offer different methods for trend analysis and trade entries.


