


One of the techniques that traders use in technical analysis to assess potential trend weakening and identify key price levels is divergence.
Proper use of this method requires an accurate understanding of price structures, their interaction with technical indicators, and adherence to rules developed over time by professional traders.
What Is Divergence?
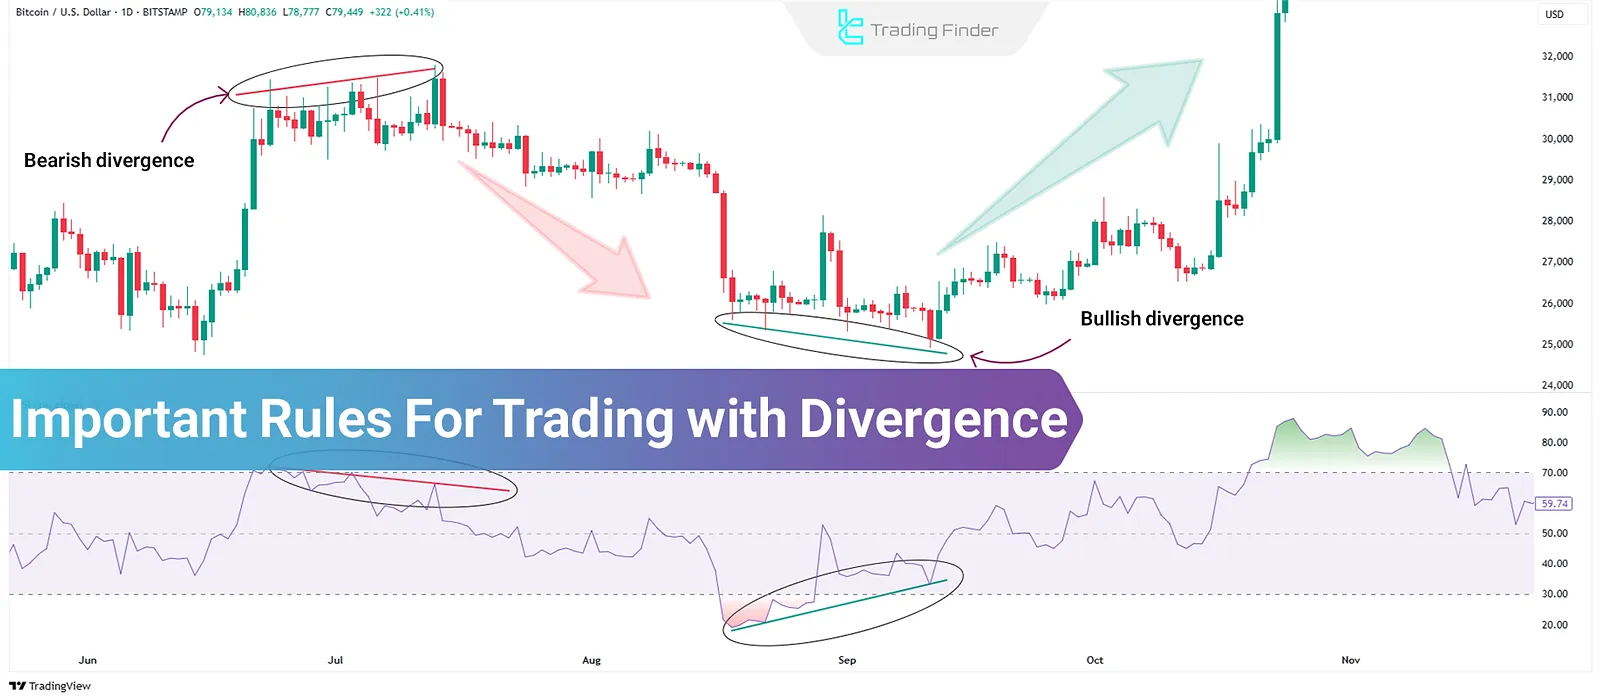
Divergence in trading occurs when the direction of price movement contradicts the direction of a technical indicator such as MACD, RSI, Stochastic, etc.
When prices form new highs or lows but the indicator fails to confirm the move, a divergence is said to occur.
This situation signals a potential weakness in the current trend and could warn of a reversal or pause. Divergence is useful across most markets, particularly in Forex Market.
Key Rules for Trading with Divergence
Here are 10 essential rules for successful divergence trading:
- Specific price structures must be present;
- Connect consecutive highs or lows;
- Focus on highs or lows—not both simultaneously;
- Match points on the indicator;
- Align comparison points between price and indicator;
- Maintain vertical alignment of price and indicator;
- Difference in slope between price and indicator;
- Avoid entering late after price reaction;
- Use higher timeframes for better accuracy;
- Confirm divergence with additional technical tools.
1. Specific Price Structures Must Be Present
Before analyzing divergence, ensure the price has formed one of the following:
- Higher High
- Lower Low
- Double Top
- Double Bottom
Without these structures, divergence analysis lacks validity. It also tends to be ineffective in range-bound (non-trending) markets.
2. Connect Consecutive Highs or Lows
Once a valid price structure is found, draw a trendline between two major consecutive highs or lows. Minor fluctuations between them should be ignored.
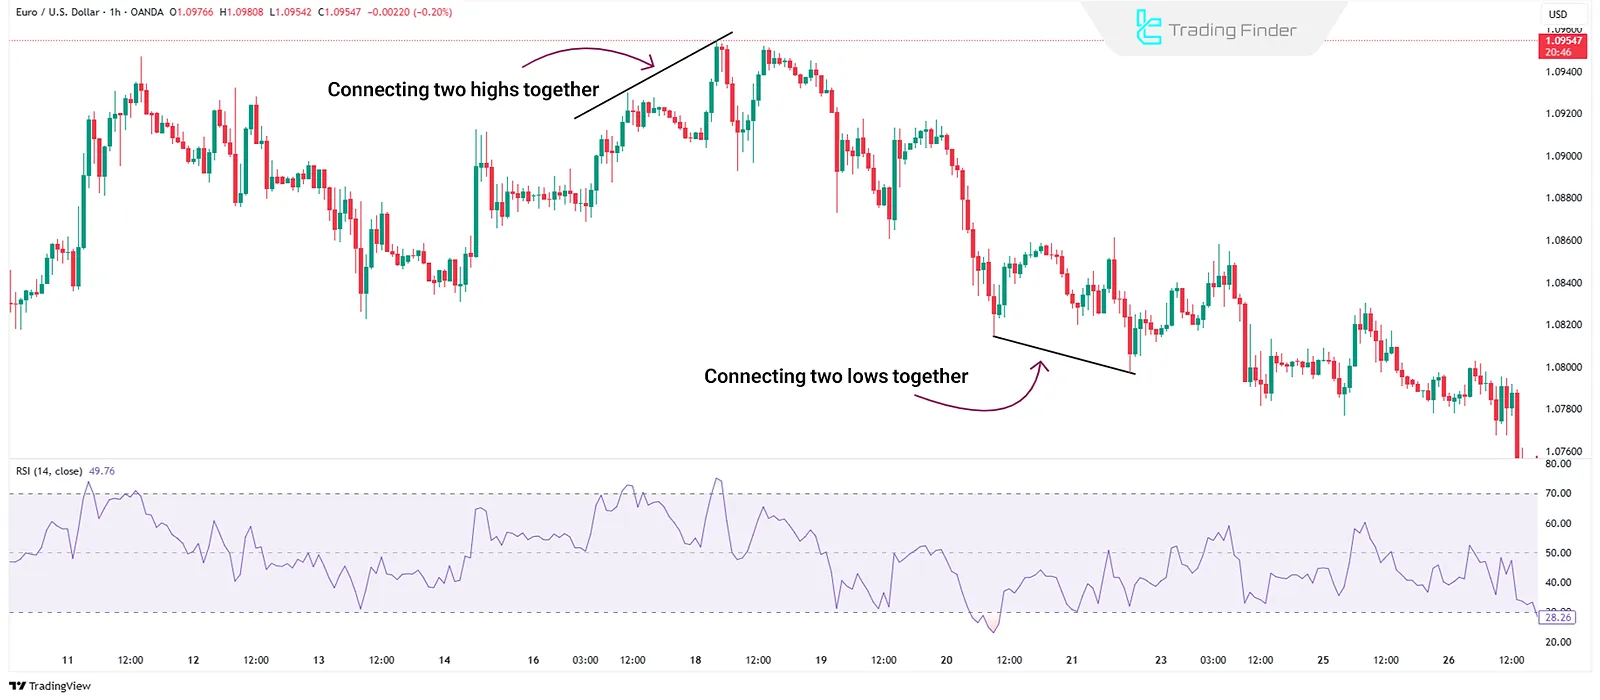
3. Focus on Highs or Lows—Not Both Simultaneously
In divergence analysis, either connect highs only or lows only to compare with the indicator. Mixing the two in one analysis often leads to errors.
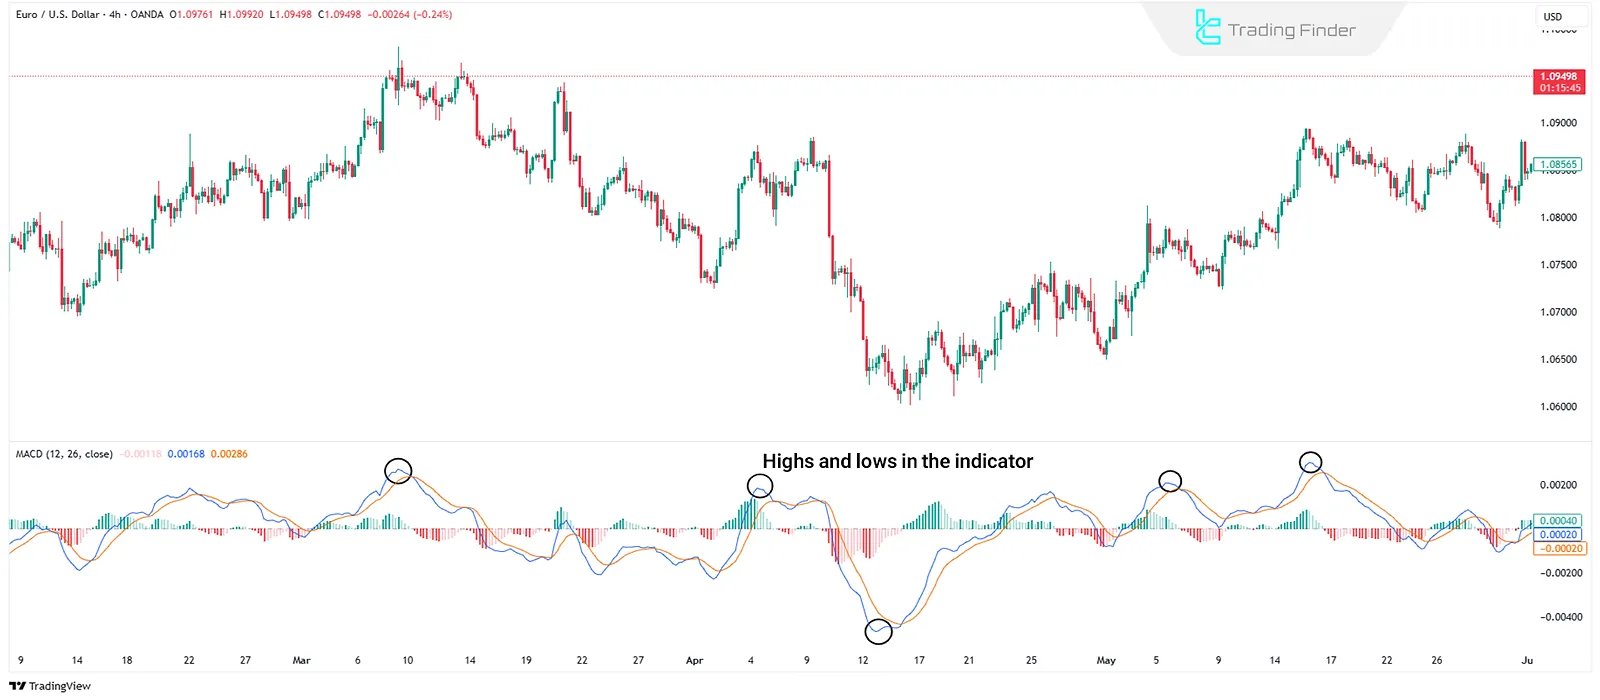
4. Match Points on the Indicator
When comparing price with an indicator, choose the same type of points (highs or lows) on the indicator as in the price. For multi-line indicators like MACD, focus on the Main Line or Signal Line.
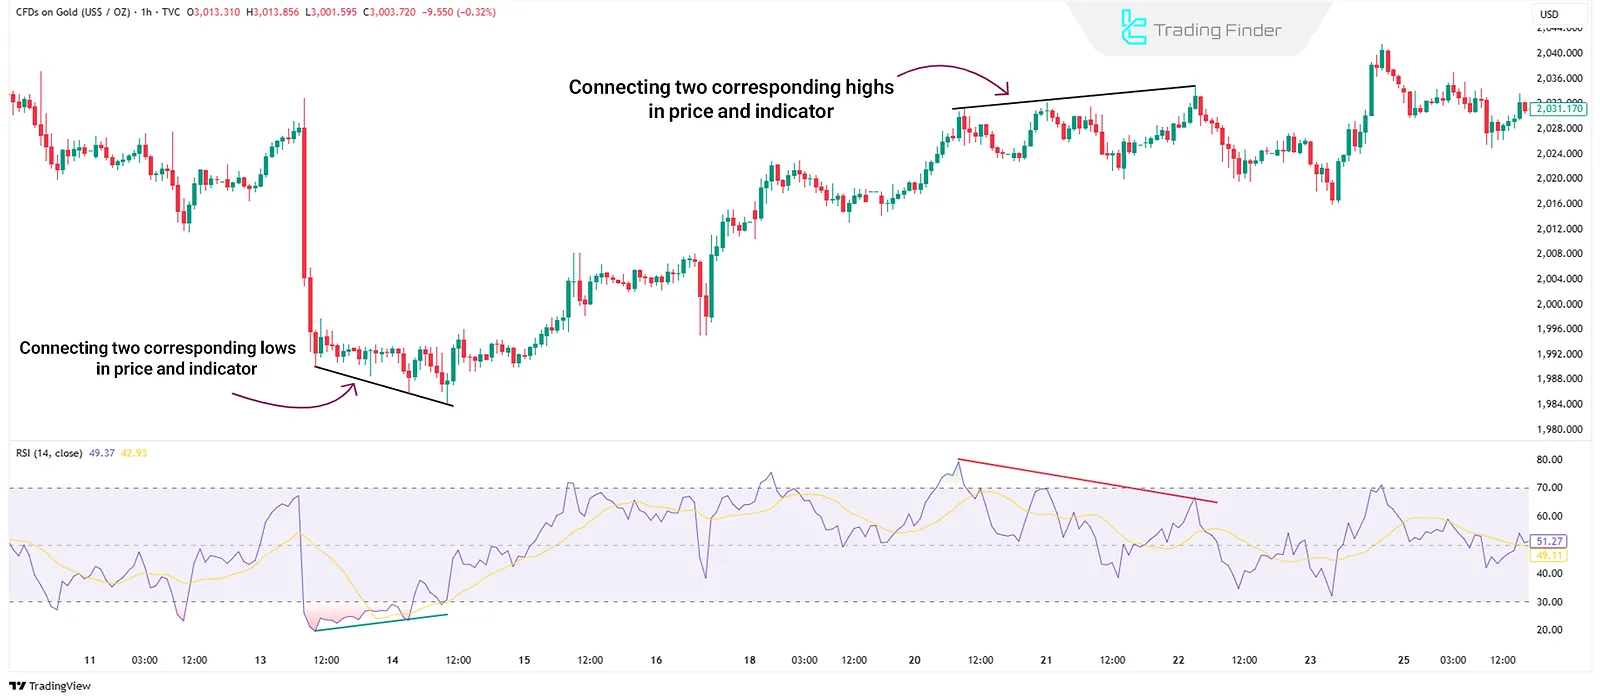
5. Align Comparison Points Between Price and Indicator
If you're connecting two price highs, the corresponding two indicator highs must also be connected. This principle also applies to lows. Mismatched points will lead to incorrect analysis.
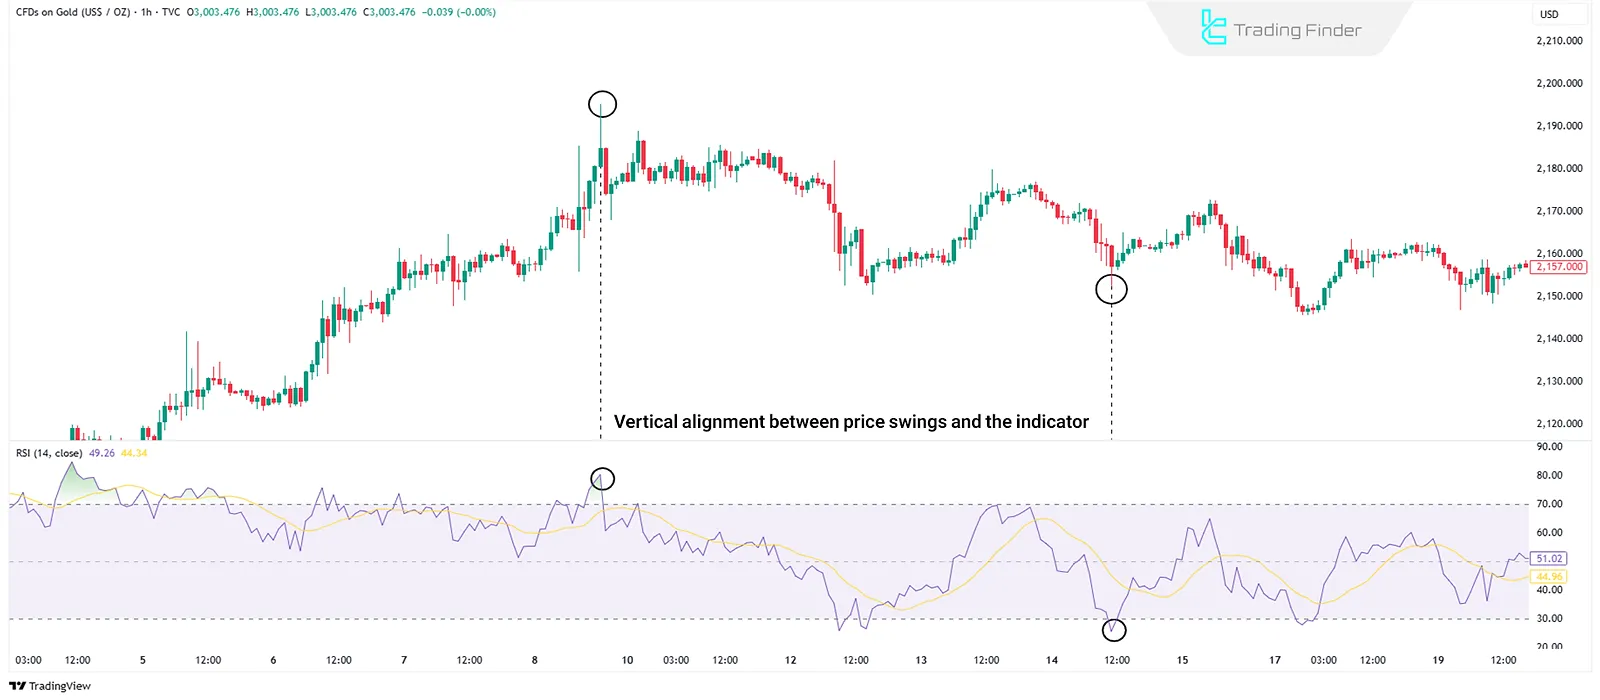
6. Maintain Vertical Alignment of Price and Indicator
The selected points on price and indicator must align in time. That is, a high (or low) on the price chart must correspond to the same timestamp on the indicator. Disregarding this invalidates the divergence signal.
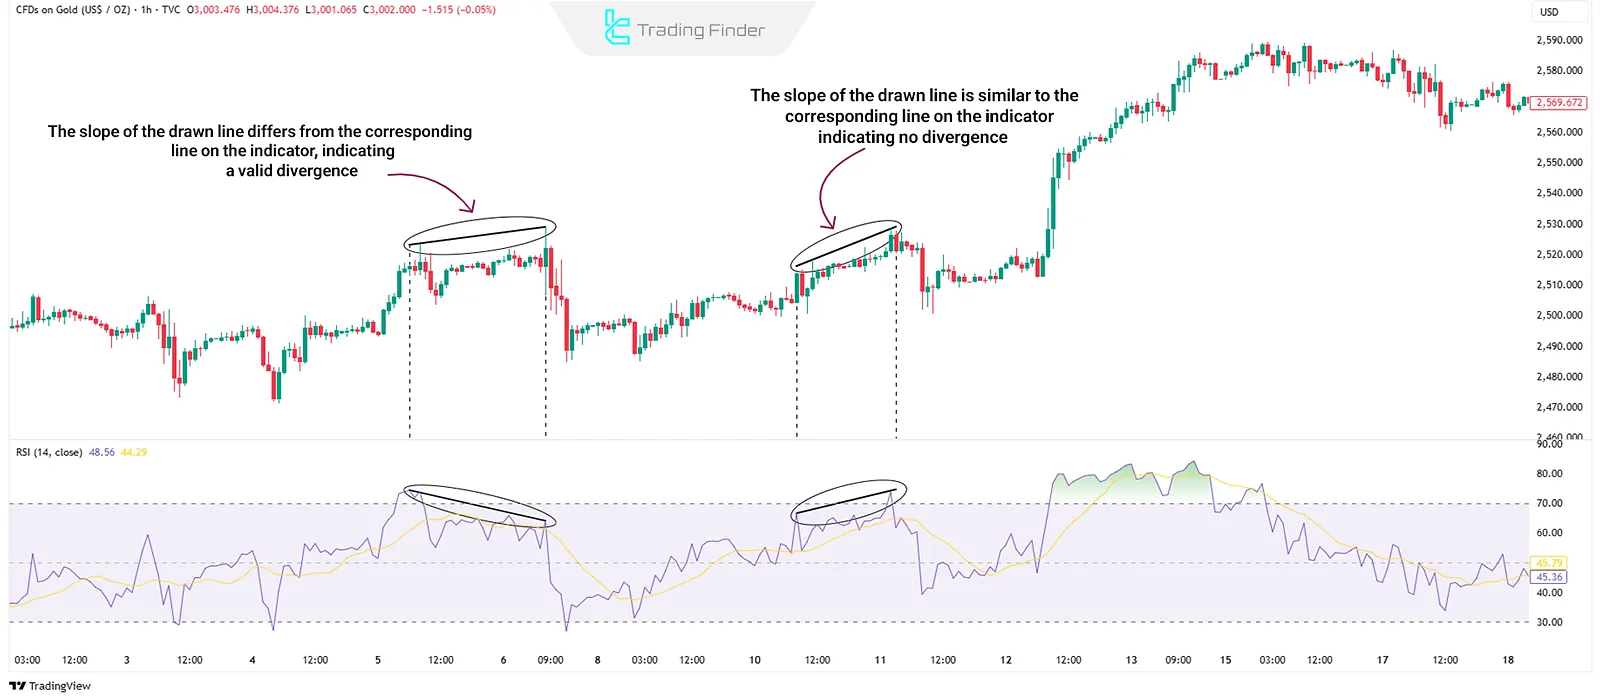
7. Difference in Slope Between Price and Indicator
Divergence is considered valid only when the slope of the trendline on the price chart is different from the slope of the trendline on the indicator. The slope can be upward, downward, or flat. Identical slopes indicate no divergence.
8. Avoid Entering Late After Price Reaction
If divergence is identified after the price has already moved, it's often too late to act. Avoid entering trades once the move has begun—wait for a new setup.
9. Use Higher Timeframes for Better Accuracy
Divergences on higher timeframes (e.g., H1 and above) offer greater accuracy. Although lower timeframes may show more divergences, many of them are false signals.
10. Confirm Divergence with Additional Technical Tools
Divergence should not be used in isolation. For higher accuracy, confirm it using tools like candlestick reversal patterns, support and resistance, volume, or moving averages.
Conclusion
Following the essential rules of divergence trading increases the chances of finding valid signals and identifying optimal entry points. Using supporting tools like volume, support/resistance levels, or candlestick patterns enhances the reliability of divergence setups.


