


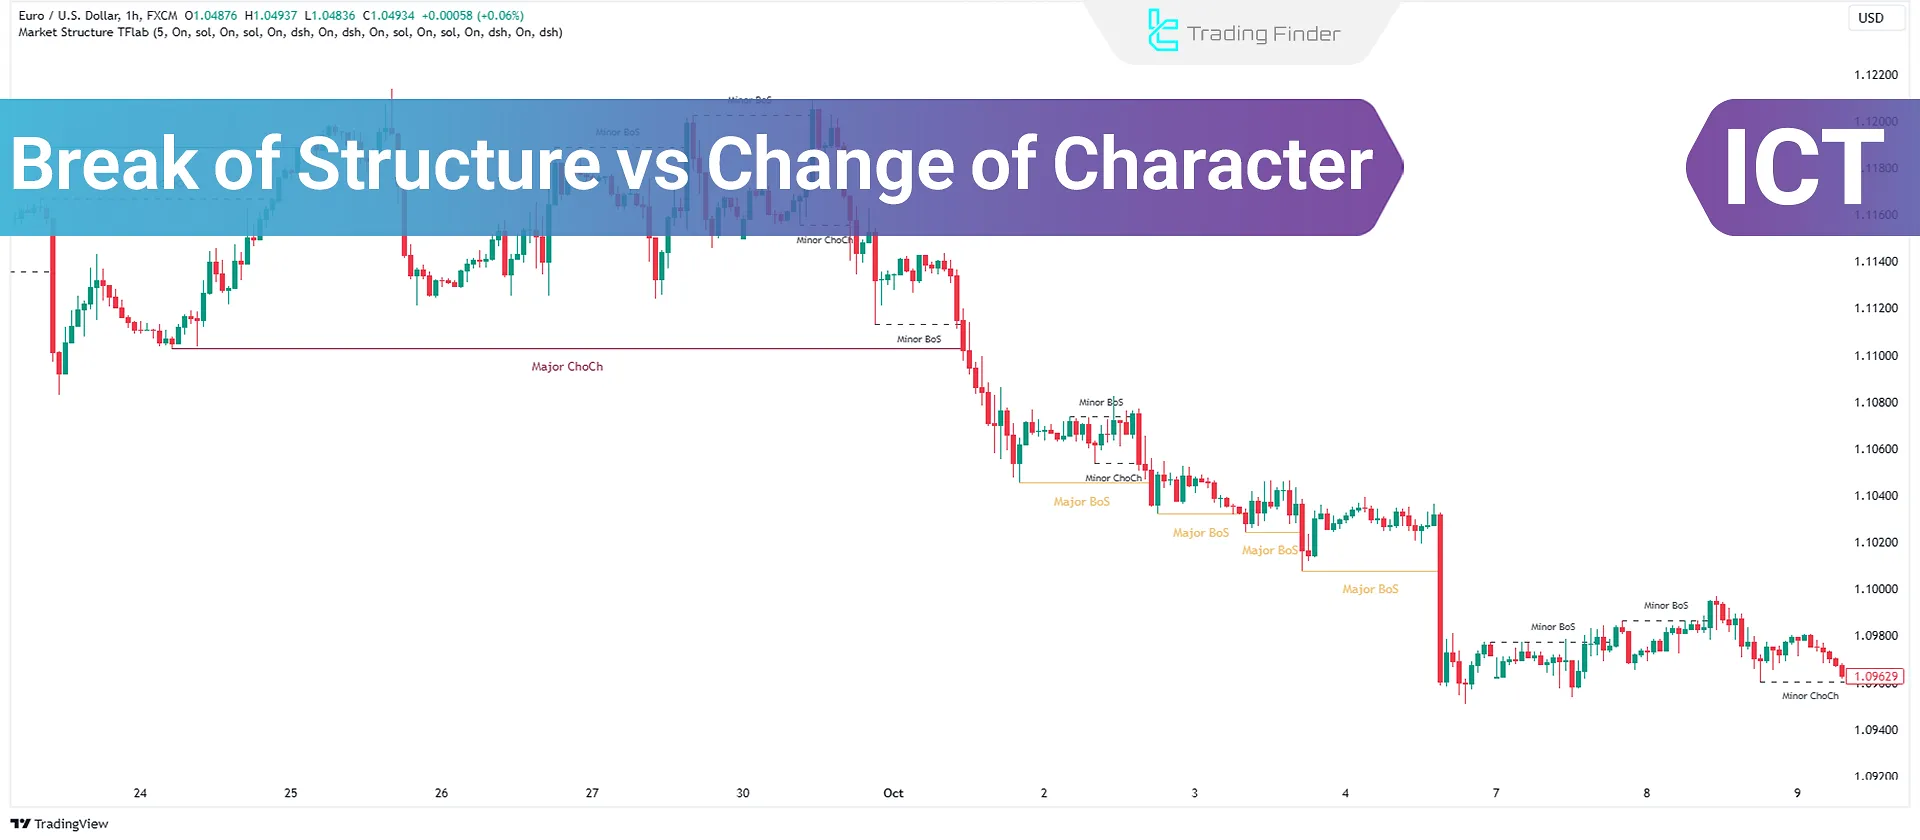
Break of Structure (BOS) refers to breaking the previous high or low to confirm the current trend, while Change of Character (CHOCH) signals a potential trend reversal by breaking the initial structure.
Understanding the comparison of CHOCH vs BOS in ICT style is essential for identifyingtrends and entry or exit points in trading. Using these two concepts simultaneously allows traders to distinguish trend continuation phases from stages of market weakening or reversal.
This distinction, especially in ICT-style market structure analysis, significantly increases decision-making accuracy and risk management.
What is a Break of Structure (BOS)?
The break of Structure indicates the continuation of the market trend. In an uptrend, the trend continues when the price surpasses the previous highand forms a new high.
In a downtrend, the trend also continues when the price falls below the previous lowand forms a new low.
This type of break is only valid when the broken high or low belongs to the main timeframe structure and the candle passes it with a valid close. Otherwise, the move is more likely considered liquidity collection or a corrective fluctuation rather than a true trend continuation.
Advantages and Disadvantages of Market Structure Break (BOS)
A Break of Structure (BOS) has the greatest analytical value when it occurs within the context of an active trend and a healthy market structure; however, relying solely on it can lead to incorrect identification of market trend and structure.
Table of advantages and disadvantages of a market structure break:
Advantages of BOS | Disadvantages of BOS |
Objective confirmation of trend continuation and reduced ambiguity in market direction | Inability to identify early points of trend reversal |
Applicable across all timeframes | Possibility of false breakouts in ranging markets |
Helps filter counter-trend trades | Requires precise identification of structural highs and lows |
High compatibility with multi-timeframe analysis | Heavy dependence on candle closing |
Suitable for trend followers | Relatively later entries compared to CHOCH |
Effective combination with Order Blocks and FVG | Reduced effectiveness in volatile or news-driven conditions |
Improves pullback timing accuracy | Does not provide a standalone entry point without complementary confirmations |
How to identify a valid BOS (Break of Structure Valid)
Correct identification of a BOS requires a precise understanding of market structure, the type of highs and lows, and break confirmation.
Educational guide on using market structure breaks from the XS.com website:
Not every price move beyond a level can be considered a valid BOS; only breaks that meet specific structural conditions are reliable.
Methods for identifying a valid BOS:
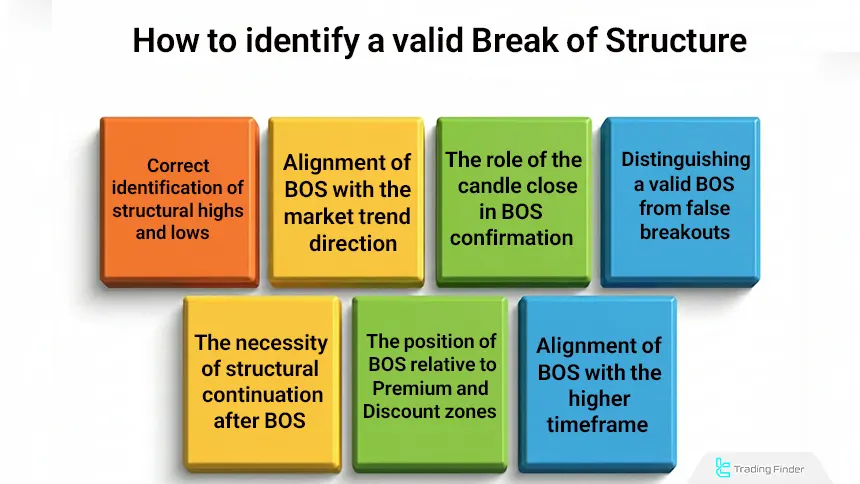
Correct Identification of Structural Highs and Lows (Swing High / Swing Low)
A structure break is valid only when a confirmed structural high or low is broken. Minor fluctuations or internal highs and lows are not BOS criteria.
A structural high or low must be followed by a clear price correction, be stabilized by surrounding candles, and serve as a reference for market structure on the same timeframe. Breaking internal levels without damaging the main structure is not considered trend continuation.
Alignment of BOS with the Market Trend Direction
A market structure break always forms in the direction of the dominant market trend. In an uptrend, breaking the last Higher High indicates continued buyer strength, and in a downtrend, breaking a Lower Low represents sustained selling pressure.
If a structure break occurs against the trend direction, it is more appropriately analyzed as a Change of Character or liquidity collection and is not considered a valid BOS.
The Role of the Candle Close in BOS Confirmation
A momentary price penetration above a previous high or below a previous low has no structural value. A BOS is confirmed only when the candle fully closes above the previous high or below the previous low.
The absence of a valid close indicates that the market has not yet accepted the previous structure, and the move may merely be liquidity manipulation.
The Necessity of Structural Continuation after BOS
After a valid BOS occurs, the market must show a logical reaction. This reaction usually appears as a price correction followed by the formation of a new structure in the same direction, such as a Higher Low in an uptrend or a Lower High in a downtrend.
A rapid return of price back into the previous structure is a sign of a weak break and invalid BOS.
The Position of BOS Relative to Premium and Discount Zones
High quality market structure breaks typically occur in logical value zones. In an uptrend, a BOS has greater validity when it forms from the Discount zone, and in a downtrend, a BOS occurring in the Premium zone is more reliable.
Breaks that occur in extreme price zones usually carry a higher risk of failure.
Distinguishing a valid BOS from False Breakouts
Many breaks are merely superficial and do not truly change market structure. The absence of a candle close, breaking internal highs or lows, coincidence with news-driven volatility, and the market’s inability to form a new structure are all signs of an invalid BOS.
A valid BOS is always part of an active and continuous trend, not an isolated move.
Alignment of BOS with the Higher Timeframe (HTF)
To increase analytical accuracy, BOS on lower timeframes must align with the trend direction of the higher timeframe.
Breaks that occur against the HTF structure often function as liquidity collection or temporary corrections and rarely lead to trend continuation. Multi-timeframe alignment significantly increases the probability of a successful BOS.
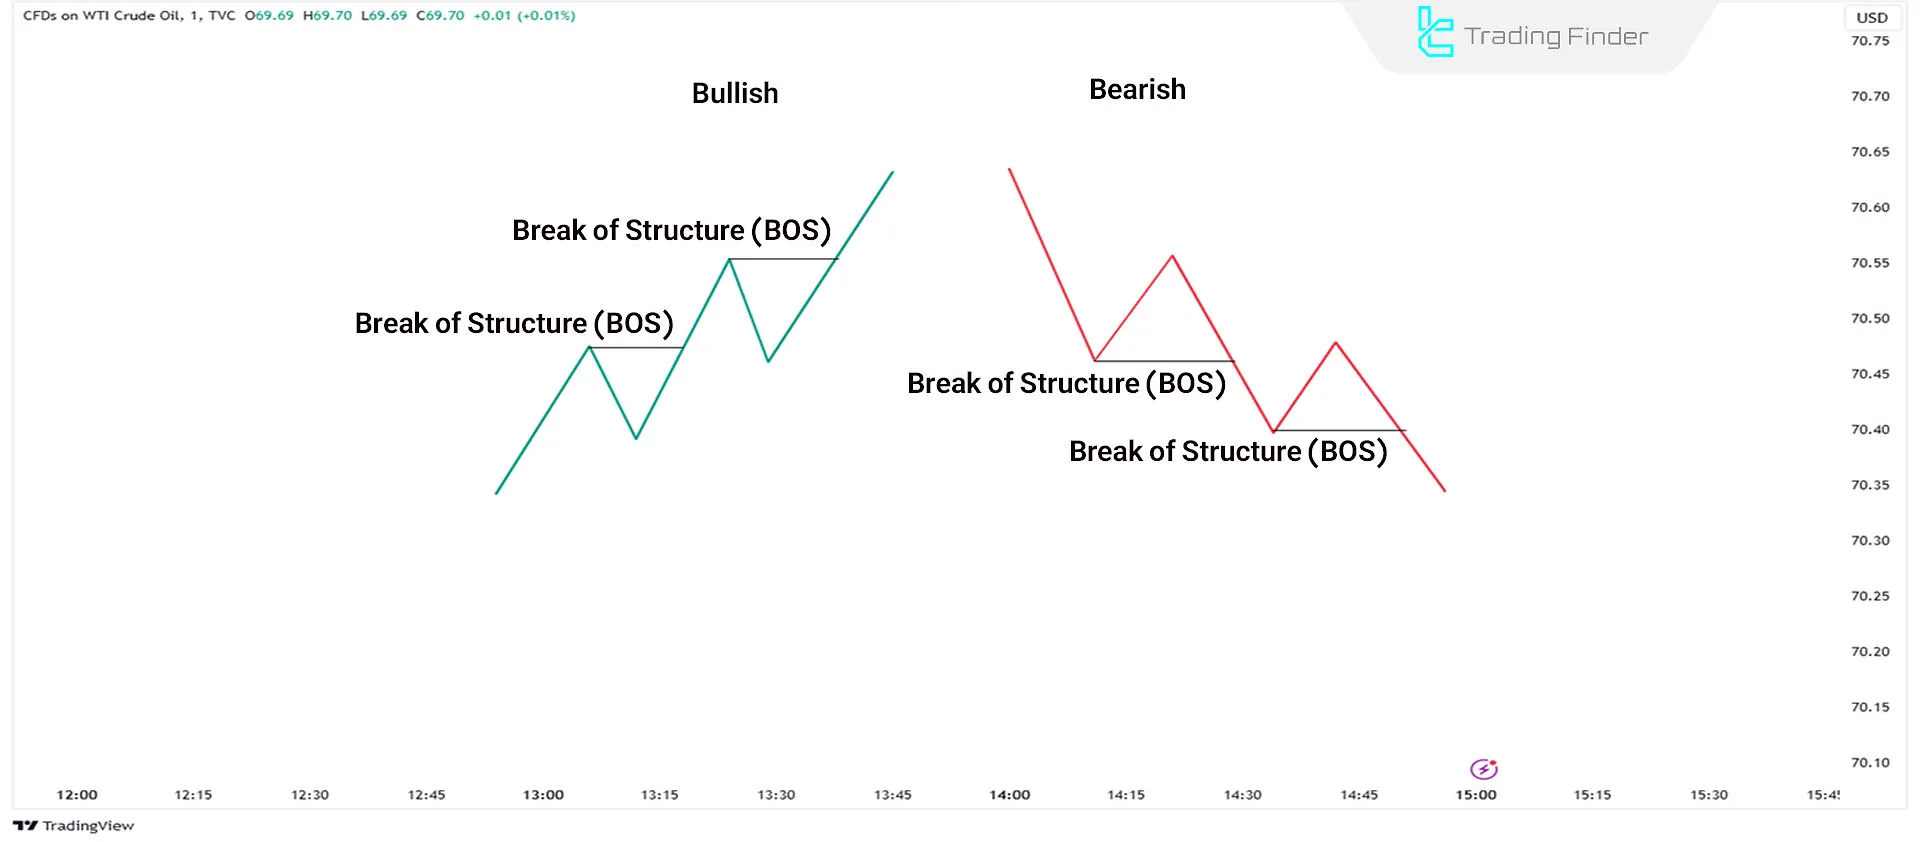
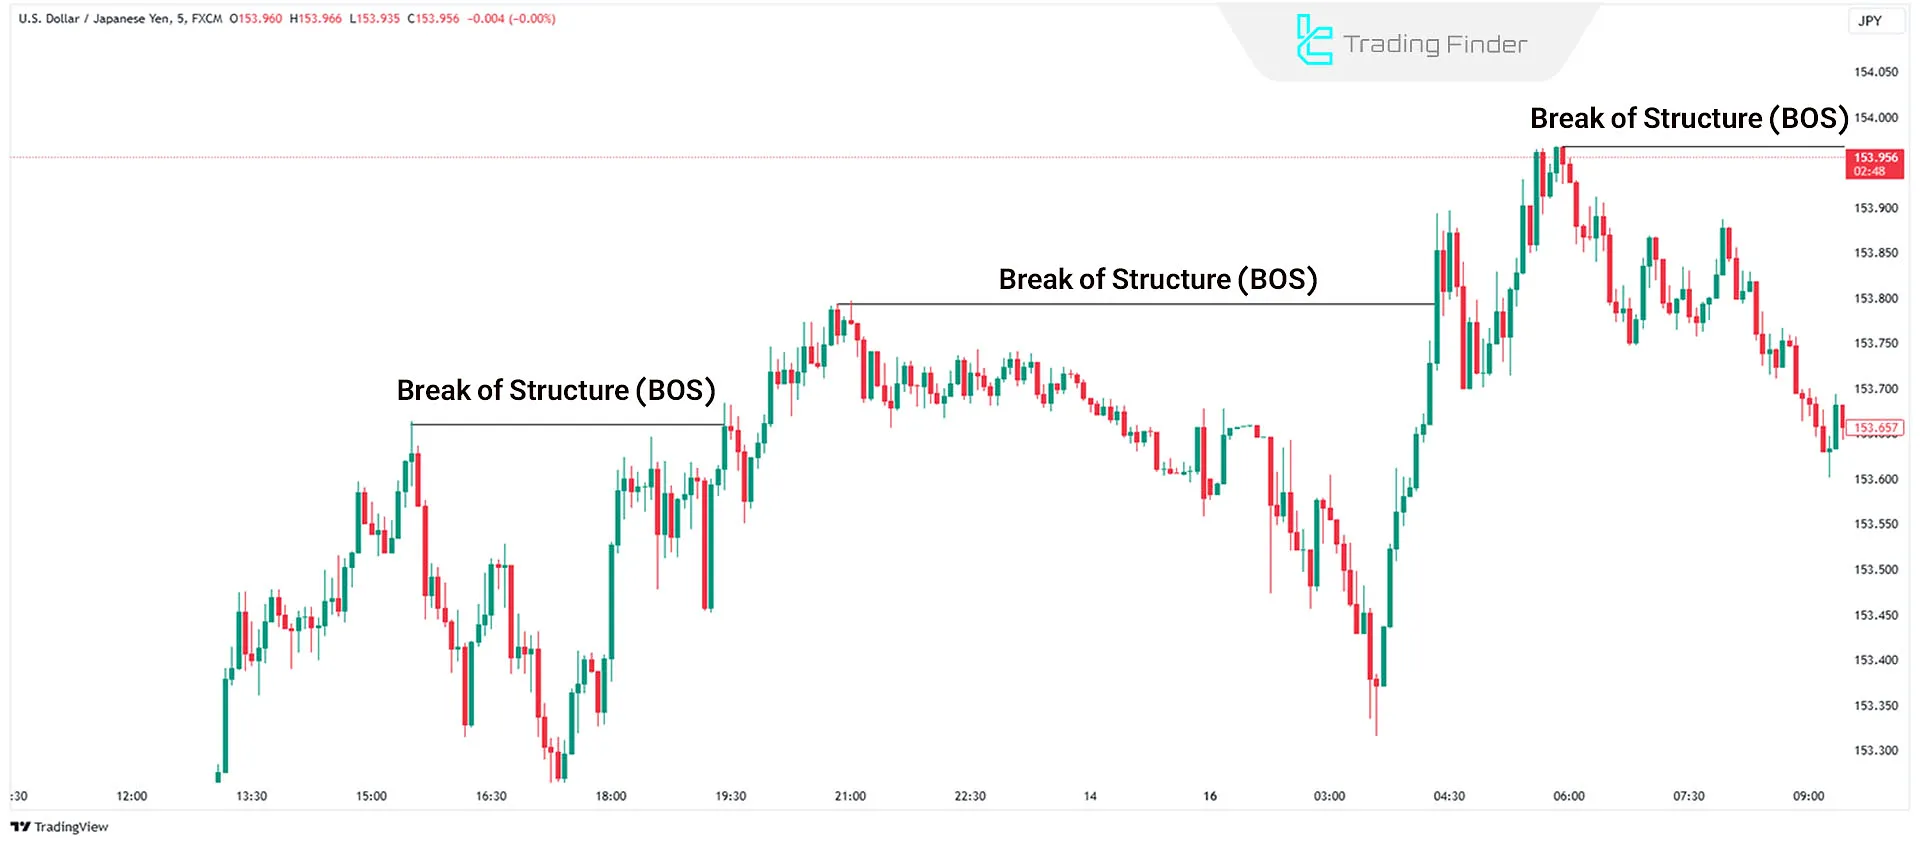
Example of Bullish Break of Structure
In an uptrend, new highs are formed above the previous highs. This movement represents a bullish BOS, where the price breaks the previous high and creates a higher high.
This type of break is considered valid when it is accompanied by clear displacement and a candle close above the previous high. In the absence of these conditions, the move is merely considered a false breakout, and the bullish structure is not confirmed.
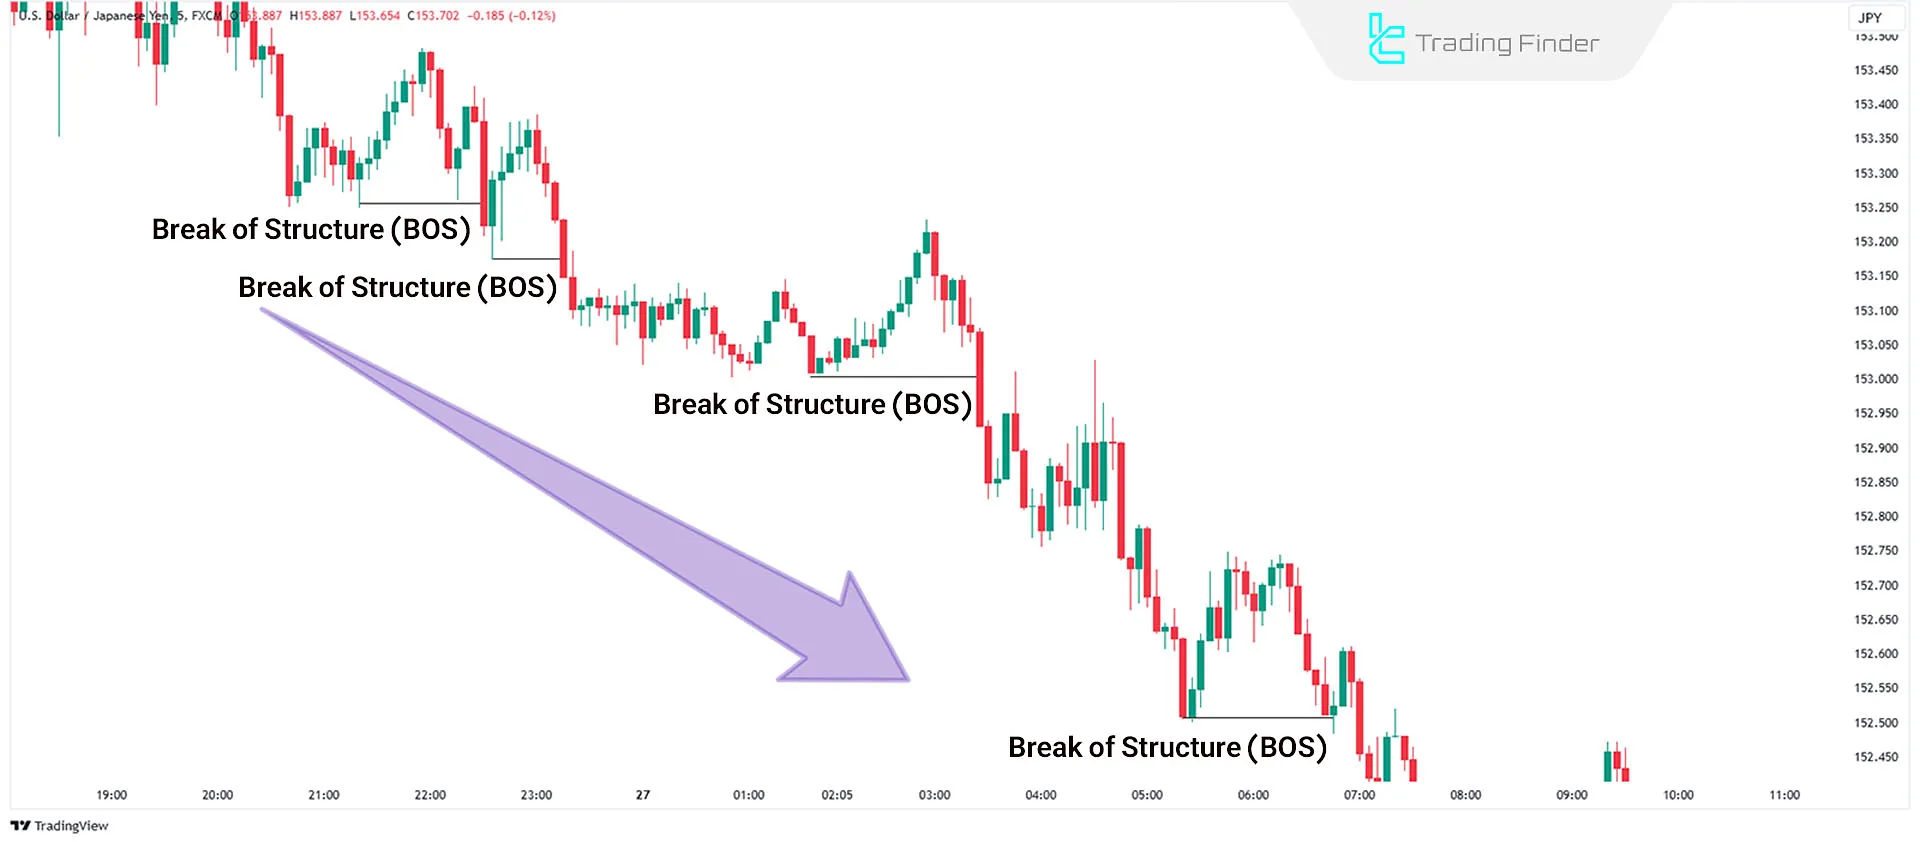
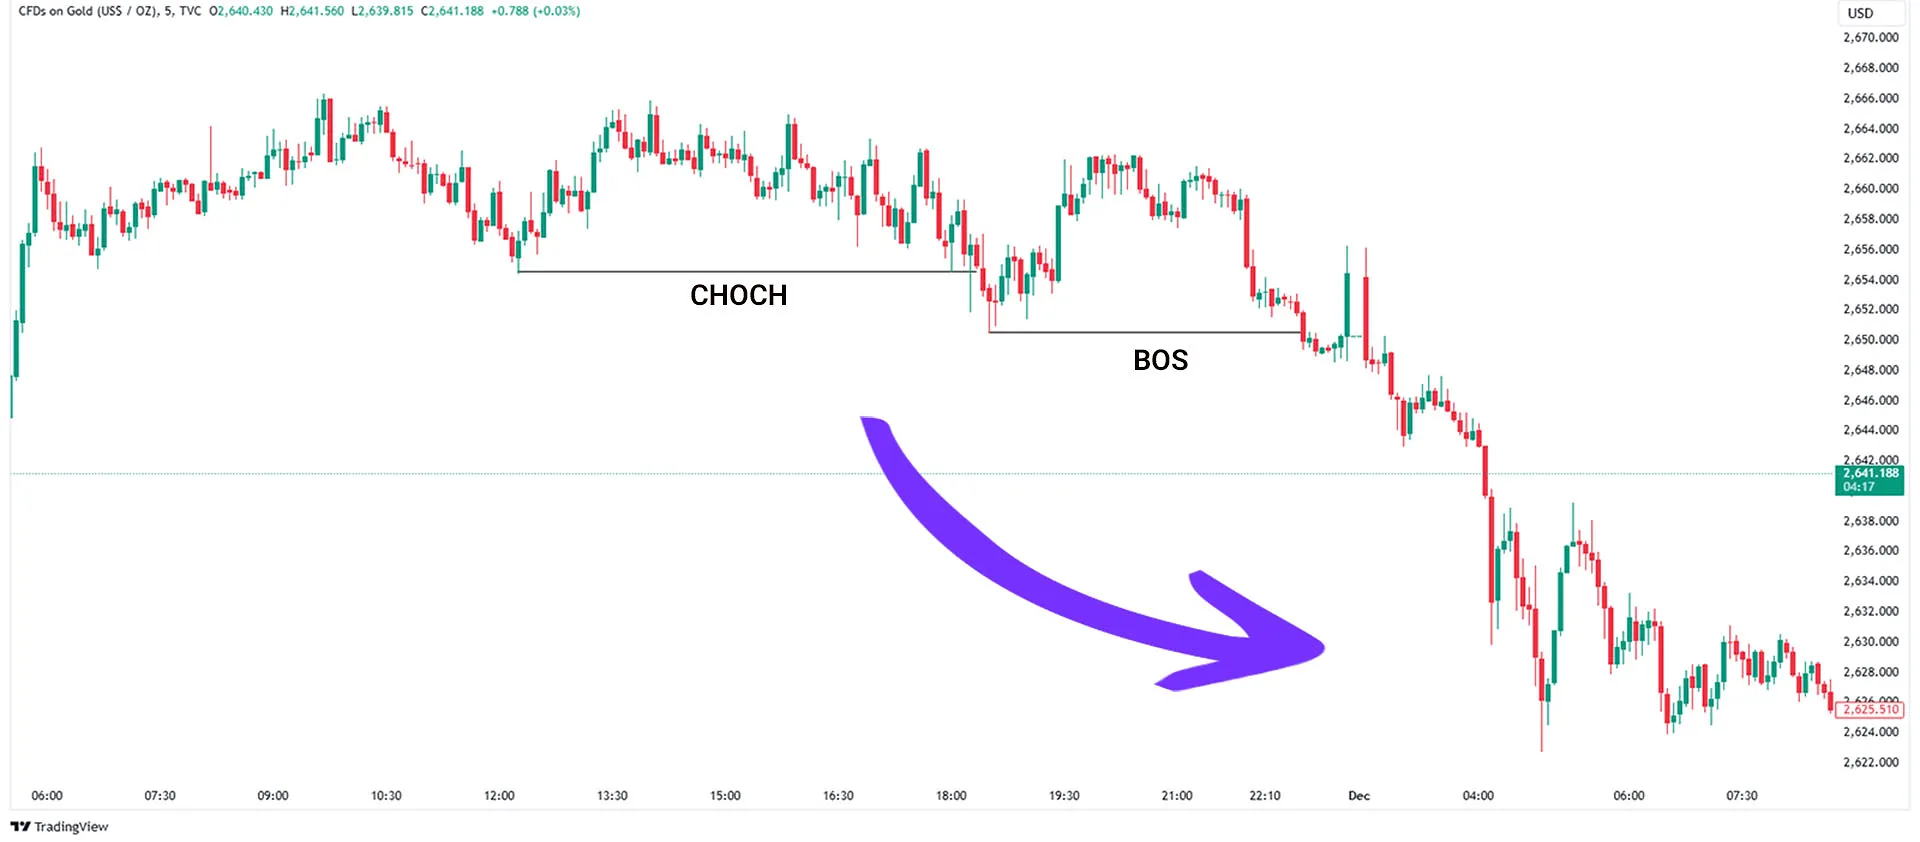
Bearish Break of Structure
In a downtrend, new lows are formed below the previous lows. This movement represents a bearish BOS, where the price breaks the previous low and creates a lower low.
The validity of this break increases when the move is accompanied by price momentum and a candle close below the previous low. Otherwise, there is a possibility of a false breakout forming and the price returning to the previous structure.
What is Change of Character (CHOCH)?
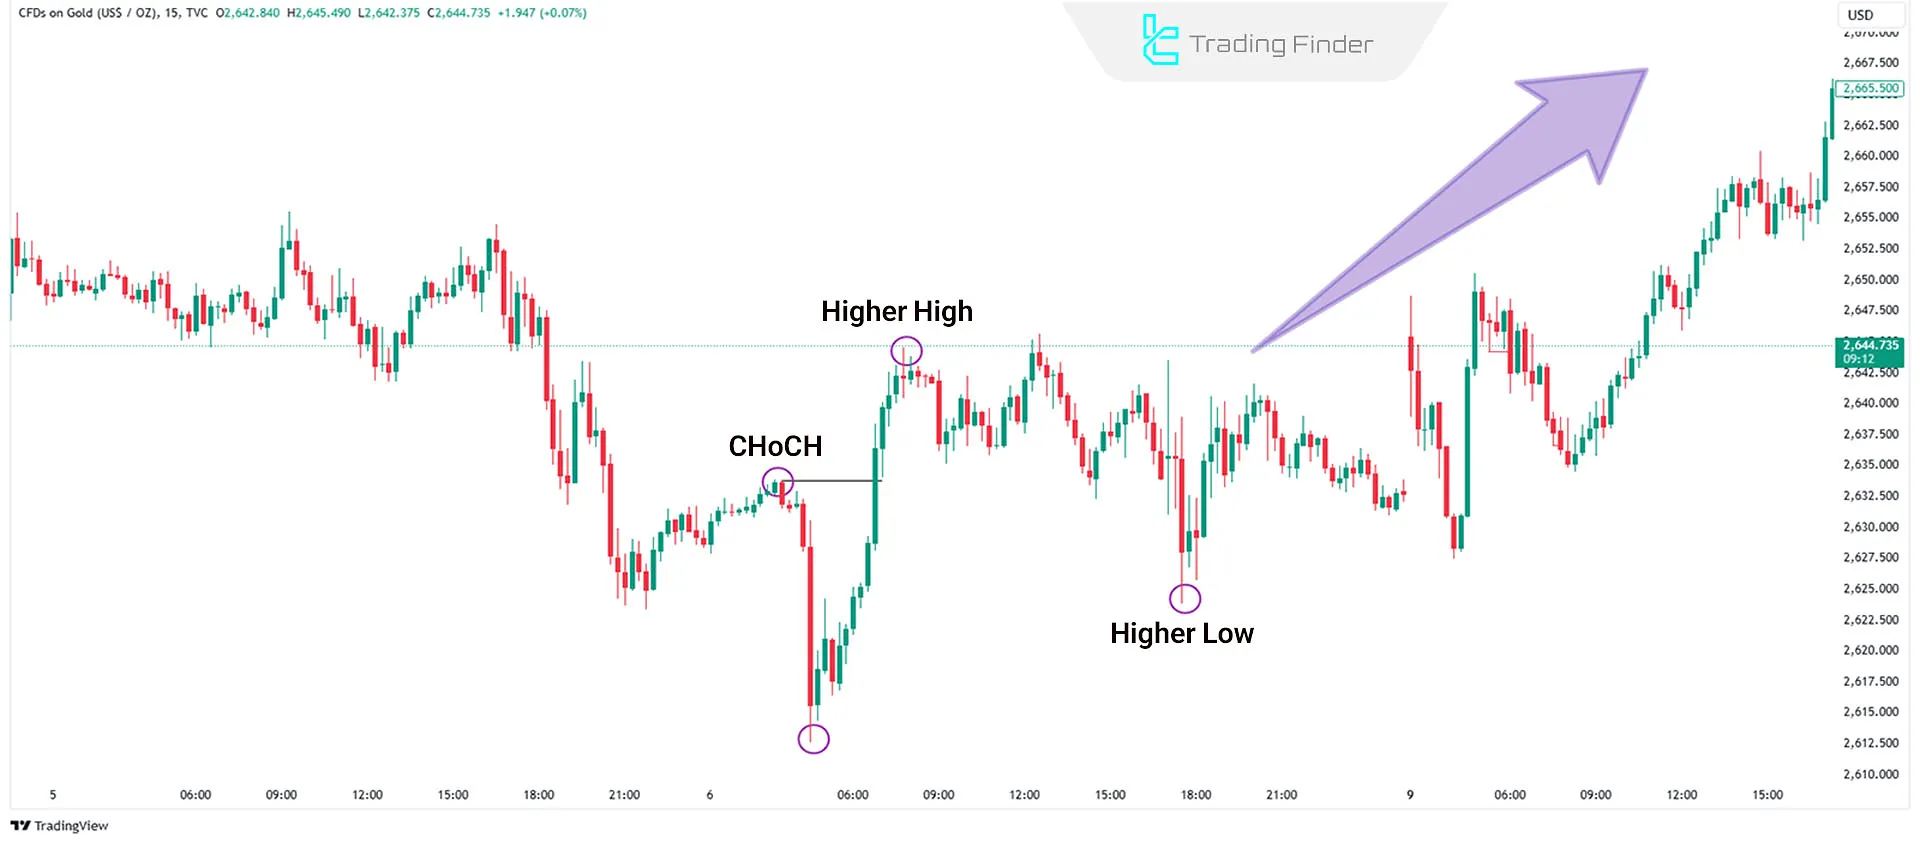
Change of Character indicates a change in the market trend. If a lower low is formed in an uptrend, the trend turns bearish, resulting in a bearish CHOCH.
Conversely, if a higher high is formed in a downtrend, the trend turns bullish, resulting in a bullish CHOCH. In essence, CHOCH occurs when the price structure breaks in the opposite direction of the previous trend, signaling a market reversal.
Advantages and Disadvantages of Change of Character (CHoCH)
Change of Character (CHOCH) is one of the earliest signs of disruption in trend structure and a shift in market control between buyers and sellers; however, misinterpreting it can lead to premature conclusions.
CHOCH helps distinguish between real changes in market behavior and corrective or liquidity-driven moves. Table of advantages and disadvantages of CHOCH:
Advantages of CHOCH | Disadvantages of CHOCH |
Early identification of weakening in the dominant market trend | High probability of false signals without additional confirmations |
Early warning of a market phase shift from trending to corrective or reversal | Does not provide a standalone and direct entry point |
Suitable for identifying important structural highs and lows | High sensitivity to volatility and liquidity grabs |
Useful for reversal traders and swing traders | Requires precise identification of the reference structure |
Effective combination with Liquidity Sweep and Premium/Discount | Lower standalone reliability on lower timeframes |
Improves accuracy in filtering counter-trend trades in late stages | Requires patience for a confirming BOS after CHOCH |
Helps risk management through earlier exit from a weakening trend | Can be mistaken for temporary market corrections |
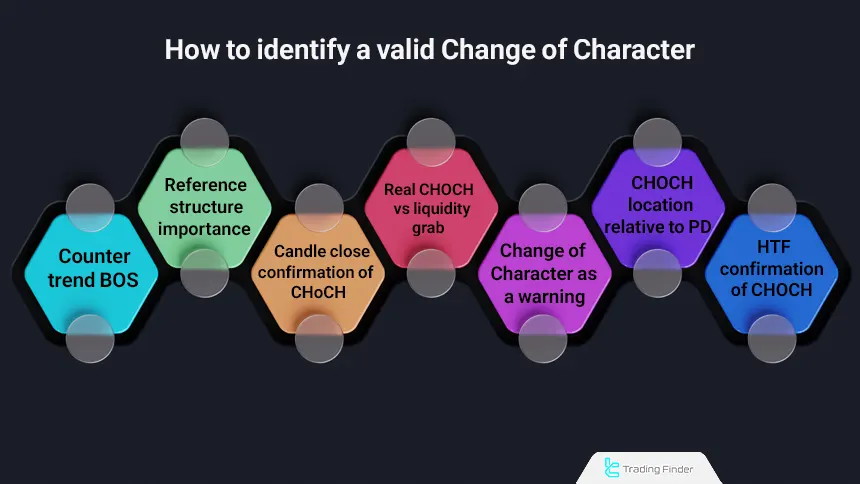
How to correctly identify CHOCH
Correct identification of CHOCH requires a precise understanding of market structure and differentiation from false breaks.
Not every break of a high or low implies a trend change, and without clear criteria, analysis can be misleading. Below are the most important technical principles for identifying a real and reliable CHOCH. Methods for identifying Change of Character:
Break of Structure Against the Active Trend Direction
A Change of Character forms when price structure breaks against the direction of the dominant market trend. In an uptrend, breaking the last Higher Low, and in a downtrend, price moving above the last Lower High, is the first sign of a change in market behavior.
This break indicates that market control is gradually shifting away from the dominant participants and that the balance of supply and demand is changing.
The Importance of Selecting the Reference Structure in CHOCH
To identify a valid CHOCH, the structure being broken must be the main structure of the analyzed timeframe. Breaking internal or corrective structures does not constitute a Change of Character.
The reference structure must have displayed several valid price legs prior to the break and clearly represented the previous trend. Without these characteristics, the break is merely considered short-term fluctuation.
The Role of the Candle Close in Confirming Change of Character
Change of Character is confirmed only by a candle close outside the previous structure. Wick-like penetration below the reference low or above the reference high does not create a CHOCH.
The candle close represents price acceptance in the new area, and without it, the market has not yet rejected the prior trend.
In structural analysis, a valid close is the basis for decision-making, and any reaction before it is considered only intra-structural volatility.
The Difference Between a Real CHOCH and Liquidity Collection
Many movements that appear to be CHOCH are actually liquidity grabs. In these cases, price breaks the structure to hunt stops but immediately returns to its previous path.
A real Change of Character is usually accompanied by reduced momentum in the prior trend, a change in candle behavior, and the market’s inability to continue the previous structure.
Change of Character as an Rarly Warning
CHOCH primarily serves as an early warning of a trend change rather than a direct entry point. This pattern signals that the previous trend has weakened, but entering trades without further confirmations carries high risk.
Combining CHOCH with a new BOS, a price correction, or the formation of a new structure increases decision-making accuracy.
In practice, CHOCH marks the beginning of a market phase transition, not precise entry timing, and must be interpreted within the context of a larger structure.
The Position of CHOCH relative to Premium and Discount
High-quality Change of Character patterns usually form in extreme market zones.
At Premium highs, the probability of a bearish trend change increases, and at Discount lows, a bullish CHOCH becomes more meaningful. CHOCH occurrences in mid-range market areas have lower validity and often lead to failure.
Alignment of these zones with liquidity, higher-timeframe extremes, and price rejection significantly increases the quality of CHOCH.
Confirming CHOCH with the Higher Timeframe
For greater confidence, CHOCH on lower timeframes should coincide with weakness or a pause in the trend on the higher timeframe.
If the higher timeframe still maintains a healthy structure, a lower-timeframe CHOCH more often acts as a correction or pullback. Multi timeframe convergence strengthens the probability of a real trend change.
In such cases, analytical priority belongs to the higher-timeframe structure, and the lower-timeframe CHOCH is considered only as a secondary confirmation.
Bullish CHOCH
Bullish CHOCH signifies a trend reversal from bearish to bullish. The price consistently decreases in a downtrend, but with this change, it forms a higher high instead of a lower one. This marks the end of the downtrend and the beginning of an uptrend.
This signal has higher validity when it is accompanied by a valid candle close, liquidity sweep of the lows, and confirmation from the higher-timeframe structure.
Bearish CHOCH
Bearish CHOCH signifies a trend reversal from bullish to bearish. The price consistently increases in an uptrend, but this change forms a lower high instead of a higher high.
This marks the end of the uptrend and the beginning of a downtrend.
Differences Between BOS sv CHOCH
Break of Structure and Change of Character are both defined based on the break of key price levels, but they play different roles in interpreting market behavior.
Educational video on the differences between BOS and CHOCH from the Hola Prime YouTube channel:
A market structure break indicates the continuation of the strength of the current trend, while a Change of Character indicates disruption in the existing structure and the possibility of a market reversal.
Aspect | Break of Structure (BOS) | Change of Character (CHOCH) |
Definition | A pattern for trend continuation | A pattern for trend reversal |
Occurrence | Can occur in both uptrends and downtrends | Occurs only at the end of a trend |
Significance | Identifies the current trend and its strength | Identifies the reversal and trend change |
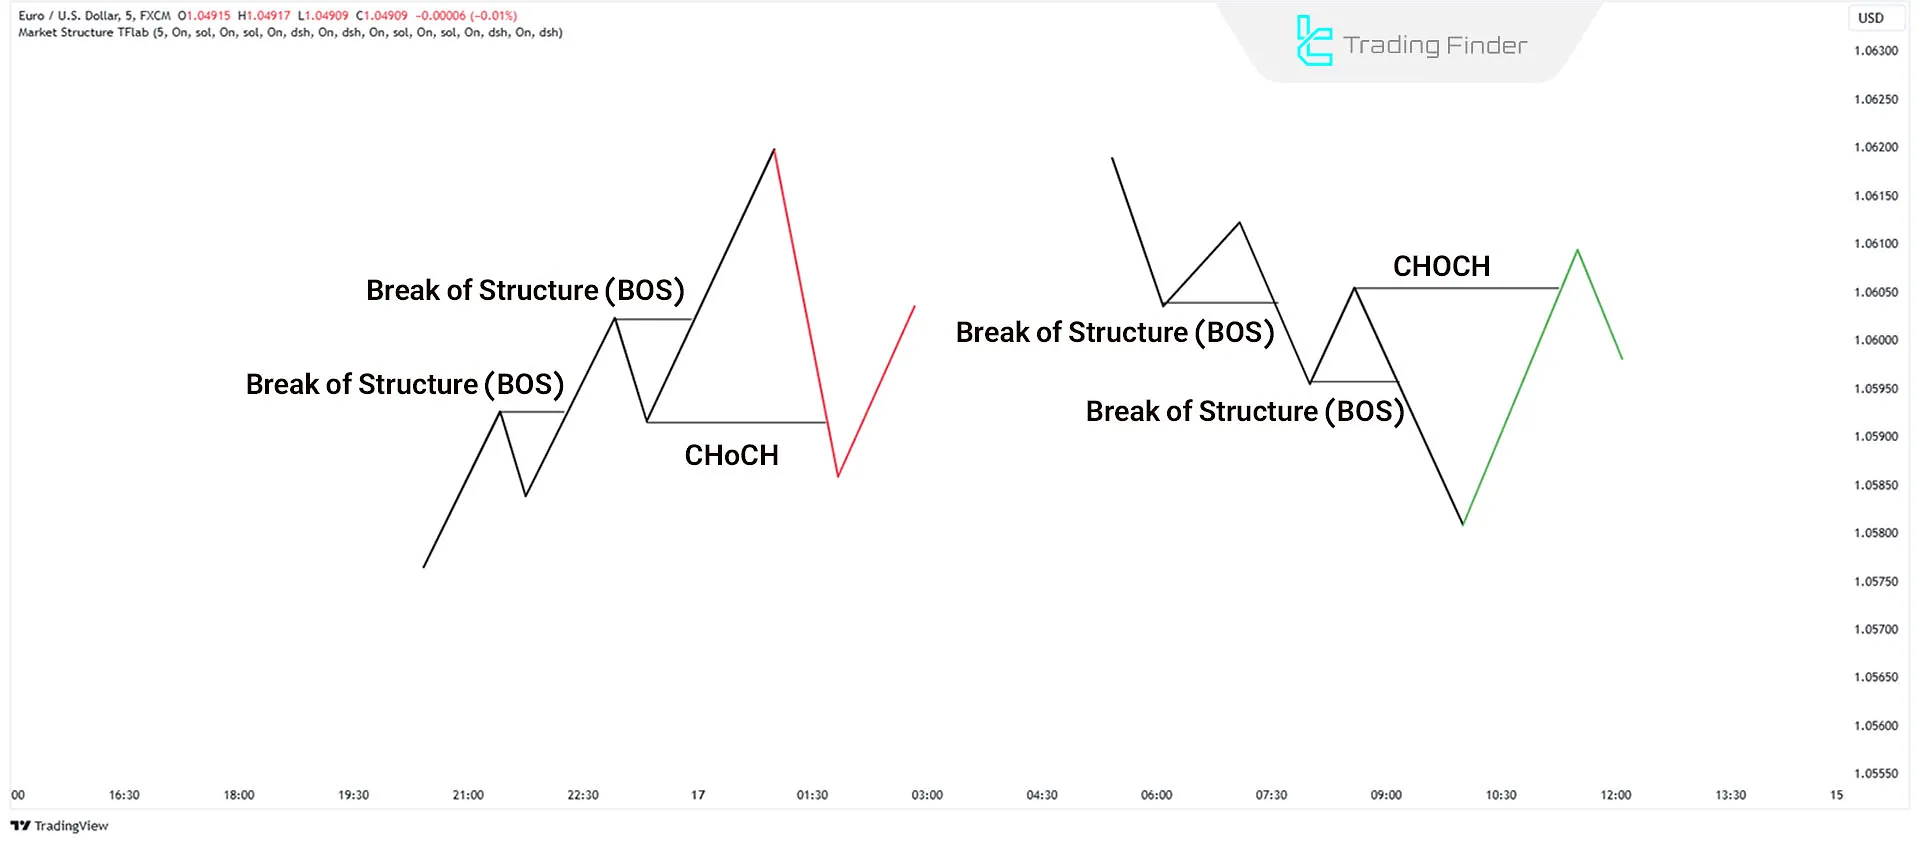
Where Do BOS vs CHOCH Occur on the Chart?
BOS occurs in both uptrends and downtrends when the previous trend continues. In contrast, CHOCH occurs when a trend changes from bullish to bearish or vice versa.
In other words, BOS confirms trend continuation, while CHOCH is considered a warning of the end of the current phase and the beginning of a new market phase.
Which is More Reliable: BOS or CHOCH?
While both CHOCH vs BOS involve structure breaks, their directions differ. As a result, both patterns have equal reliability. However, BOS indicates the continuation of the current trend, while CHOCH reflects a price reversal, often resulting in larger moves (more pips).
BOS and CHoCH Indicator
The IDM CHoCH BOS line identification indicator is one of the advanced technical analysis tools developed based on ICT (Inner Circle Trader) and Smart Money concepts.
By focusing on market structure and price behavior, this indicator helps traders more accurately identify key points of trend change, trend continuation, and liquidity absorption zones.
The core functionality of this tool is built on three main concepts. First is Change of Character (CHoCH), which indicates a market phase shift and the transfer of control between buyers and sellers.
The indicator identifies these points by detecting important swing points and displays them on the chart with specific lines.
Educational videos on using BOS and CHoCH:
Second is Break of Structure (BOS), which forms after CHoCH or during an active trend and serves as confirmation of continuation or stabilization of the new market direction.
Third is Inducement (IDM), which highlights liquidity absorption zones and false breakouts, helping traders avoid entering price traps. By using clear color coding, this indicator provides high readability in market structure analysis.
CHoCH lines usually appear as early warnings of trend change, while BOS plays a confirmatory role for price continuation. IDM zones also make price behavior in relation to market liquidity more transparent.
In bullish trends, after the occurrence of CHoCH followed by BOS, the indicator enables proper analysis of price corrections and price returns to inducement zones. In bearish trends, the same logic is applied to identify trend changes and continuation of price declines.
This tool is suitable for multi-timeframe analysis and can be used in markets such as forex and cryptocurrency.
Overall, the IDM-CHoCH-BOS indicator is considered a professional tool for advanced traders who seek a deeper understanding of market structure, better timing of entries and exits, and a reduction in errors caused by false breakouts.
Download links for the CHoCH and BOS indicator:
Conclusion
The BOS vs CHOCH styles are important methods for analyzing market behavior and identifying trends in ICT. BOS confirms trend continuation, while CHOCH signals trend reversal. Candlestick closure is essential in both patterns to confirm the break or reversal, adding precision to technical analysis.
Combining these concepts with liquidity, Premium and Discount zones, and higher-timeframe structure significantly increases the validity of the analysis. Without this structural confluence, BOS and CHOCH may merely represent short-term, low-reliability market reactions.


