


The Can Can pattern in the RTM methodology reflects a smart price behavior designed to trap breakout traders. It is not a fixed shape but rather a repeating behavior seen at liquidity absorption and market reversal points.
In this pattern, the price performs a false breakout of a key level, triggers entries from inexperienced traders, and then strongly reverses in the true direction.
What is the Can Can Pattern in RTM?
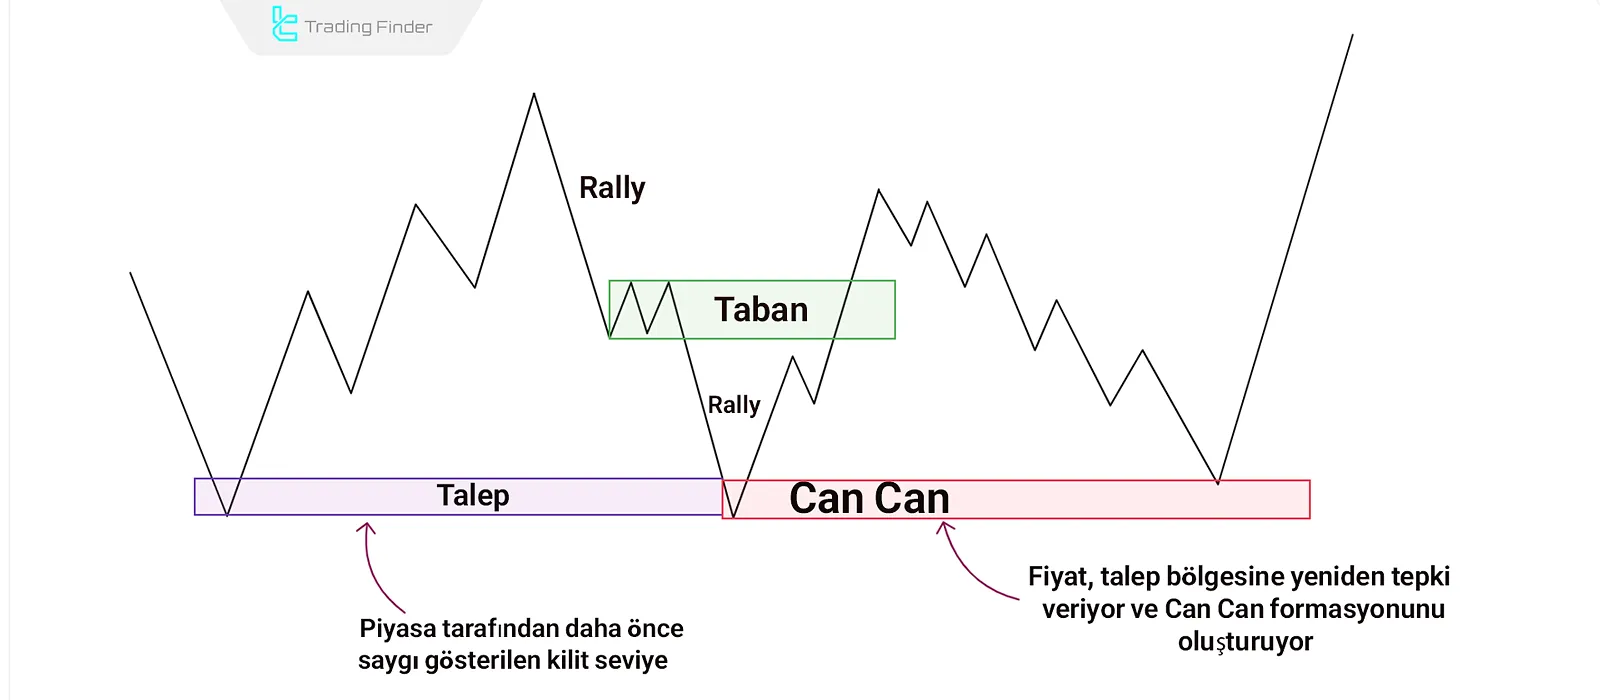
The Can Can pattern in Technical analysis, is a reversal structure that typically forms after a break of a strong RBR or DBD zone—levels that are structurally powerful and expected to cause reactions.
After breaking such a zone, the price enters a compression phase, forming multiple weak levels in succession. Upon reaching the broken zone (Caps) again, the lack of liquidity causes a sharp reversal accompanied by an internal structure break.
This reversal originates from the Can Can zone, which reveals the real market direction.
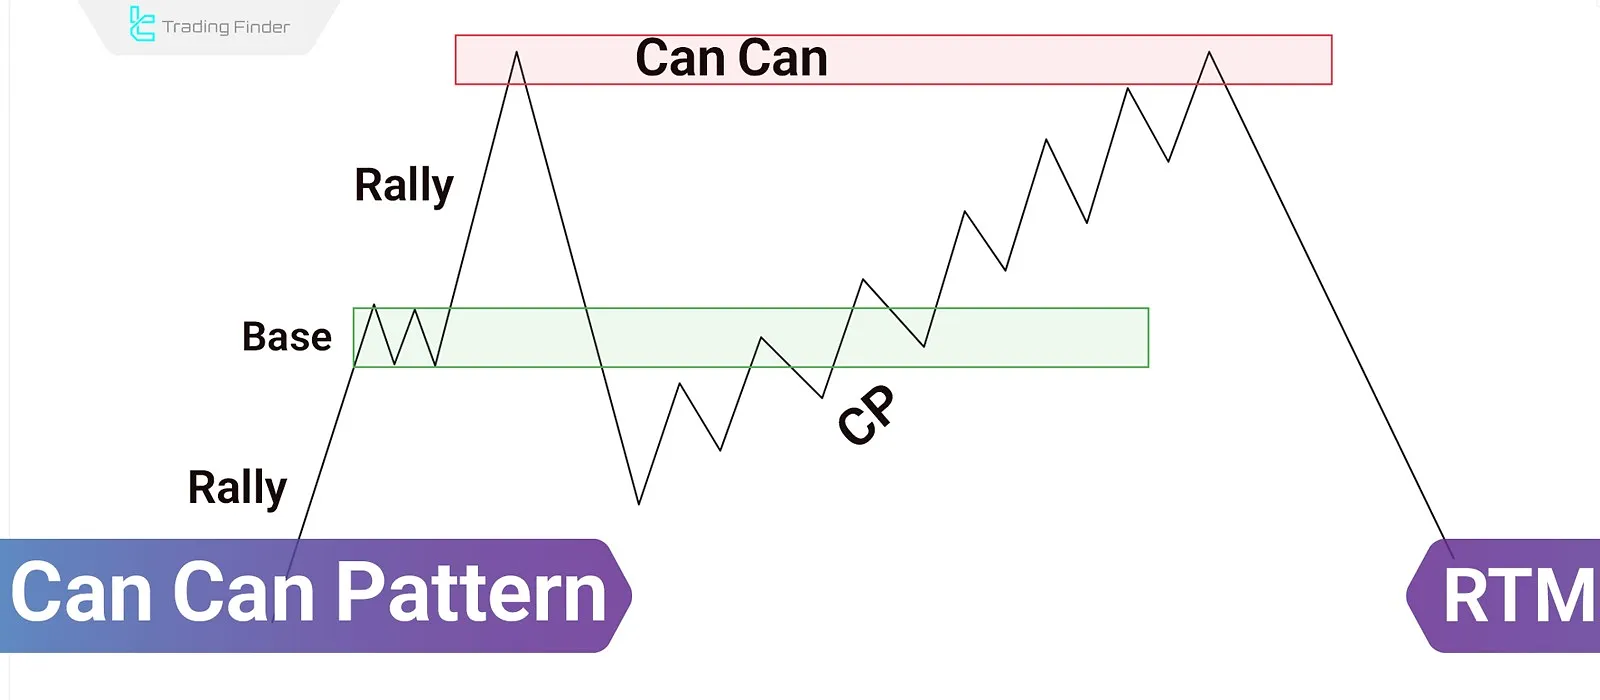
Structure of the Can Can Pattern in RTM
The purpose of this pattern is to identify the zone where market manipulation ends and real direction begins. Four main stages define the Can Can pattern:
- Break of a key level, such as RBR or DBD;
- Move beyond the broken level to collect stop-losses (false breakout);
- Quick return to the previous structure (no breakout confirmation);
- The internal structure breaks in the opposite direction.
This pattern indicates liquidity manipulation and the onset of a true market reversal.
Identifying the Can Can Pattern in RTM Style
When the following signs appear on the chart, the Can Can pattern can be considered valid:
Formation Area
The pattern should occur at a level where the price has reacted multiple times or where many retail orders are stacked.
These are often supply and demand zones or areas loaded with retail stop-losses, indicating liquidity waiting to be grabbed.
Strong and Clear Breakout Candles
The candle that breaks the level is usually large, strong, and high-volume, creating the illusion of trend continuation. Retail traders enter in the direction of the breakout, which is a trap for liquidity gathering.
Quick Return to Structure
If the price quickly and strongly returns inside the previous range after the breakout, it indicates the move was not genuine. This swift return suggests that market makers are redirecting the price.
Advanced Tips for Trading the Can Can Pattern in RTM
To boost accuracy when trading this setup, consider these high-level tips:
Strong FL (Flag Limit)
If the Can Can pattern forms on a well-defined and reaction-rich FL, it carries more weight these zones are decision points for smart money.
Timeframe Matters
The pattern is more reliable on higher timeframes like H1 or H4, as movements there are cleaner and less affected by noise.
Liquidation Clusters
If the pattern forms near areas with many stop-losses stacked behind a key level, it's a sign that smart money is hunting liquidity, and a reversal is likely.
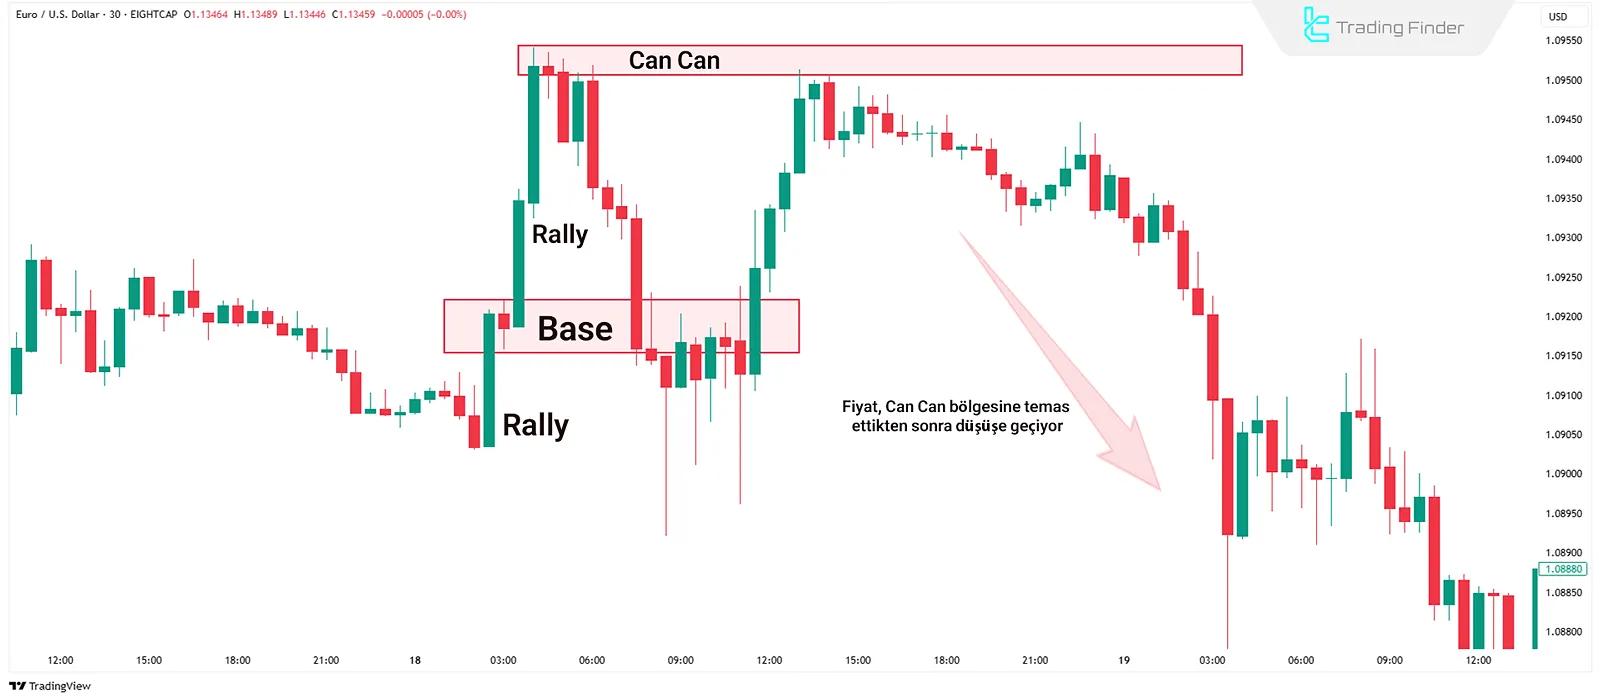
Can Can Pattern Trade Example in RTM Style
On a 30-minute EUR/USD chart, the price forms an RBR structure and taps into a supply zone. After the reaction, the price returns to the base, breaks through it, and collects liquidity below.
Then, the price moves back up to the broken zone (Caps), fails to find support, and aggressively reverses. This sharp move starts at the Can Can zone, and a bearish trend resumes.
Common Mistakes in Using the Can Can Pattern (RTM)
Despite its apparent simplicity, this pattern requires precise execution. Common trader mistakes include:
- Misidentifying the structure: Not every reversal is a Can Can. It must include a strong break, compression, and internal structure break;
- Entering too early: Jumping in without waiting for the internal structure break increases risk;
- Ignoring market context: Focusing only on the Can Can shape without assessing the overall market structure leads to poor entries.
Conclusion
The Can Can Pattern in RTM is used to spot real market reversals after false breakouts and liquidity grabs. It becomes more reliable when there's a strong level break (like RBR/DBD), a quick price return, pre-reversal compression, and an internal structure break.
Key factors to consider include the formation zone, breakout candle, timeframe, flip level quality, and stop-loss clusters. The pattern works best when it aligns with the higher timeframe trend and there’s liquidity behind the broken level.


