


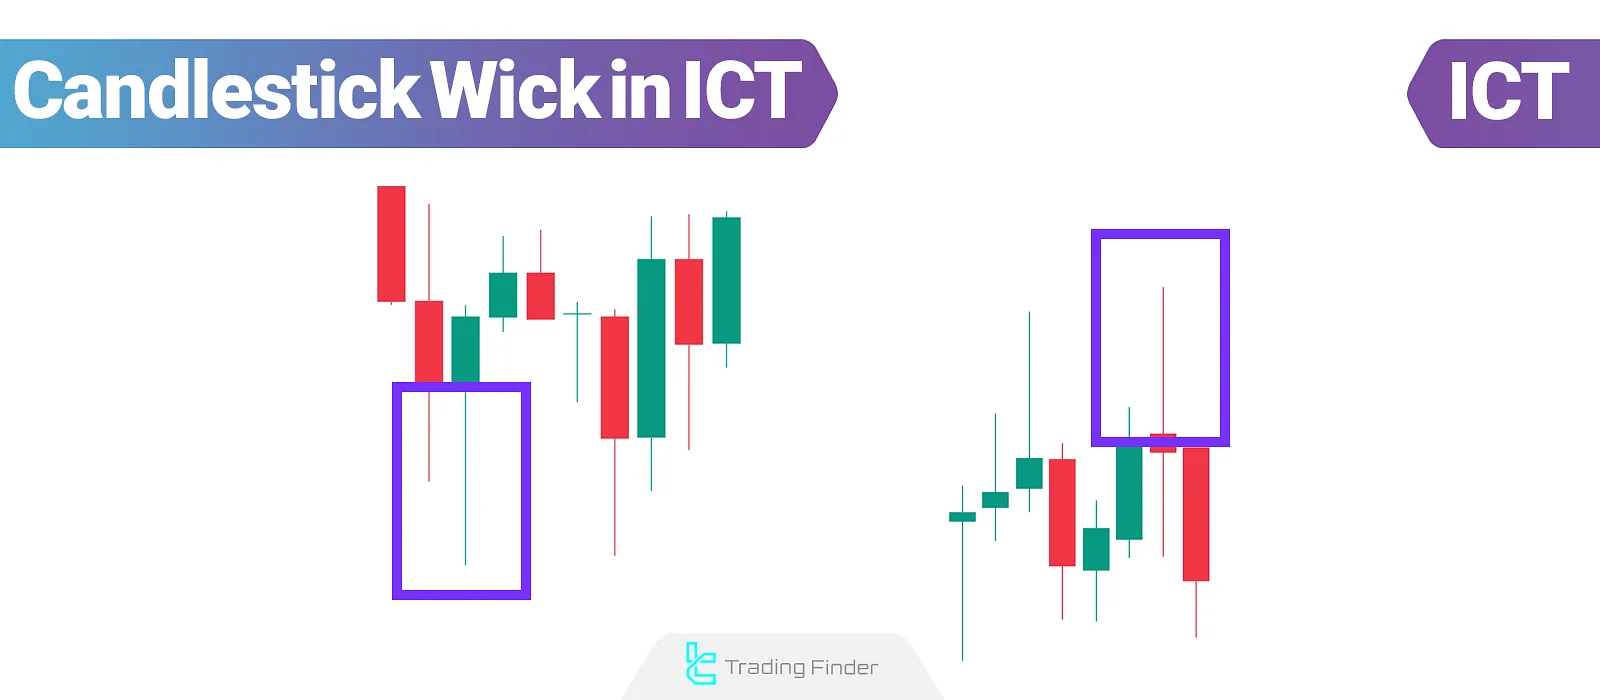
The candlestick shadow in ICT reveals is a precise depiction of the market's reaction to key levels and its behavior relative to the prevailing trend by illustrating moments of price reversal in lower timeframes.
Candlestick wick trading in ICT highlights areas where price has penetrated but failed to hold, often indicating strong supply or demand pressure.
In many cases, candlestick patterns combined with detailed wick analysis serve as the foundation for professional traders' decision-making, as they provide signals of potential future market reactions.
What Is a Candlestick Wick?
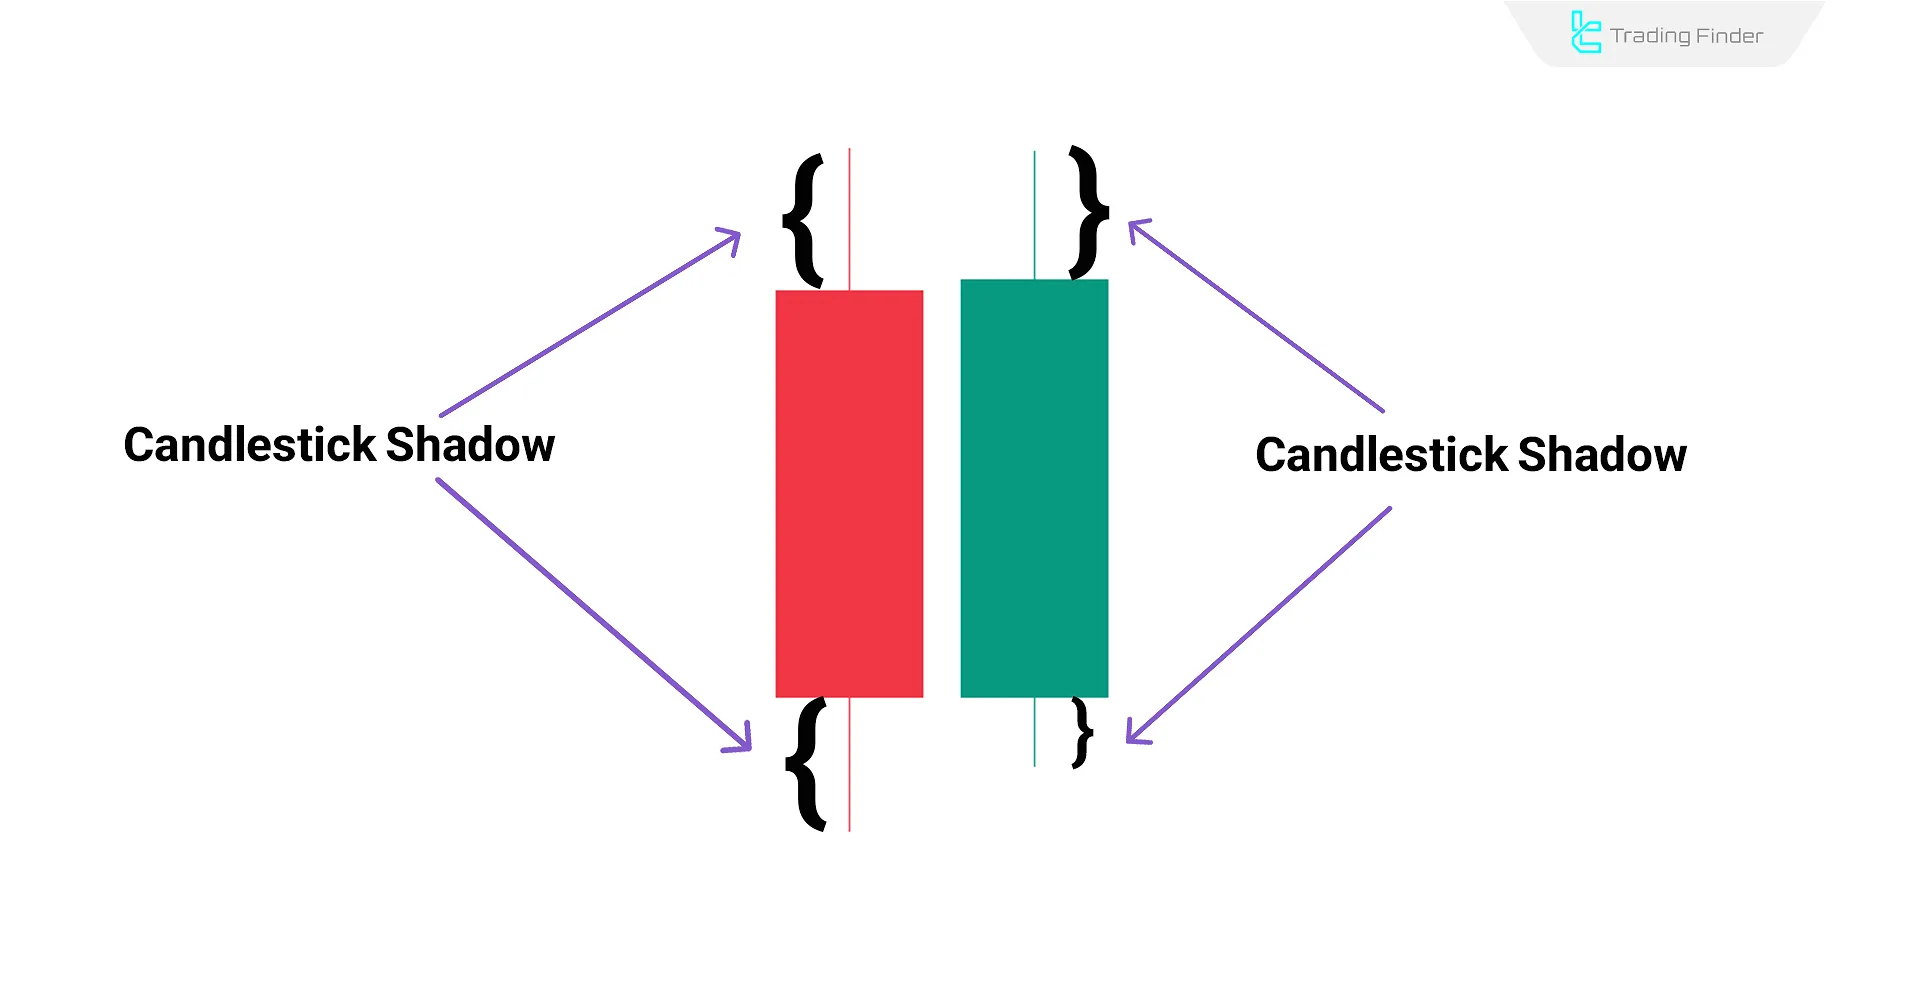
The candlestick shadow in ICT, known as the shadow or wick, reflects rapid price fluctuations in lower timeframes and appears outside the candlestick body as lines above or below.
This section displays the range between the highest and lowest prices, representing strong market reactions to price levels.
Points formed within the Candlestick Wick in ICT are often analyzed as short-term support or resistance levels, indicatingpotential price reversals or trend continuations.
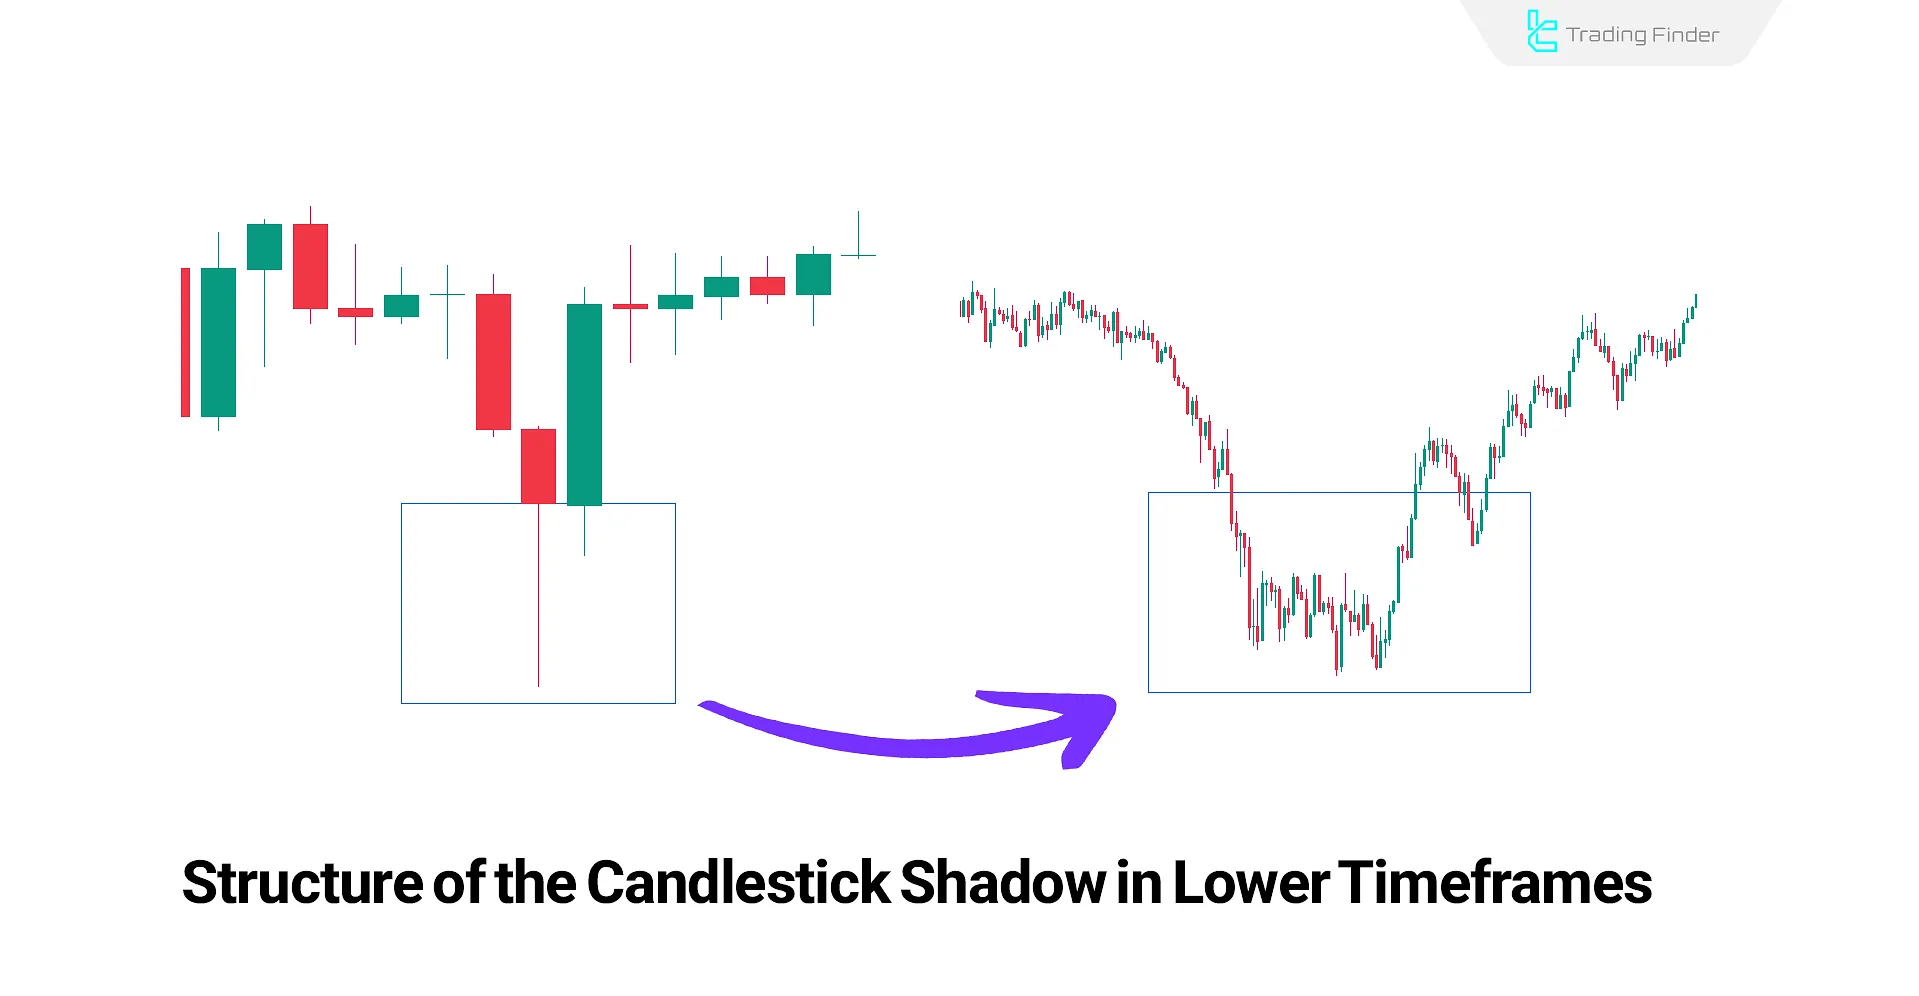
How Wicks Are Formed?
For precise analysis of candlestick wick trading in ICT, first identify the wick area in the primary timeframe, then move to lower timeframes.
This method reveals the internal structure of the wick [formed by smaller candles and rapid price fluctuations]. Through this technique, aggressive reactions and sensitive market points can be detected.
Analyzing Candlestick Wicks in ICT
In the ICT (Inner Circle Trader) trading style, long candlestick wicks are considered as liquidity pools. Types of candlestick shadow in ICT:
- Long Upper Wick: Indicates liquidity at the upper level of the candle and activation of sell orders, signaling strong seller presence;
- Long Lower Wick: Suggests liquidity below the candle and absorption of buy orders, reflecting strong buyer entry at that price level.
These areas are often identified as price targets in liquidity-based strategies. In the table below, we compare a long upper shadow and a long lower shadow:
Comparison Item | Long Upper Shadow | Long Lower Shadow |
Psychology | Attracting buyers’ liquidity, triggering Buy Stops | Attracting sellers’ liquidity, triggering Sell Stops |
Application in ICT | Liquidity Grab & CHOCH signal at the top | Liquidity Sweep & BOS signal at the bottom |
Volume Behavior | Volume spike with sell orders entering the market | Volume increase with smart money inflows |
Trading Strategy | Sell after candle and CHOCH confirmation | Buy after candle and BOS confirmation |
Common Mistake | Premature entry before structural confirmation | Impulsive buying without volume confirmation |
Key Points About Candlestick Wicks in ICT
In ICT, analyzing wicks as liquidity clusters and hidden price behaviors allows precise identification of active liquidity levels and prediction of price direction based on pending orders.
This analysis plays a crucial role in understanding order flow and identifying high-probability entry and exit points.
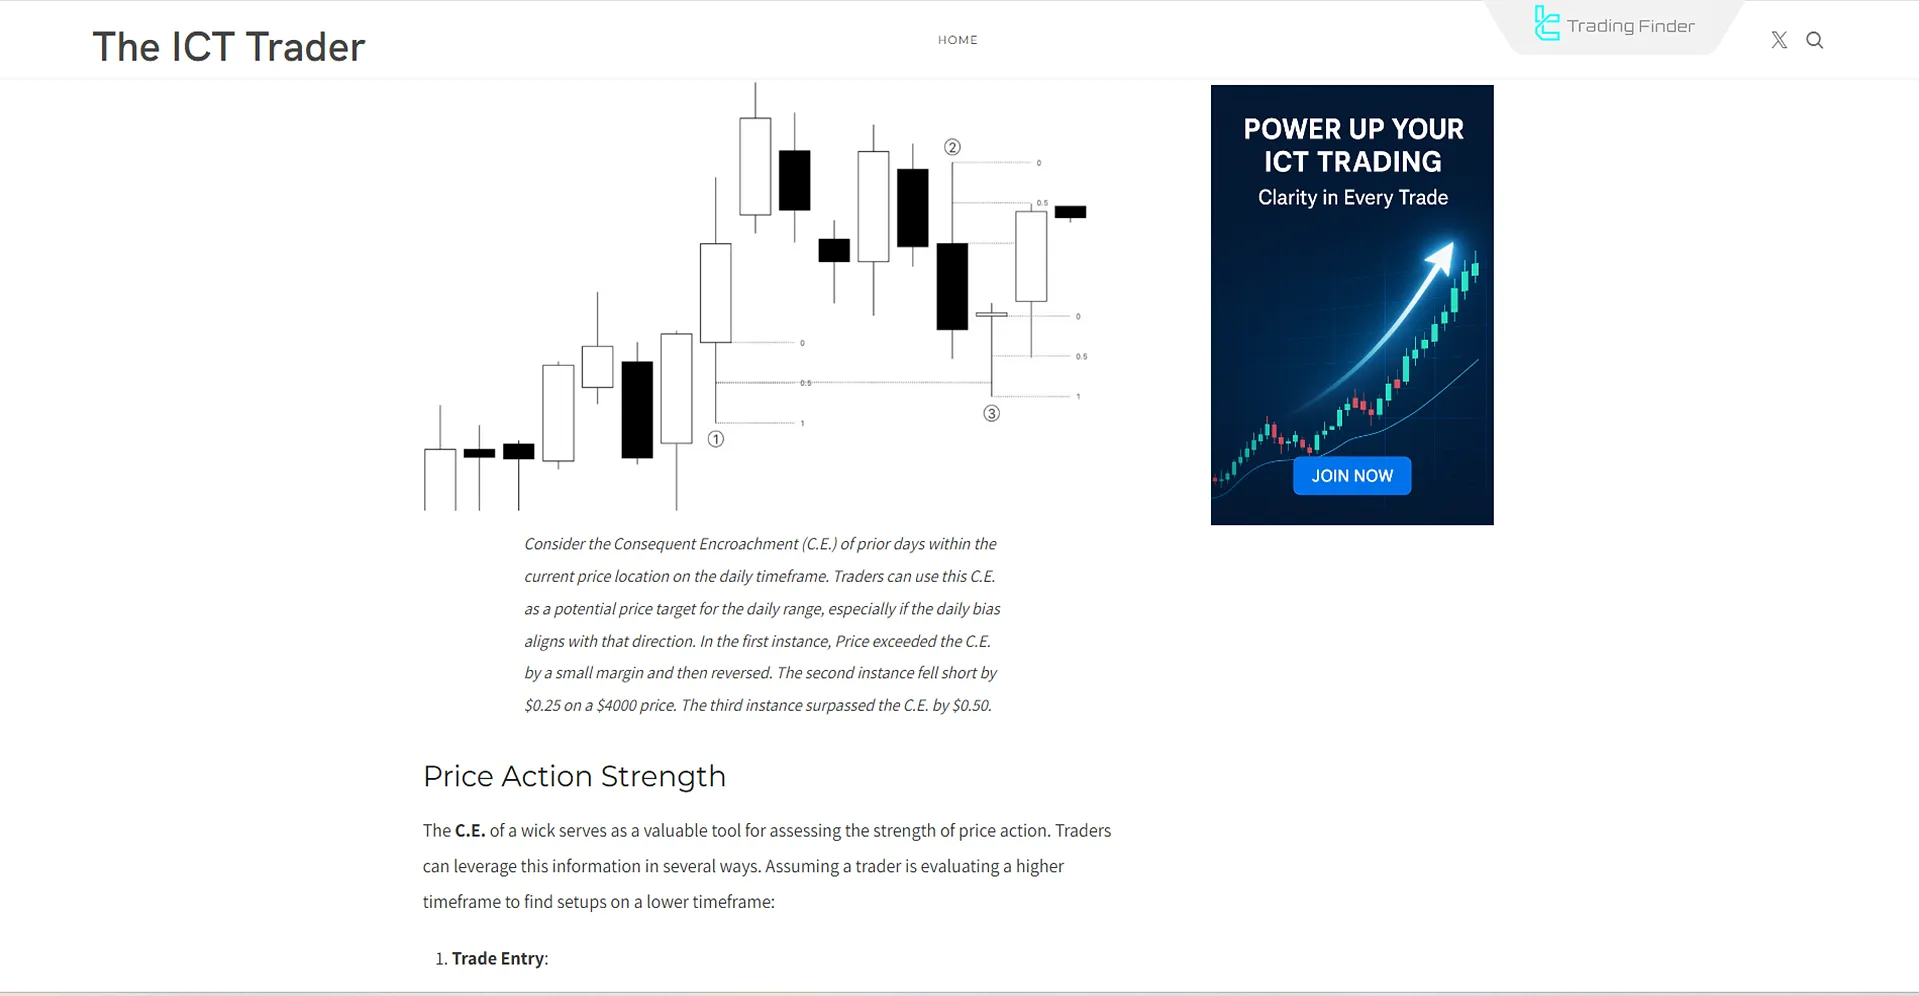
Interpreting the shadow of a candlestick (Interpretation of Candlestick Shadows) plays a crucial role in understanding order flow and in pinpointing entry or exit points with a higher probability of success.
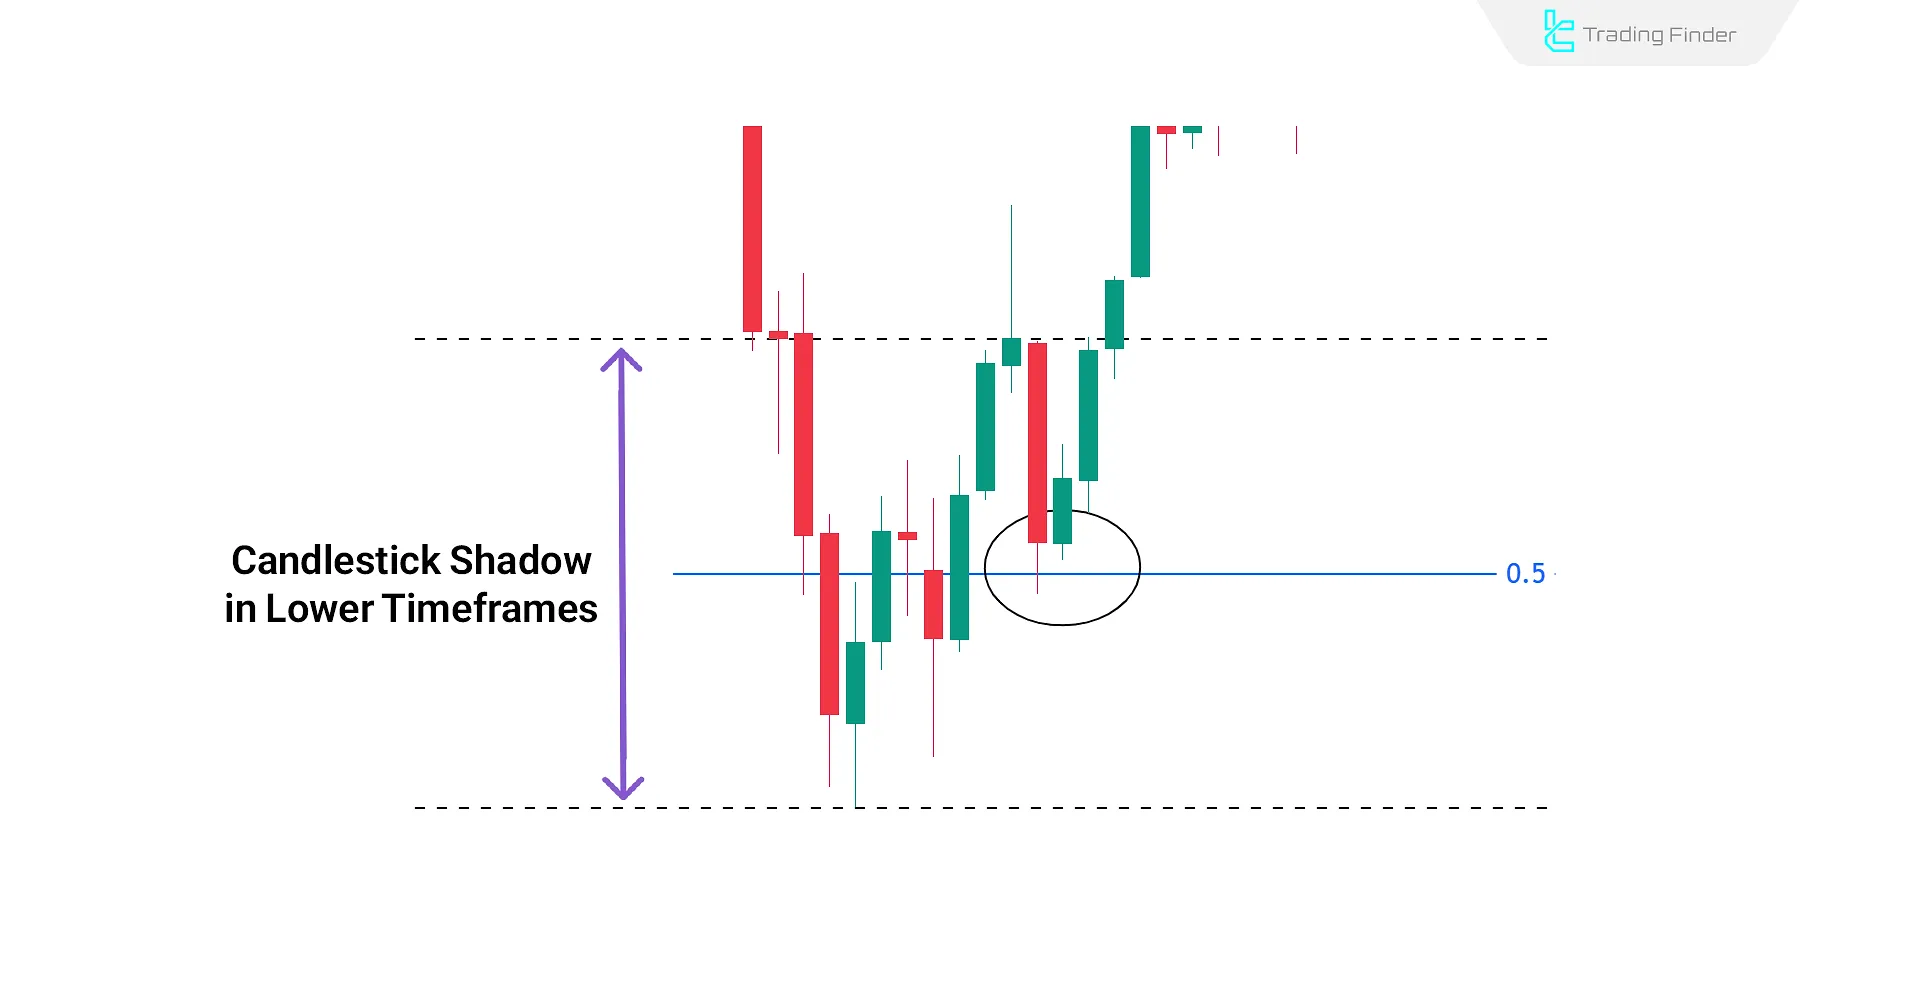
The midpoint of shadows is known as Consequent Encroachment (CE) and functions similarly to the 50% Fibonacci level. This area is regarded as a key zone where the likelihood of price reverting or continuing increases.
By drawing the Fibonacci tool from the shadow’s low to its high, the trader can mark this point and assess price reactions to it.
Using this level in higher time frames provides a clearer picture of price balance and order flow, enhancing the precision of trading decisions.
Reaction to the 50% Level of Wicks
In ICT trading, the 50% level of the wick is seen as a dynamic support or resistance zone. Price reaction at this level is critical for predicting the market's probable direction.
For example, if a long wick forms and subsequent candles react to the 50% level, it confirms the market's intention to move in that direction.
If the price reacts before reaching the 0.5 wick level, it signals strong liquidity strength and a stronger confirmation for the ongoing movement.
Lack of Reaction to the 50% Wick Level in ICT
Sometimes, the price rapidly returns to the 50% shadow level and even breaks through it.
In such cases, the closing of lower timeframe candles below this level is considered a structural break signal.
The way the price returns and the candlestick pattern formed around the 0.5 shadow level are crucial in assessing the strength of the continued movement.
The candlestick structure, reaction intensity, and closing location are key factors in the analysis.
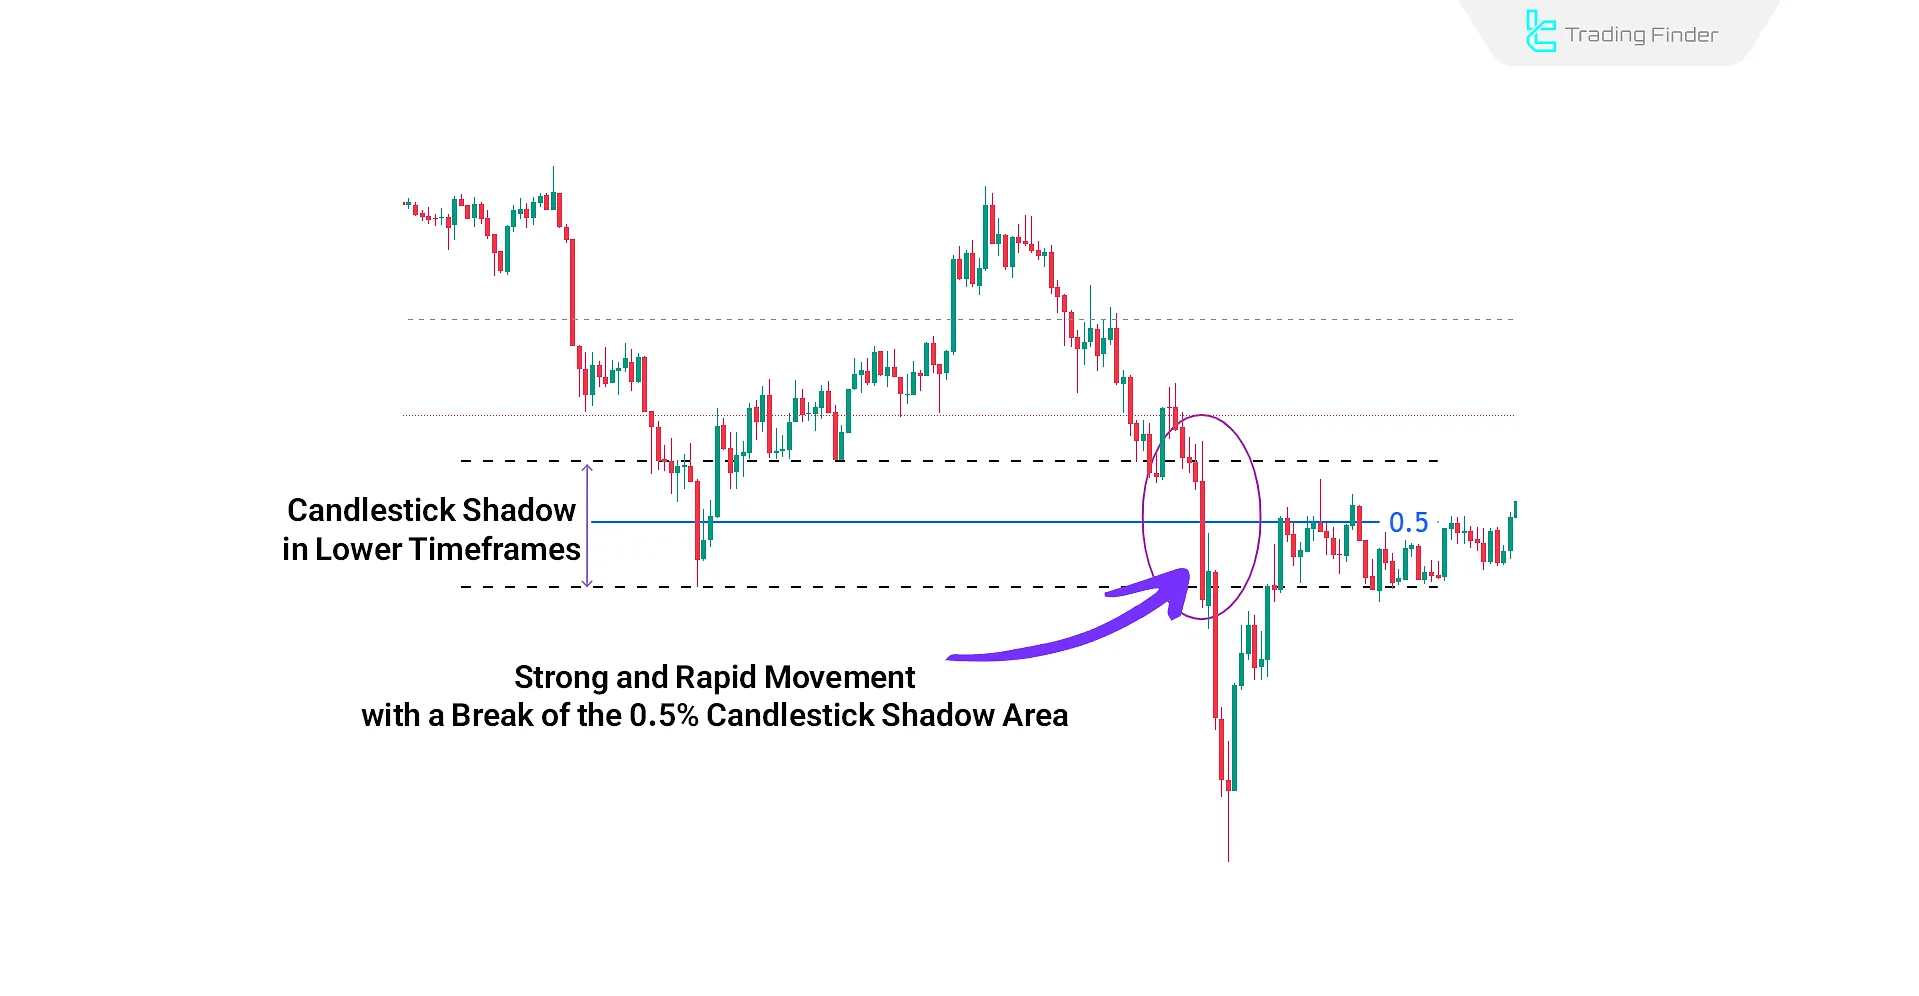
An example of ignoring the 50% shadow area can be seen below:
Getting confirmation for reacting to the shadow midpoint area in trading (Shadow in Trading)
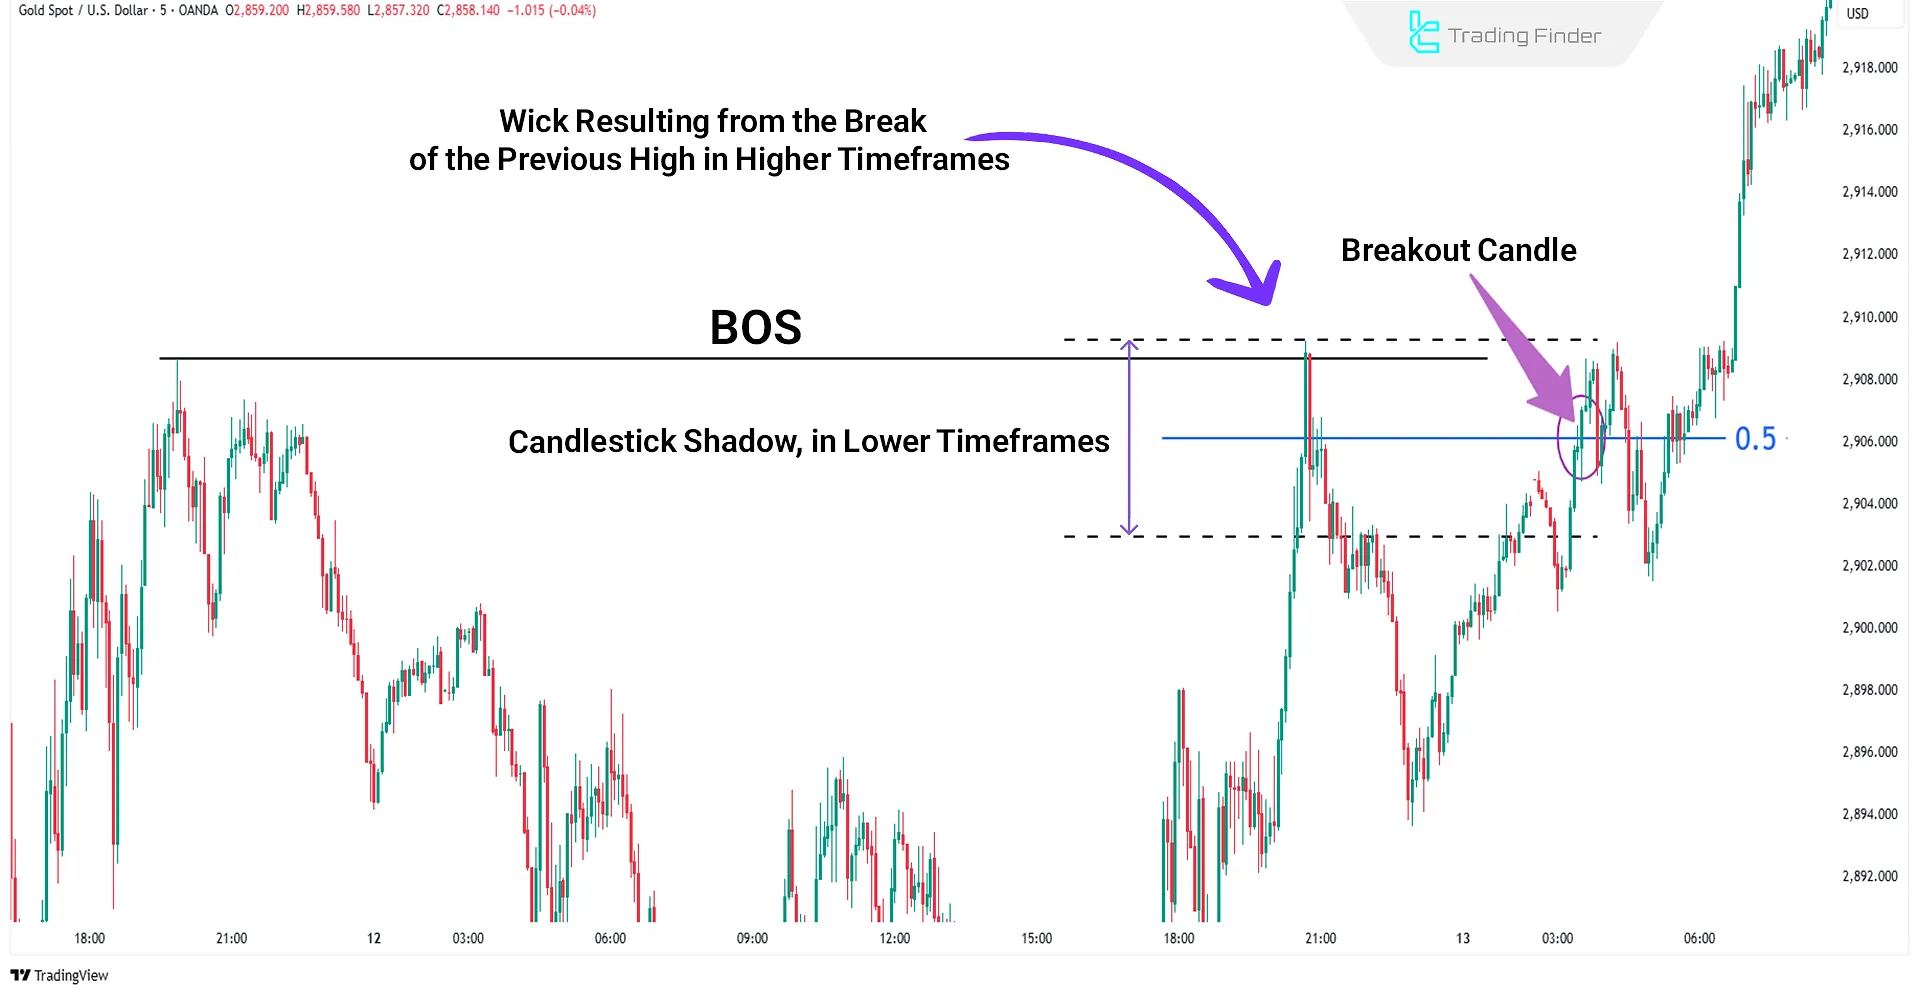
When the price reaction to the 50% wick alone isn't enough for entry, valid structural confirmation is needed. Here, a Break of Structure (BOS) plays a decisive role.
After the initial reaction to the 0.5 wick area, a BOS aligned with the market flow is a signal for entry.
The entry point is based on this break, and the Stop Loss is placed behind the newly formed high or low during the return to a Fair Value Gap (FVG), or behind the FVG itself.
This combination utilizes liquidity concepts, market structure, and imbalance zones simultaneously.
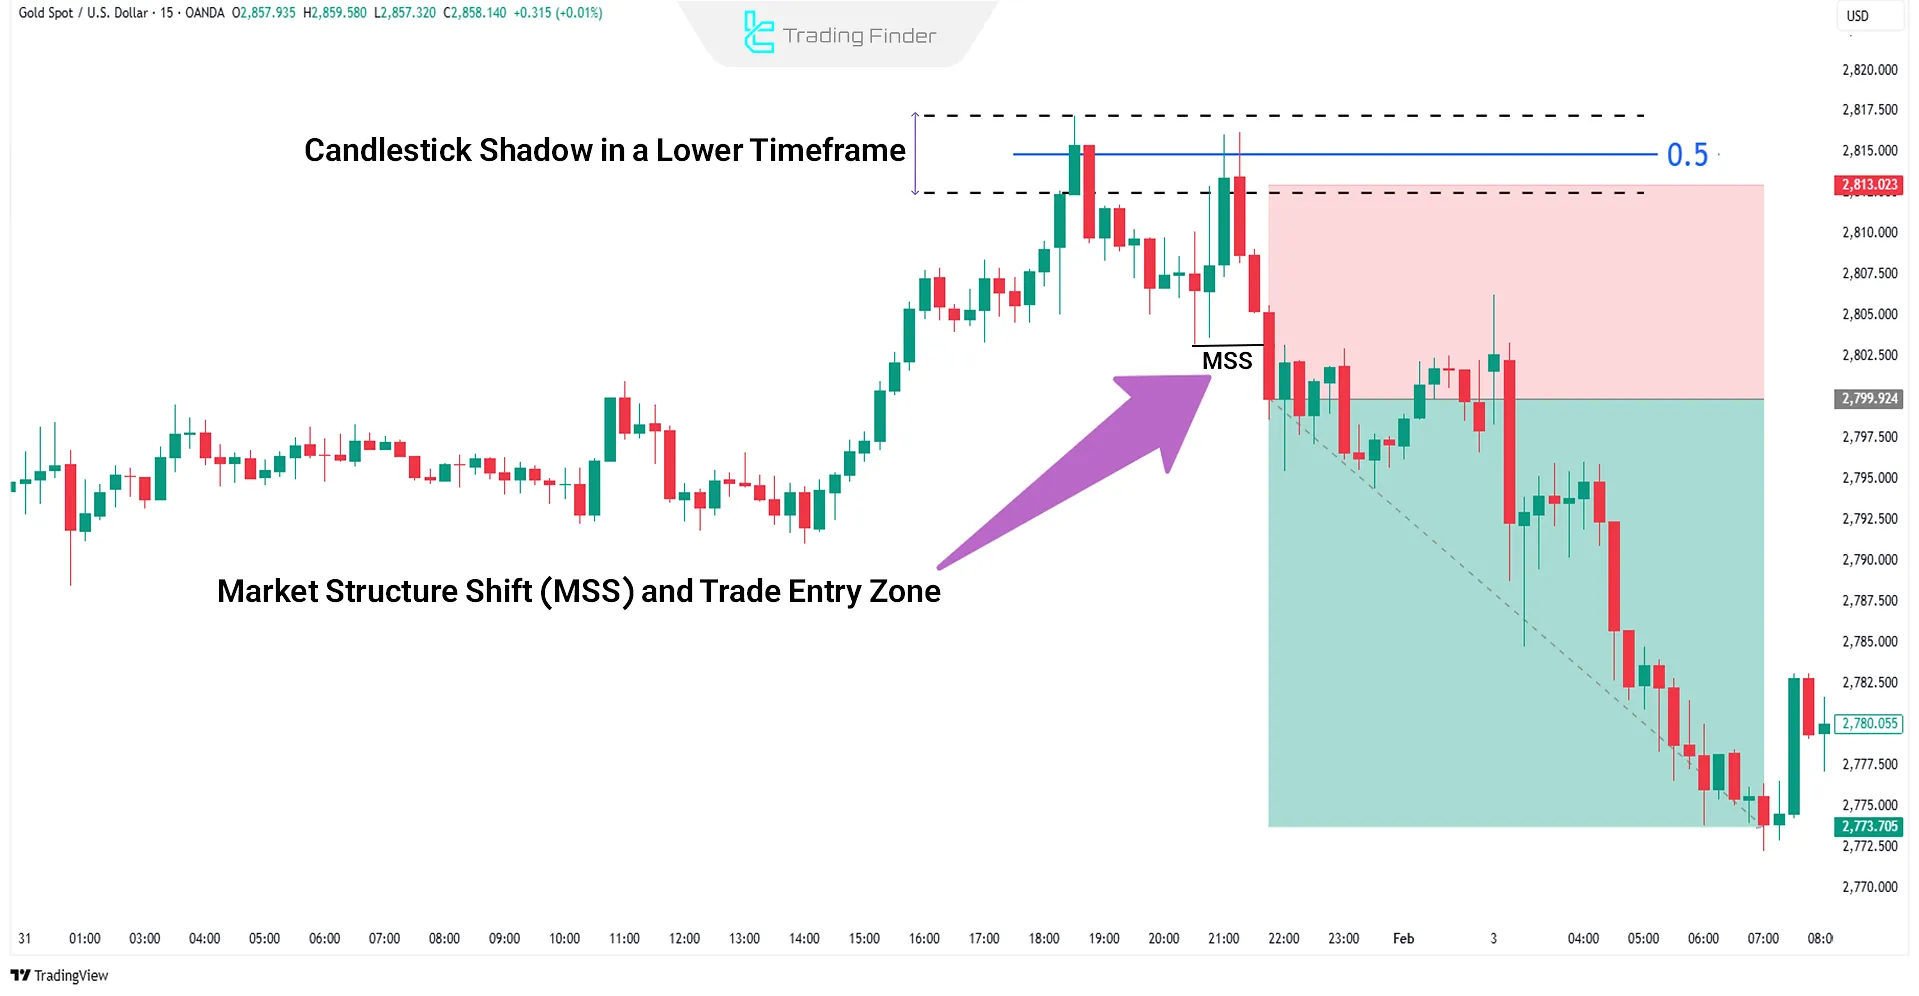
Example of trading the midpoint of a candlestick’s shadow with structural confirmation
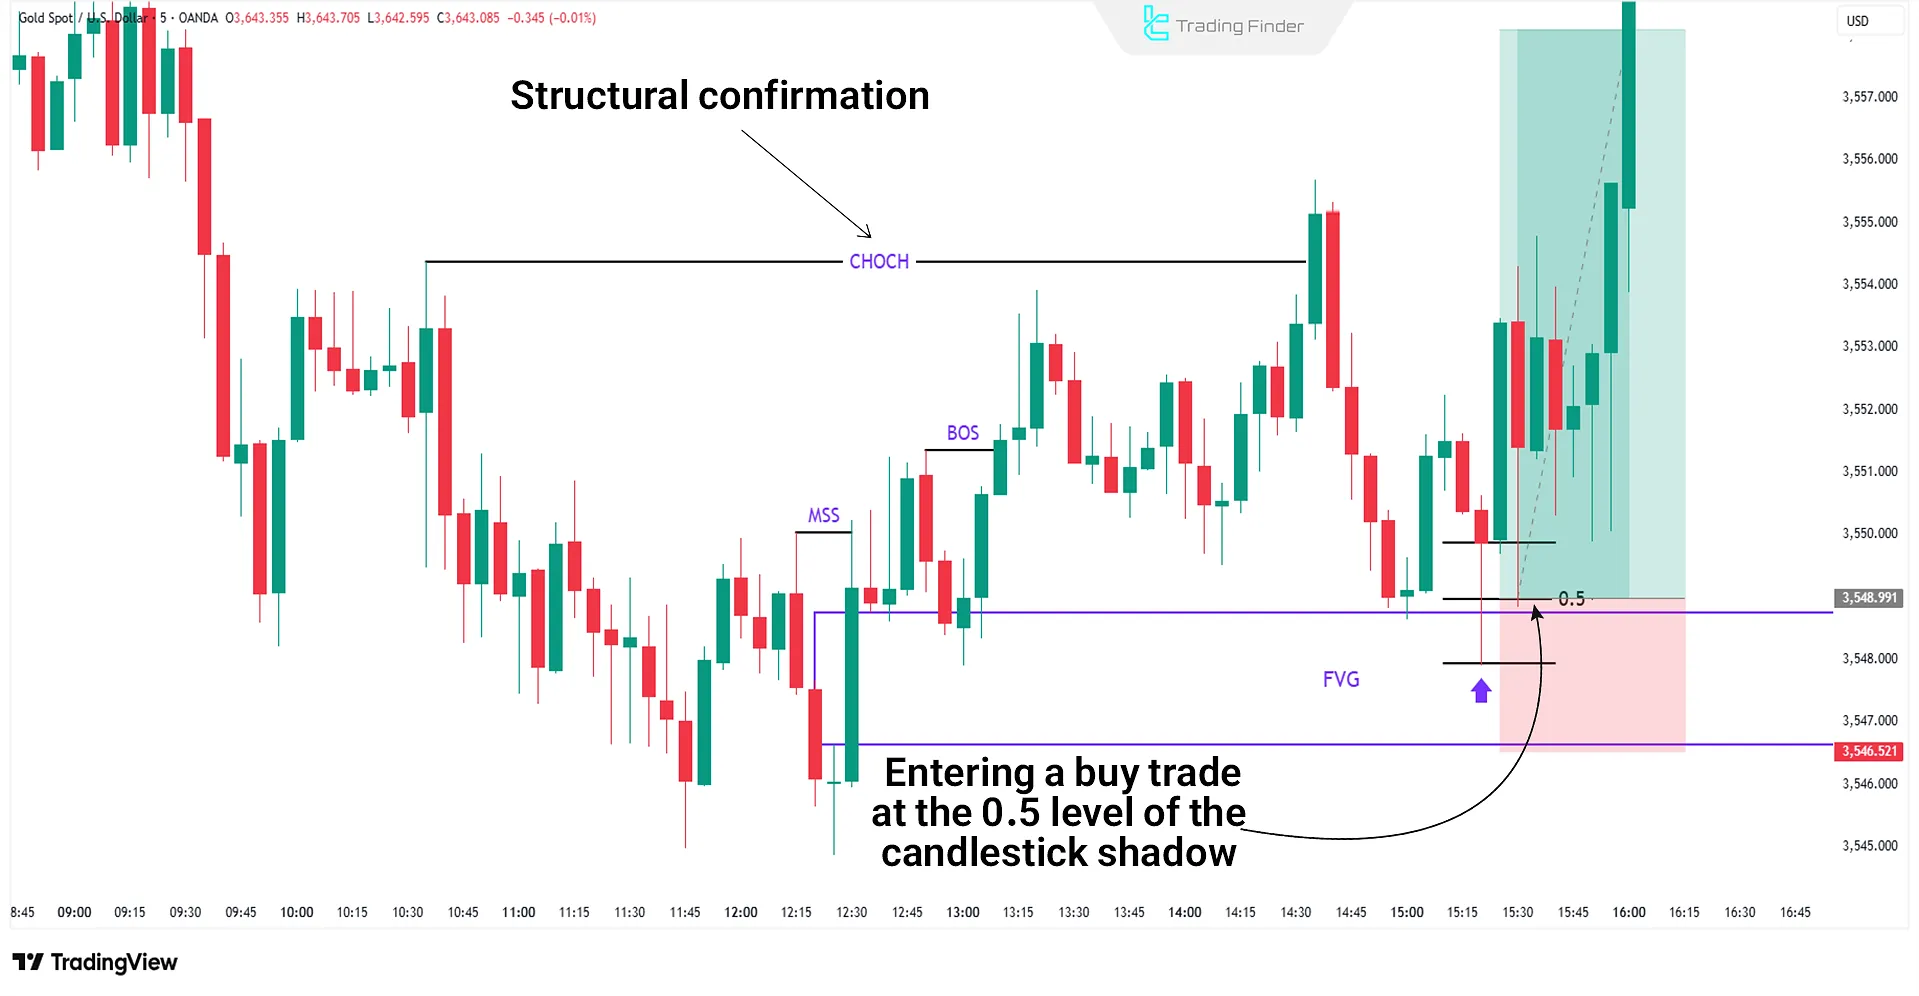
In the example below, after a structural change (CHOCH) and a pullback to the Fair Value Gap (FVG), gold’s price prints a candle with a long shadow; given this price reaction and the available confirmations, one can enter a long position at the half of the formed shadow.
The stop-loss for this trade is placed behind the FVG area, and the take-profit is set at the break of the next structure or upcoming resistance zones.
To master and better understand Candlestick shadows in ICT, you can refer to the educational video by the TTrades channel on YouTube:
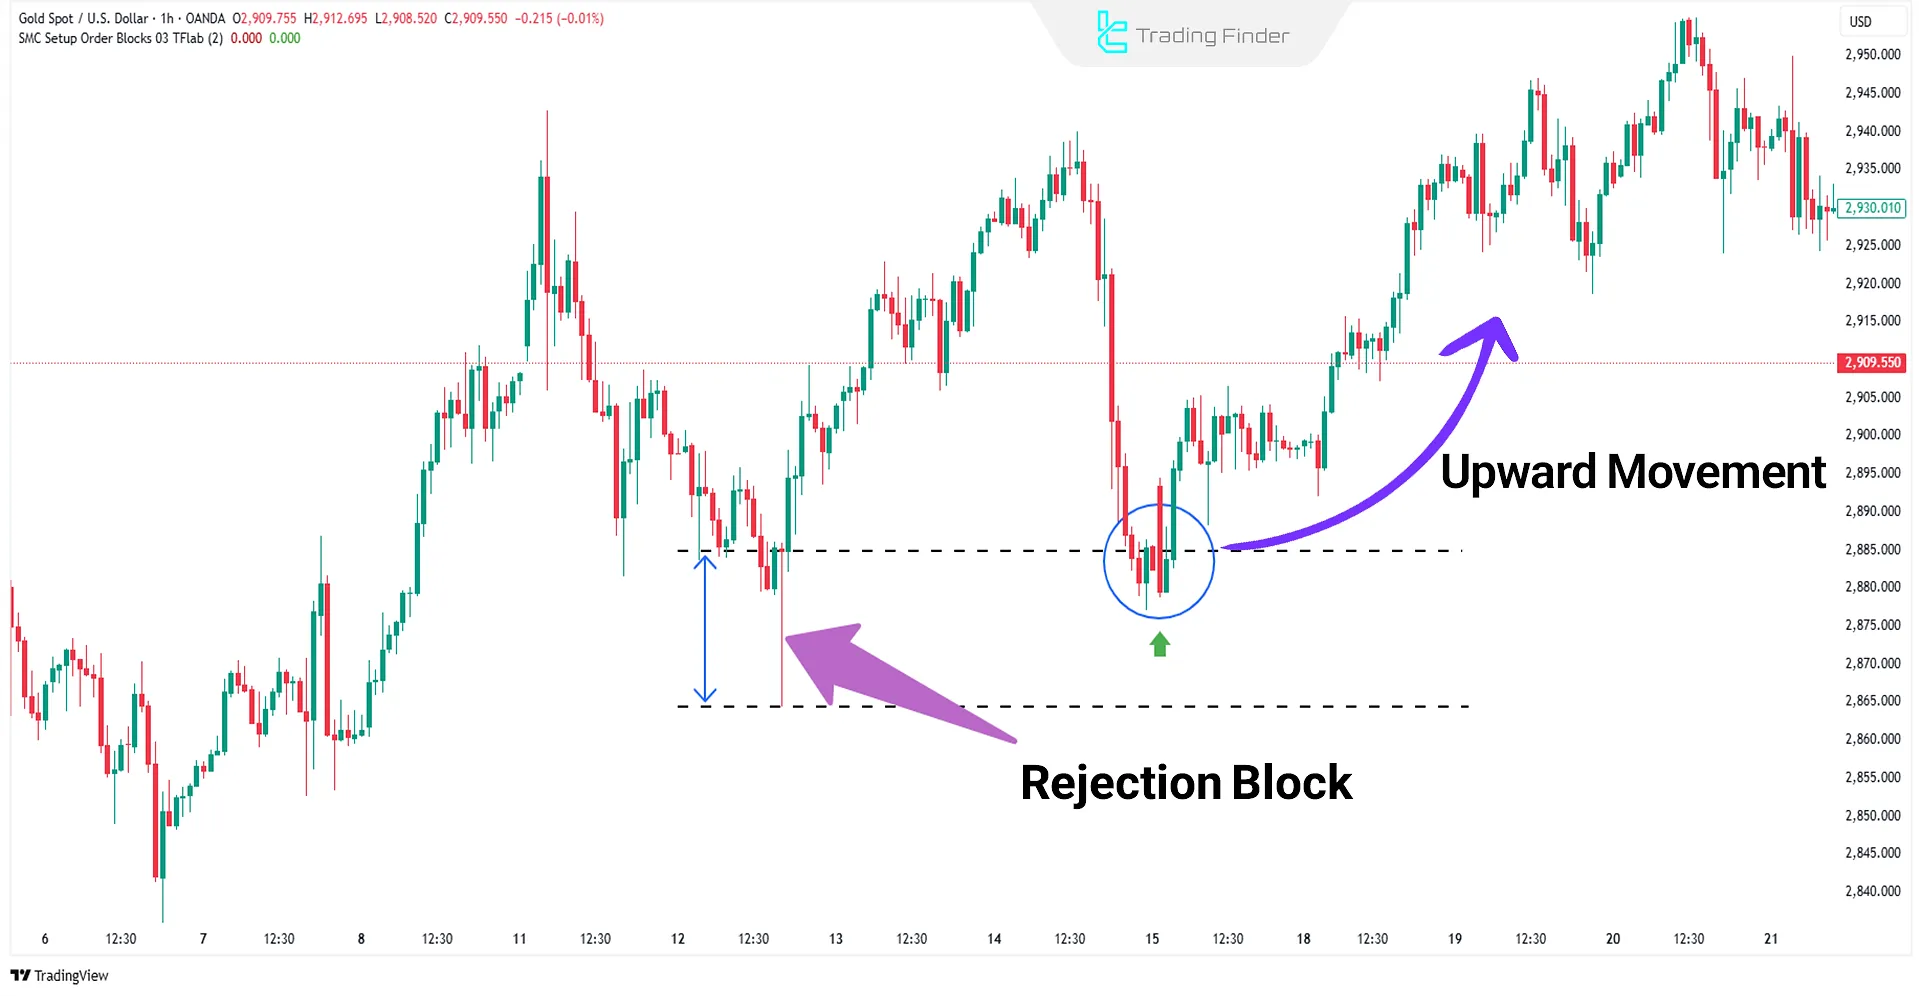
Candlestick Wicks in ICT as Rejection Blocks
In ICT trading, the candlestick shadow sometimes appears as Rejection Blocks specific zones where price faced intense buying or selling pressure from institutional orders.
Rejection shadows are often observed at levels formed before powerful market moves begin and are recognized as areas of institutional liquidity and hidden orders.
Rejection Blocks often form before major market moves and are recognized as institutional liquidity zones and hidden orders.
Accurate identification of these areas allows for optimal entry and exit positioning as they often act as reversal or continuation zones.
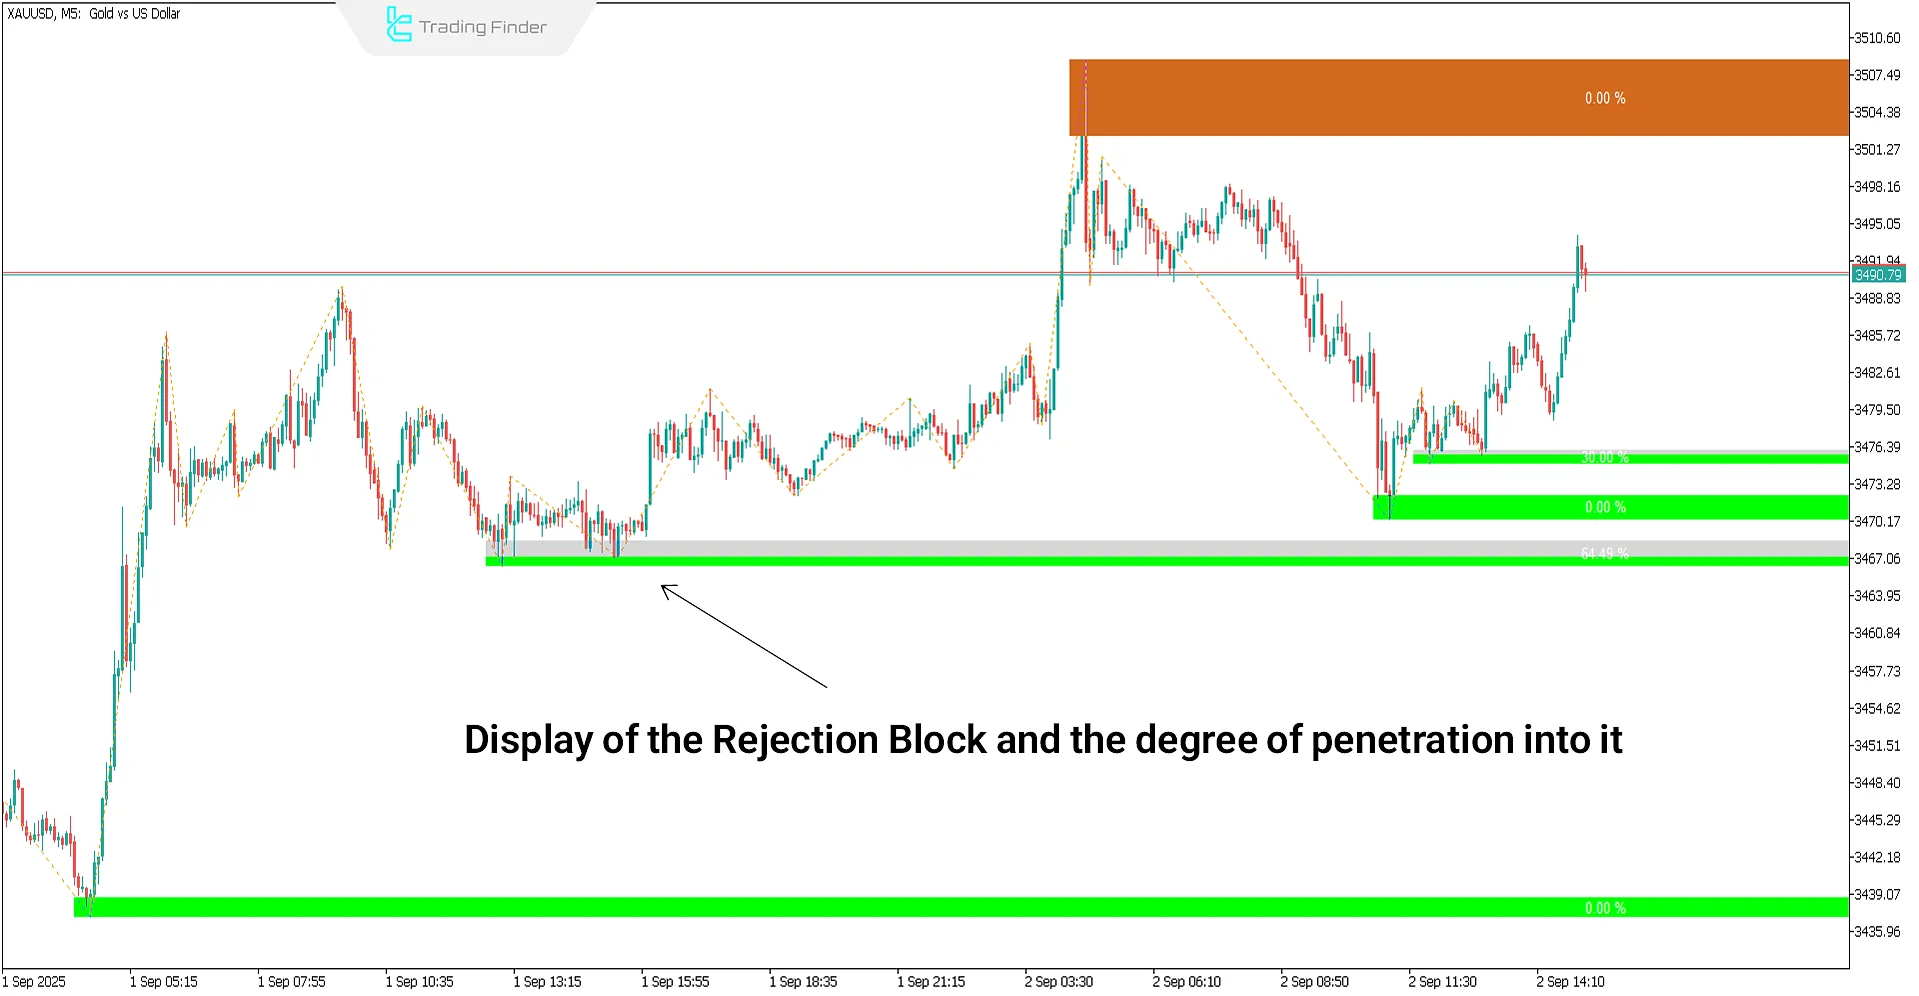
Rejection Block Indicator
The Rejection Block indicator is a specialized tool in ICT and advanced price action styles, designed to identify reversal zones.
This indicator intelligently draws Rejection Block areas on the MetaTrader chart and, by precisely analyzing the meaning of candlestick shadows, identifies the potential market turning points.
Long shadows near price highs and lows are recognized as probable reaction levels.
The Void section or the consumed area of a Rejection Block is displayed in gray, and once this area is fully filled, the level loses its validity and the block becomes ineffective. Technical specs and categorization:
- Category: ICT and Smart Money indicators
- Platform: MetaTrader 4 and 5
- Required skill level: Intermediate
- Use: Multi-Timeframe
- Markets: Forex, cryptocurrency, stocks, commodities, and forward contracts
The operation and signaling of the Rejection Block indicator are as follows:
- Draw a green box for a bullish Rejection Block and a red box for a bearish block;
- After a price low forms, the Rejection Block zone is defined, and when price returns to this level, a Buy Entry opportunity is created;
- After a bearish Rejection Block forms, price retraces, and upon retesting the level, conditions for a Sell entry are provided.
By detecting reversal levels and visualizing them, this indicator enables designing trading scenarios with controlled risk. Its key settings include:
- Ability to change block colors and customize the number of candles analyzed;
- Displaying BOS and CHoCH at trader-selected levels;
- Ability to draw vertical separator lines for better chart structure;
- Automatic detection of invalid blocks if a candle closes outside the block’s bounds.
The Rejection Block indicator is a precise and practical tool for ICT-style traders and liquidity-based strategies.
Combining this tool with concepts like BOS and CHOCH creates a more complete trading strategy and allows the analyst to make entry and exit decisions with greater accuracy.
For easier identification and use of Rejection Blocks, you can use the practical and free Rejection Block indicator on the MetaTrader platform:
- Download Rejection Block (Rejection Block + Void) indicator for MetaTrader 5
- Download Rejection Block (Rejection Block + Void) indicator for MetaTrader 4
Important Points When Using Candlestick Wicks in ICT
In wick-based technical analysis:
- Wick length indicates market reaction strength and price level significance; long wicks often suggest institutional liquidity intervention;
- The location of wick and body formation within the trend structure is critical; reactions at structural highs or lows make the analysis more precise;
- Candlestick patterns formed at relevant areas act as behavioral confirmations and must be carefully evaluated.
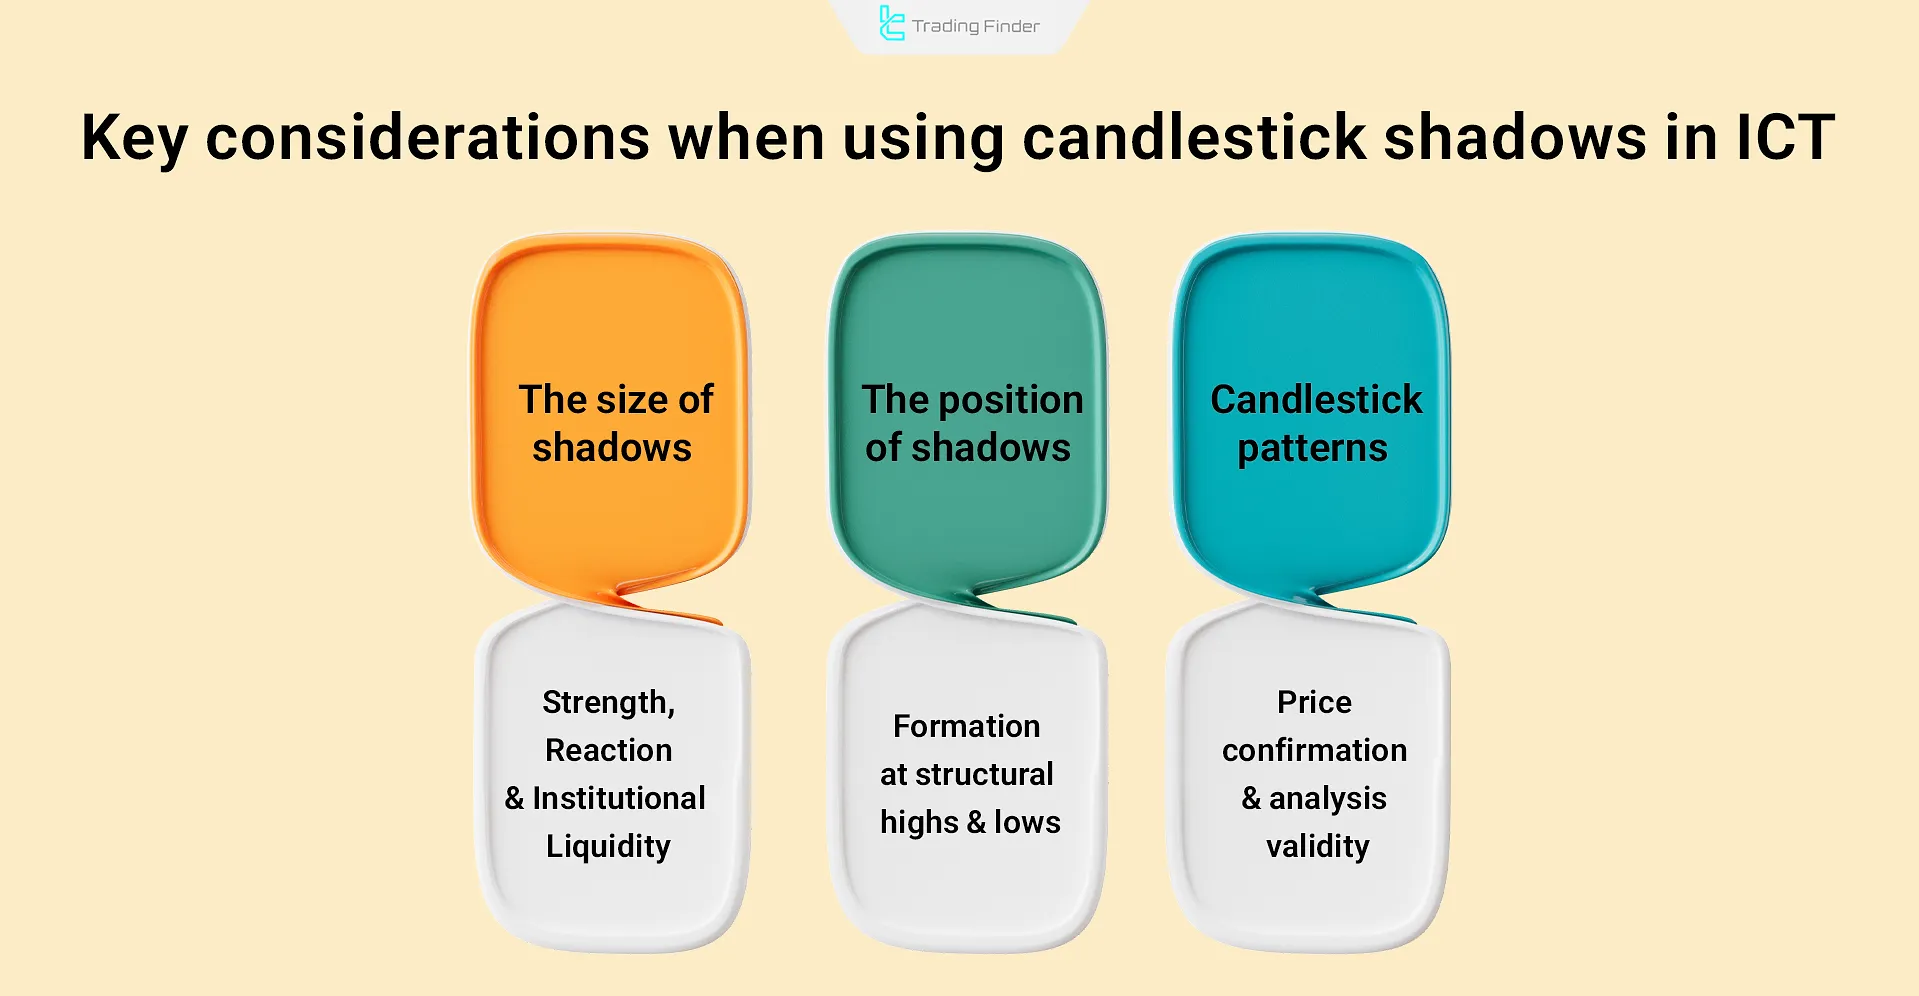
Combination of these elements offer an advanced perspective on order flow, hidden liquidity, and potential future price movements.
For further study on candlestick shadows, you can also refer to the educational article Training on candlestick shadows on theicttrader.com.
Conclusion
Shadows (Wicks) on candlesticks highlight critical market levels. The size of the Candlestick Wick in ICT varies based on the significance of chart zones; longer wicks suggest encounters with stronger levels.
Long wicks typically indicate price reactions to liquidity zones, Order Blocks, orRejection Blocks and can be used to identify probable reversal points or trend continuations in ICT style.


