


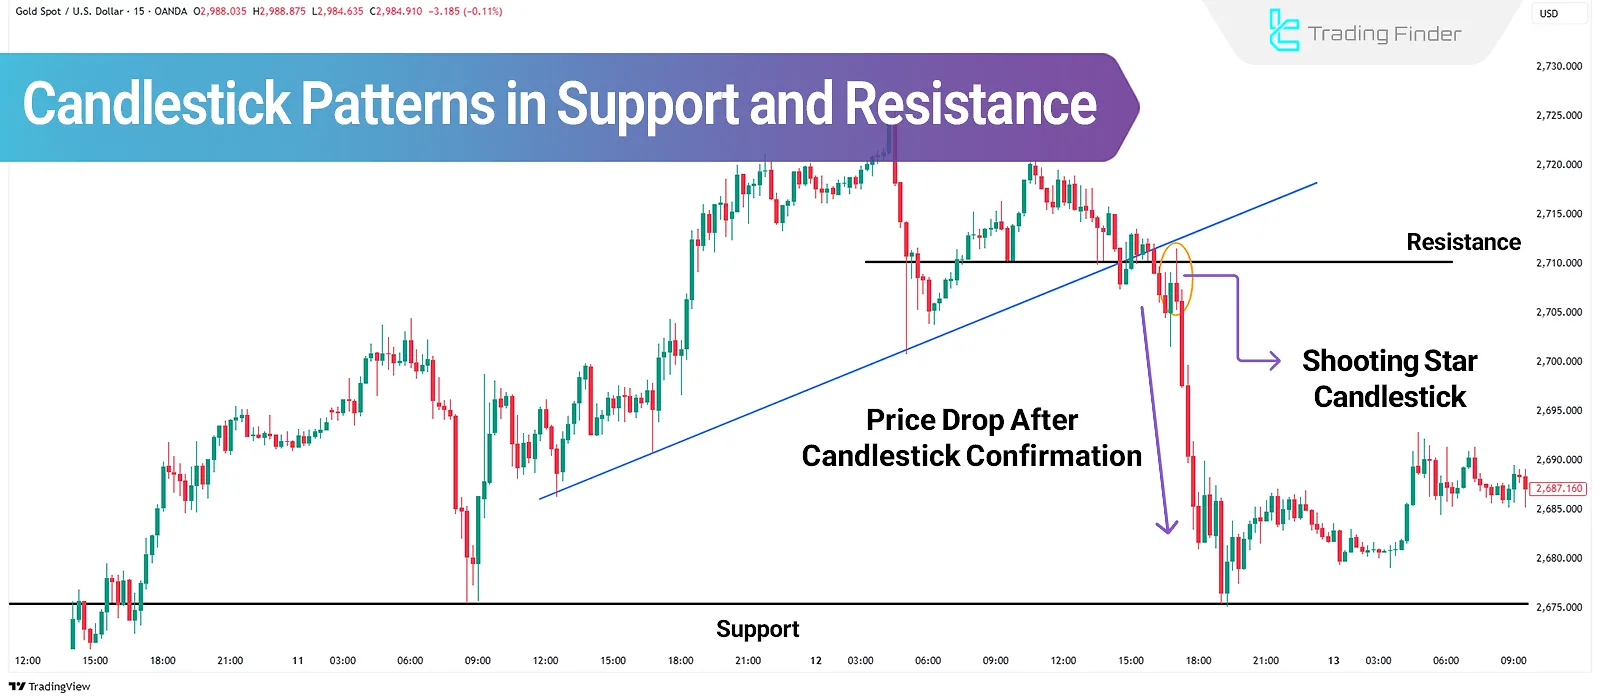
Candlestick patterns, as the foundation of Price Action analysis, reflect order behavior at key supply and demand zones. Combining these patterns with Support and Resistance levels enables identifying trading opportunities with higher reliability.
These patterns mirror market sentiment and traders' reactions at various chart areas. The formation of candlestick patterns near significant technical levels provides strong confirmation for entering or exiting trades.
This approach not only enhances the credibility of key price zones in technical analysis but also significantly increases trading precision.
Using Candlestick Patterns in Support and Resistance
Applying reversal and breakout patterns within candlestick structures at Support and Resistance zones is one of the most practical trading methods.
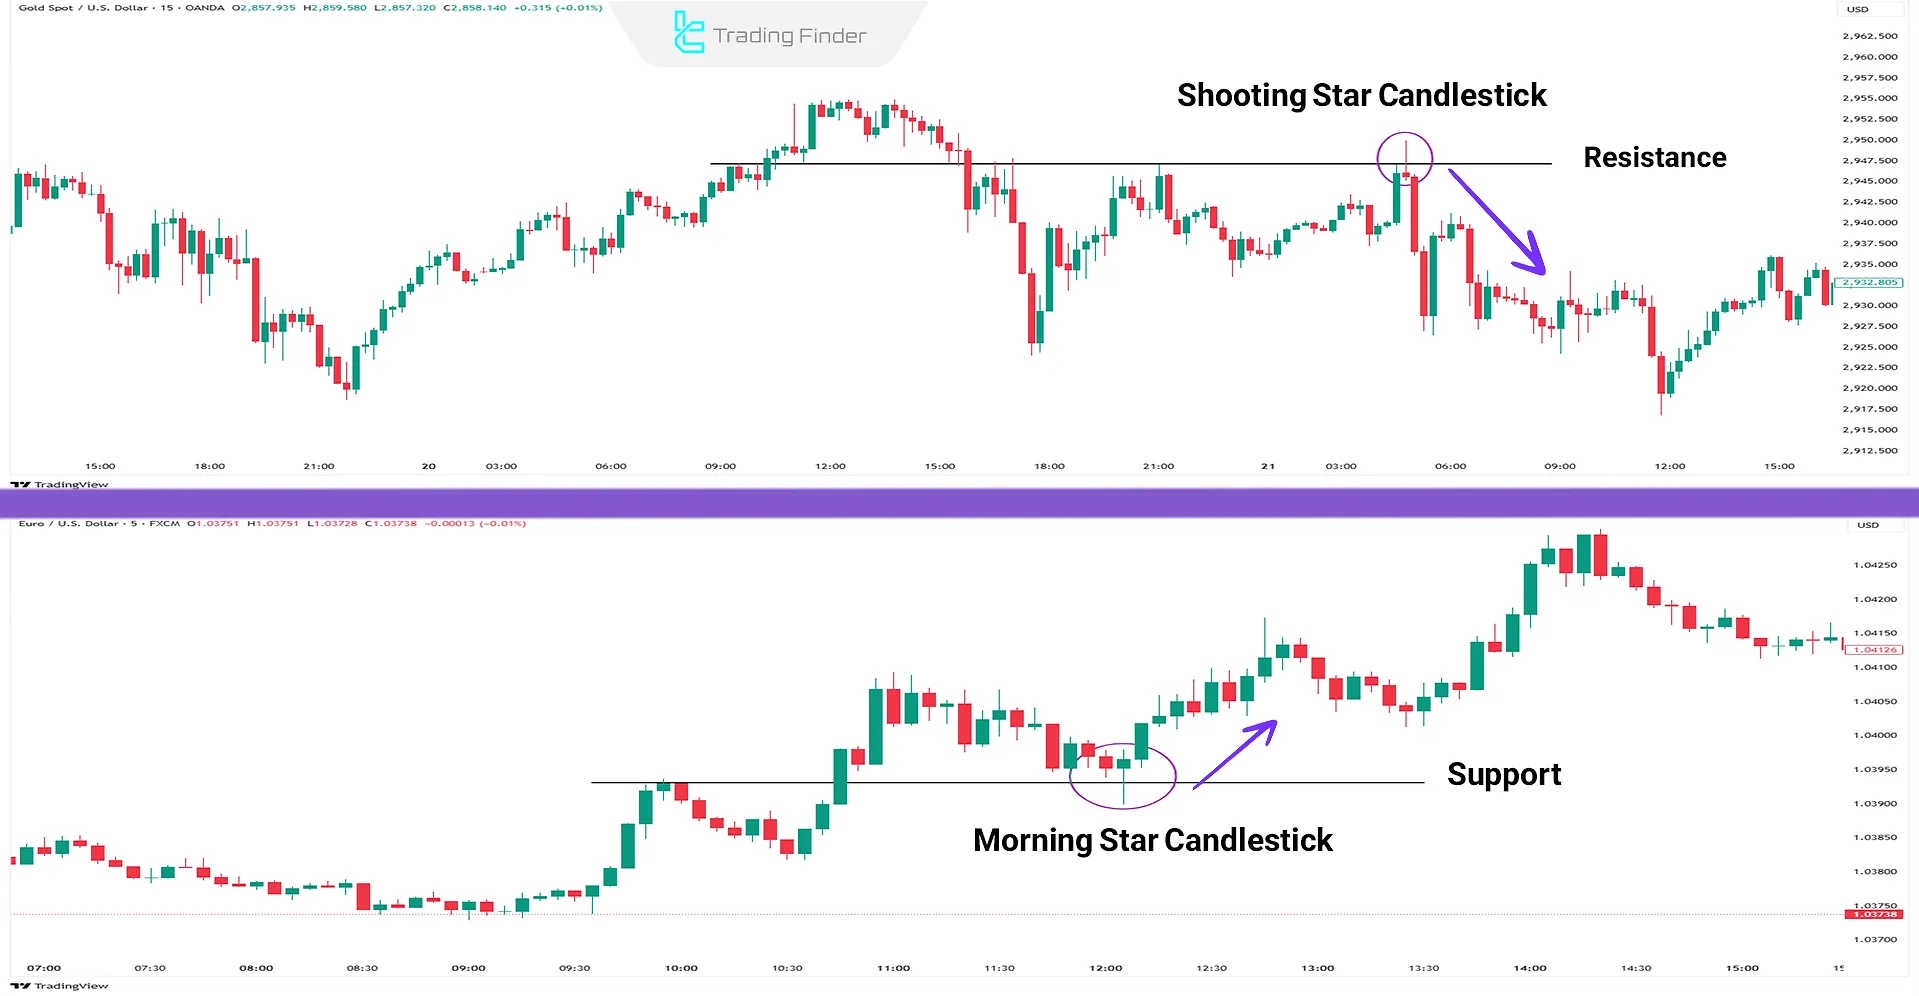
Among the commonly used patterns are the Shooting Star, Hammer, and Hanging Man candlesticks, whose formation at key levels can serve as a valid entry signal.
Candlestick patterns in these zones are typically divided into two main categories:
- Reversal Patterns
- Breakout Patterns
Both types define price movement direction at key market levels and play a decisive role in trading.
Types of Reversal Candlesticks
Reversal candlestick patterns on the price chart come in various forms, but the most important ones include the following:
- Hammer: Forms atsupportlevels with a long lowershadow and a smallbody at the top;
- Morning Star: A candlestick with a small Candlestick Body and Wick on both sides, usually appearing at support levels; this pattern signals a price bottom (the candlestick body does not overlap with the bodies of the candlesticks on its left and right);
- Pin Bar: Appears at supports and resistances, featuring a long shadow and a small body(Pin Bars may have or lack small shadows on the body side);
- Shooting Star: Forms at resistances, with a shadow at least twice the body size, considered a sign of potential price decline. The Shooting Star Pattern is considered one of the strongest reversal candlesticks.
These patterns are most reliable when formed at significant Support and Resistance levels and aligned with other technical analysis elements.
Comparison Table of Reversal Candlestick Patterns:
Features | Hammer | Morning Star | Pin Bar | Shooting Star |
Type and Formation | Single candlestick; at support | Three candlesticks; at support | Single candlestick; support/resistance | Single candlestick; at resistance |
Structure | Long lower shadow, small body | Strong bearish + small candlestick + strong bullish | Long shadow on one side, narrow body | Long upper shadow, small body |
Signal Strength | Medium to strong with confirmation | Strong, momentum reversal | Strong in OB or key levels | Medium to strong at resistance |
Entry and Stop-Loss | Entry after close; stop below shadow | Entry after third candlestick; stop below second candlestick | Entry opposite shadow direction; stop behind shadow | Entry after close; stop above shadow |
Breakout Candlestick Patterns
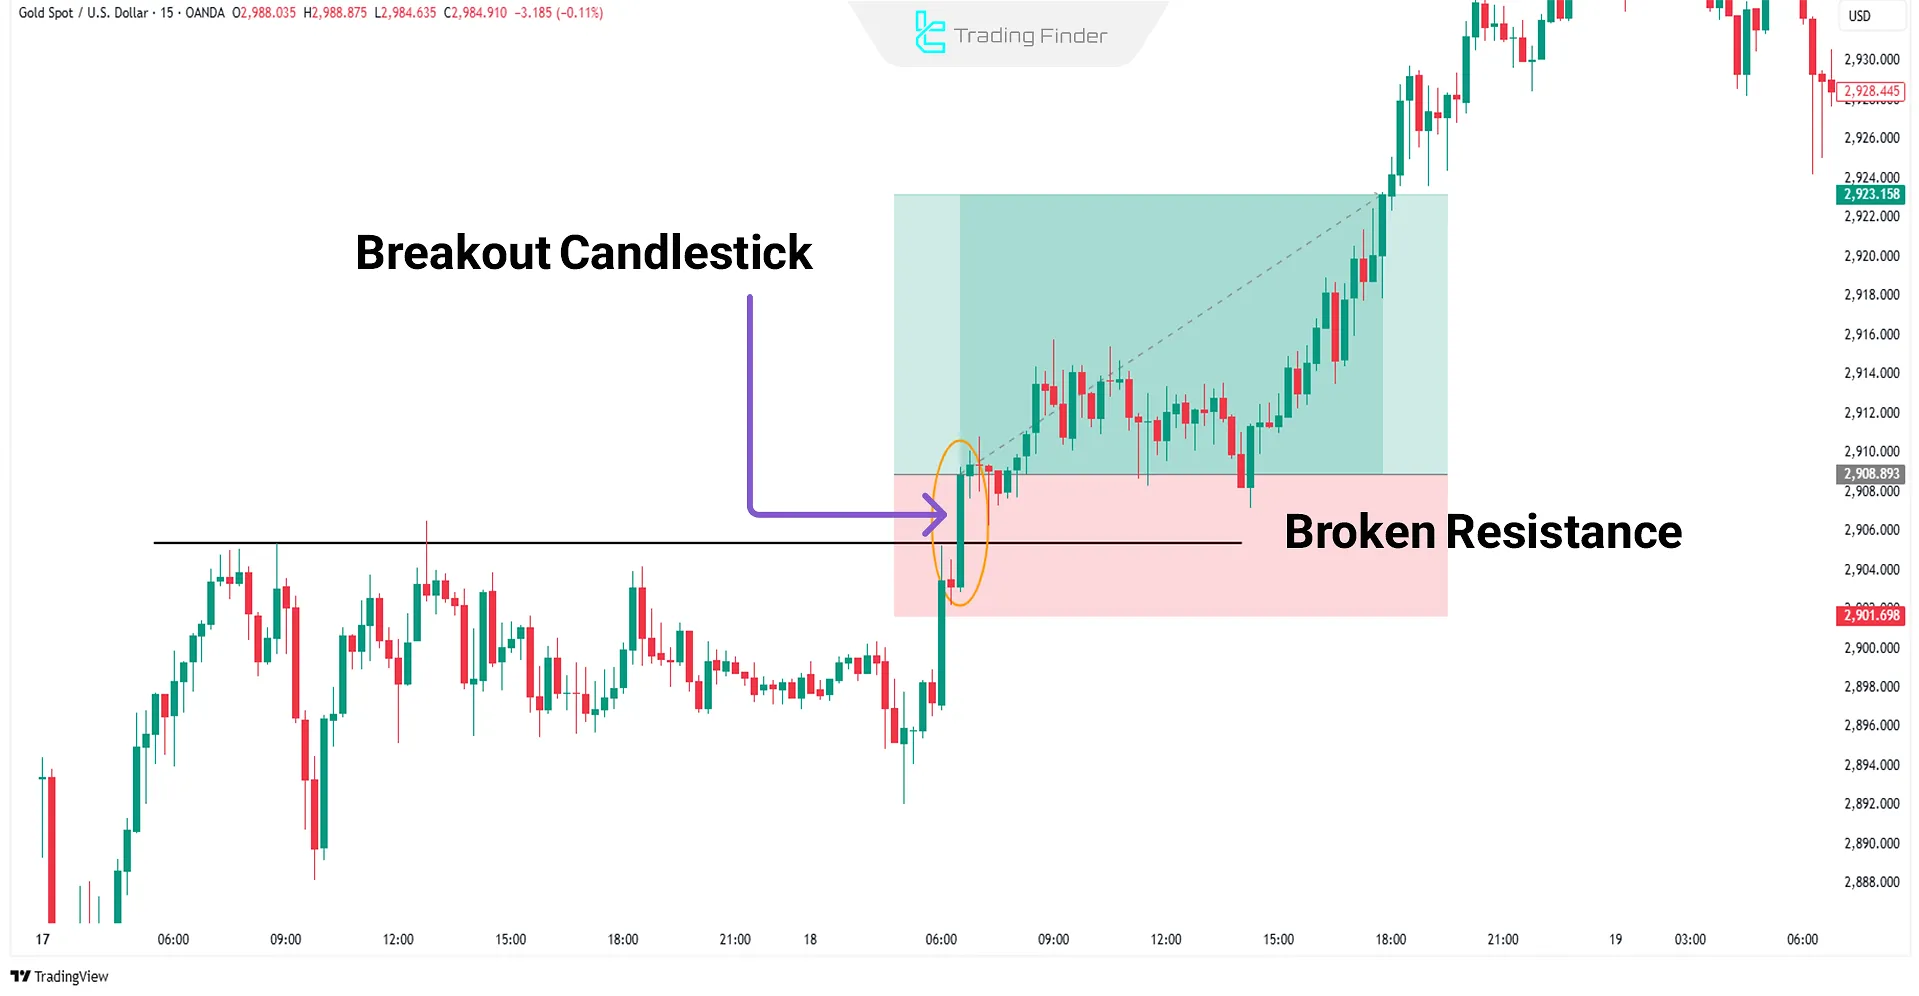
Breakout candles feature large bodies and small shadows, typically appearing when supports or resistances are broken. These candles act as breakout signals and effectively reflect trend strength.
A prime example is the Marubozu candlestick, which has a full body without shadows. This candlestick indicates a strong and clear market trend movement.
Breakout Candles often emerge with large bodies and short shadows at the moment price breaches Support or Resistance zones, signaling the dominance of a trend and confirming the breakout'sstrength.
Types of Support and Resistance Levels
Key technical analysis levels are divided into three main categories:
- Static Levels: Horizontal support and resistance areas formed based on specific and stable price thresholds;
- Dynamic Levels: Sloped support or resistance zones derived from connecting consecutive highs and lows, usually represented by trendlines;
- Dynamic and Static Confluence Zones (Potential Reversal Zone – PRZ): The combination of dynamic and static levels, offering the highest reliability for trading decisions.
Beginner traders see levels as simple lines, while professional traders understand them as zones of liquidity accumulation and shifts in market power balance.
Comparison Table of Support and Resistance Levels:
Type of Level | Basis of Formation | Features | Risks and Common Errors | Professional Application |
Static Levels | Historical highs and lows, horizontal support/resistance | Simple, clear, strong psychological reference point | False breakouts due to liquidity absorption behind levels | Used as initial reaction zones and for recording price behavior |
Dynamic Levels | Moving averages, trendlines, channels | Changes with trend, flexible | Highly unreliable in ranging markets | Used in strong trends as dynamic support/resistance |
PRZ Levels (Static + Dynamic Confluence) | Convergence of horizontal level with dynamic tools (MA, trendline) | Strong zones, multi-dimensional confirmation | Ignoring volume and liquidity can lead to deception | Best entry/exit points; highest validity when combined with market structure |
How to Identify Support and Resistance Zones?
Several tools are used to detect Support and Resistance Zones, but the two most common methods are:
- Identifying Major Highs and Lows
- Using Moving Averages
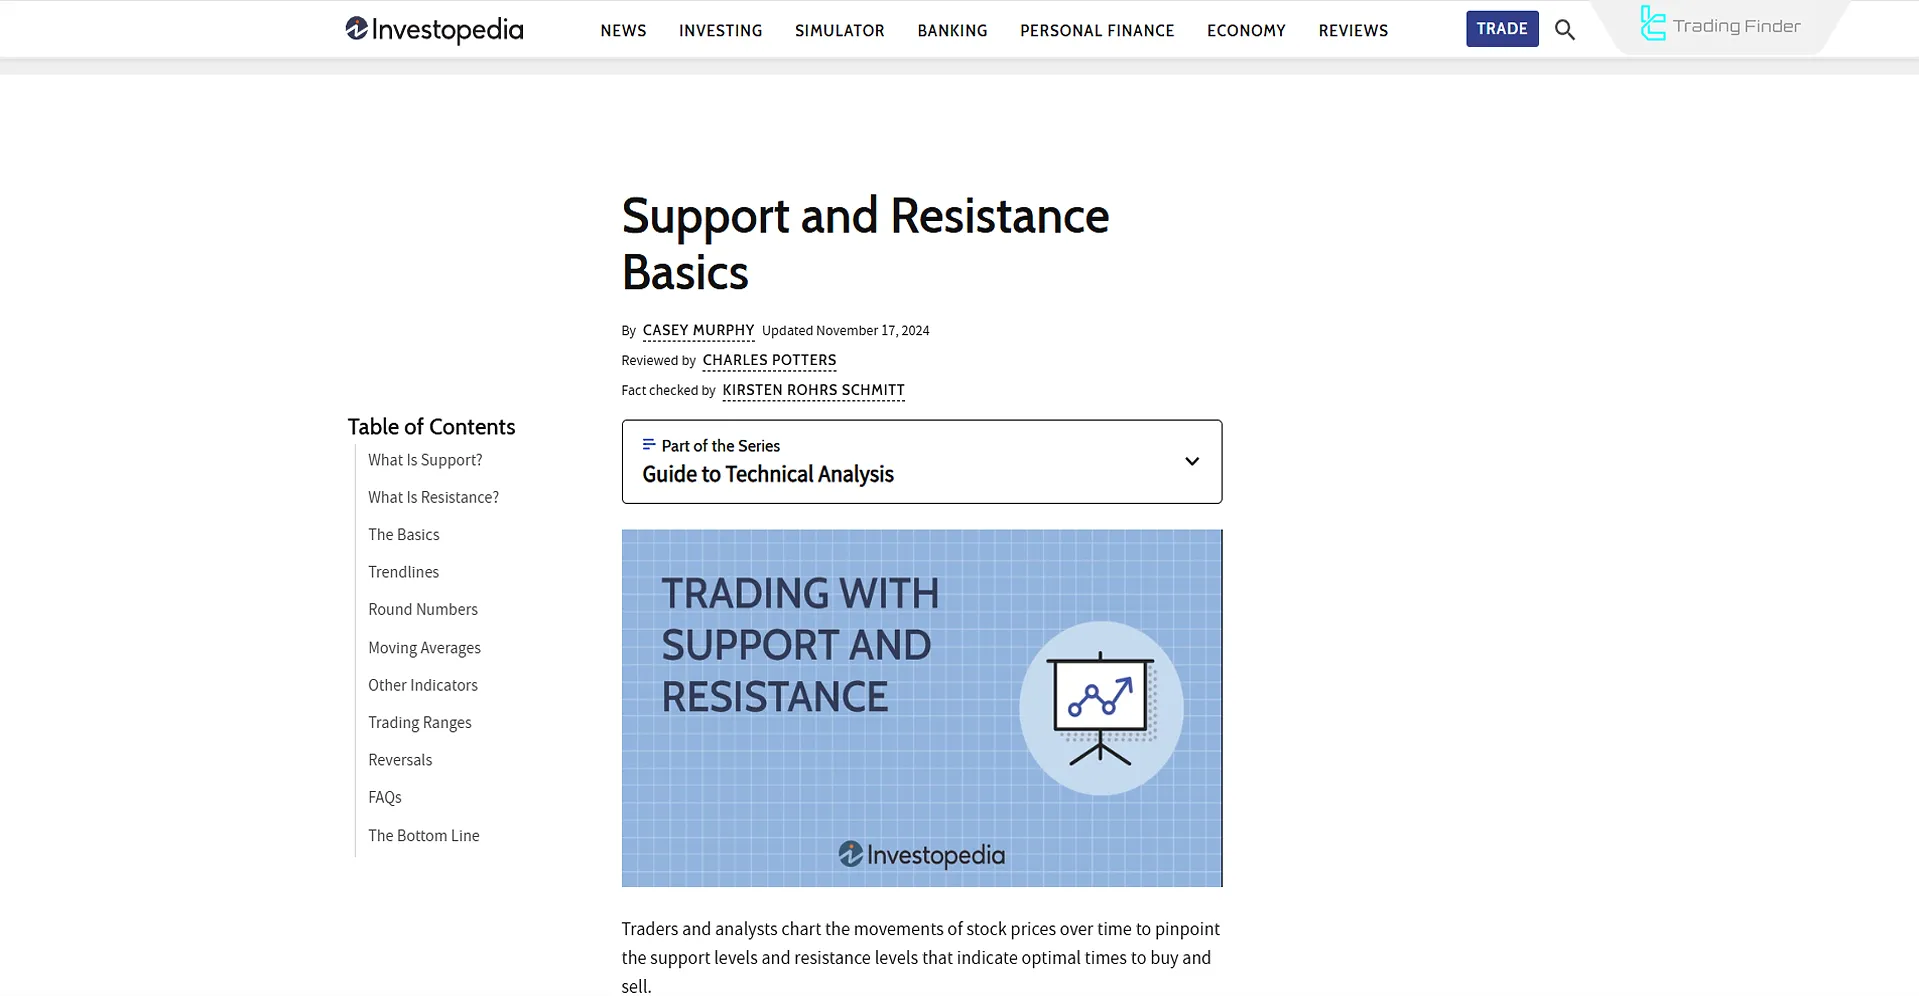
Beginner traders can also use the article on basic support and resistance education from investopedia.com.
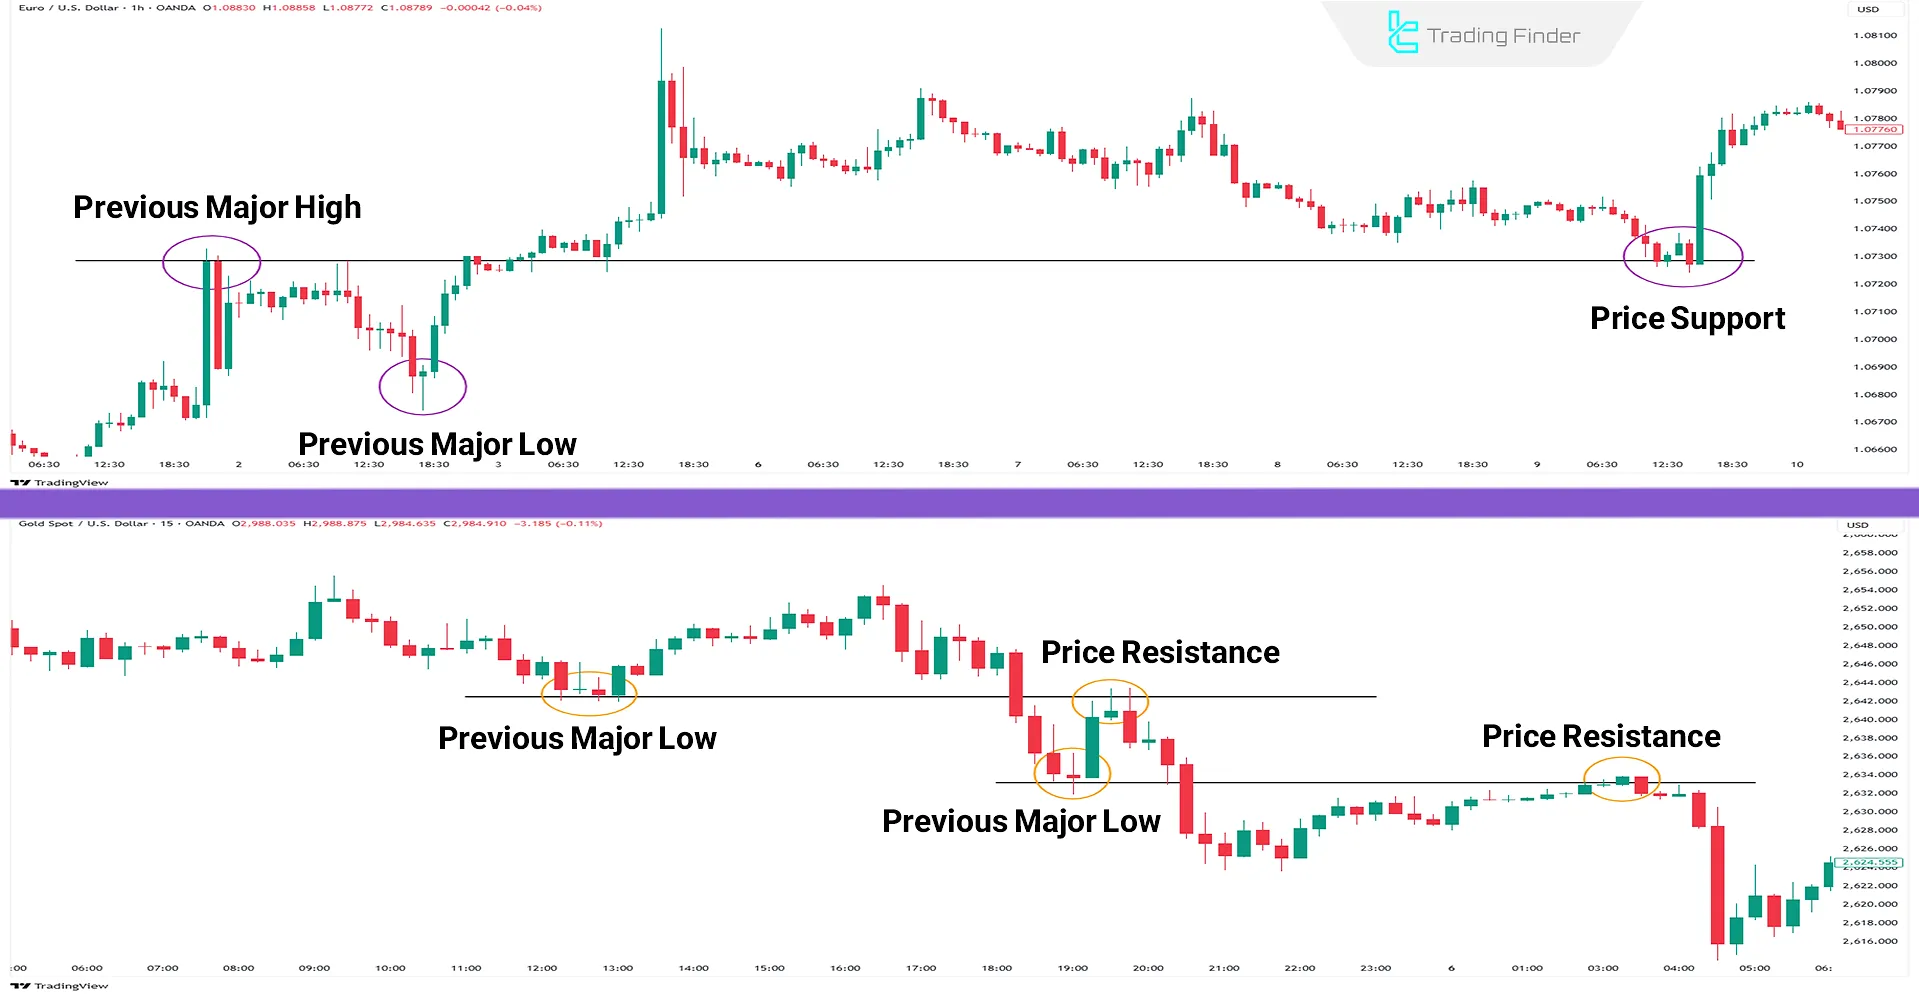
Identifying Major Highs and Lows
Major Highs and Lows are areas within a trend structure where the largest volumes of orders are placed, typically leading to pricereversals.
These zones mark where market sentiment shifts, where positions are reloaded, or closed; therefore, using Candlestick Patterns in Support and Resistance at these zones provides valuable entry opportunities.
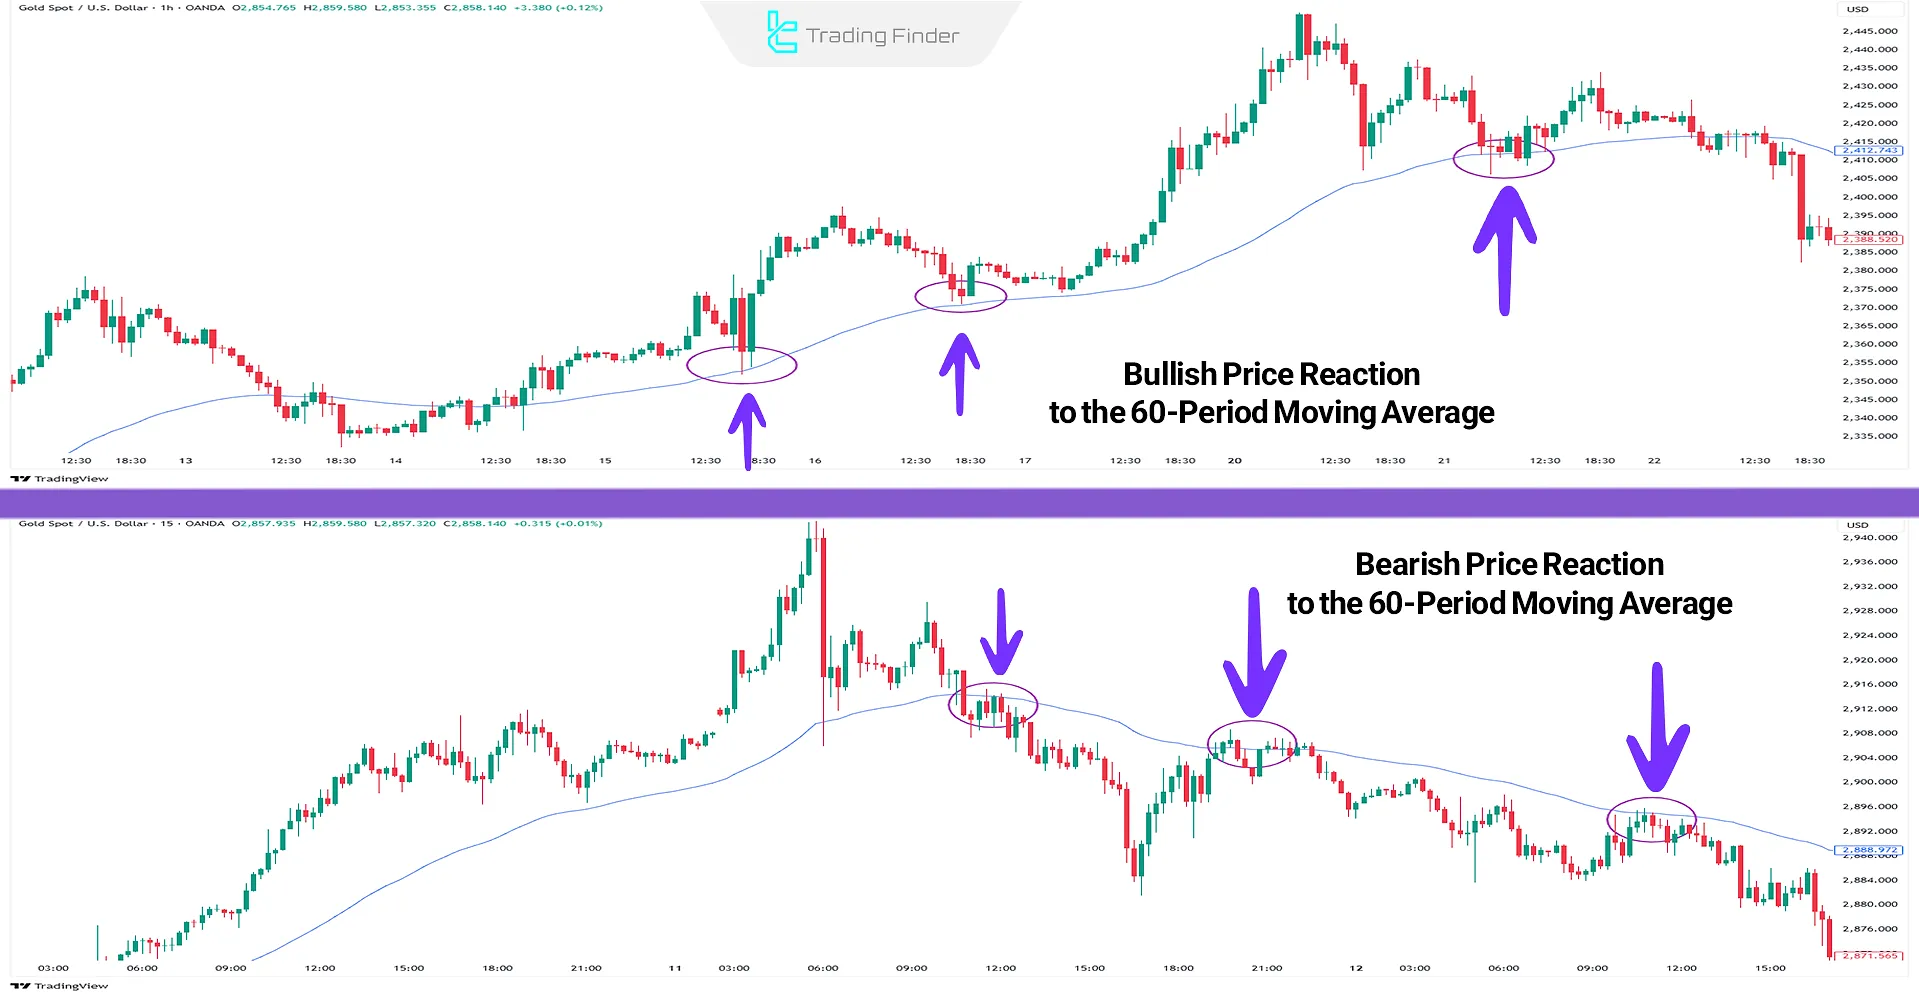
Using Moving Averages
Although Moving Averages are not perfect tools for pinpointing highs and lows, with proper setting of the calculation period, they can become highlyreliable.
For example, by setting the moving average to 60 periods, price reactions appear as lows and highs, which can then be used as a valid diagonal support or resistance zone.
Minor and Major Support and Resistance Indicator
The Order Block Indicator is one of the specialized tools in the ICT and Smart Money approach, widely used on the TradingView platform.
This indicator identifies key market zones recognized as liquidity pools and displays them as bullish (Bullish OB) and bearish (Bearish OB) blocks.
Structure and display of order blocks:
- Bullish OB Boxes: Represent zones that usually form before a strong bullish move and act as support zones;
- Bearish OB Boxes: Represent areas formed before major declines and later serve as resistance zones;
- Major High/Major Low Lines: In addition to displaying blocks, the indicator marks the key highs and lows of the market. These levels serve as references for trend analysis and identifying breakouts or reversals;
- 50% Order Block Zone (Equilibrium Zone): The dashed midpoint line of each block, used by many professional traders for entries or adding to positions, as it offers the best risk-to-reward ratio.
The importance of these zones lies in the fact that they often act as support and resistance levels, and when broken, they signal a Market Structure Shift (MSS) or Change of Character (ChoCH).
Key features of this tool:
It highlights Major High Levels and Major Low Levels with colored lines, enabling more precise price action analysis. The 50% midpoint of order blocks is drawn separately with a dashed line to help identify optimal entry points.
The Order Block Indicator can be applied across different markets such as Forex, cryptocurrencies, stocks, indices, and commodities, making it practical for intraday traders and multi-timeframe analysis. The tool is available for free on the TradingView platform:
The indicator’s settings panel also provides options like Refine Order Blocks for automatic zone optimization and selecting the display of major levels.
In conclusion, the Order Block Indicator on TradingView combines Smart Money and ICT concepts to identify high-potential entry or continuation zones, helping professional analysts achieve more precise risk management in their trades.
How to Trade Using Candlestick Patterns in Support and Resistance
To implement the trading approach using Candlestick in Support and Resistance, follow these steps:
- Identify key Support and Resistance Zones;
- Use of Reversal and Breakout Candlestick Patterns as Confirmation (Validated Candlestick Patterns);
- Define Stop Loss and Take Profit levels based on market structure and price positioning.
Entry Method with Reversal Candlestick Patterns
Entering trades at key zones requires a candlestick confirmation aligned with the market trend. For example, in an uptrend at a support area, a bullish candlestick confirmation is needed.
Similarly, during a downtrend at a resistance area, a bearish candlestick confirmation is required.
For an effective entry at key price zones, receiving a valid Confirmed Candlestick Signal is crucial. Choosing the right confirmation must consider the prevailing market trend:
- In an uptrend: When price reaches a Support Zone, forming a bullish candlestick such as a Hammer or Morning Star signals buying strength and trend continuation;
- In a downtrend: When price hits a Resistance Zone, forming a bearish candlestick like a Shooting Star or bearish Pin Bar indicates selling pressure and potential price decline.
Selecting the proper candlestick confirmation according to market conditions is vital for a high-quality trade entry.
How to Trade Support and Resistance Breakout Strategy Using Candlestick Patterns?
When price breaches a Support or Resistance level with a strong, full-bodied candle (Full-bodied Candle) and closes beyond it, conditions are set for entering a trade in the breakout direction.
Characteristics of a validBreakout Candle:
- A large body with minimal shadows, indicating strong market decision-making and dominance by buyers or sellers;
- Candle closure beyond the key zone, confirming the breakout;
- Preferably appearing on medium or higher timeframes for greater move validity.
Such setups usually indicate structural changes and the beginning of a newtrend movement.
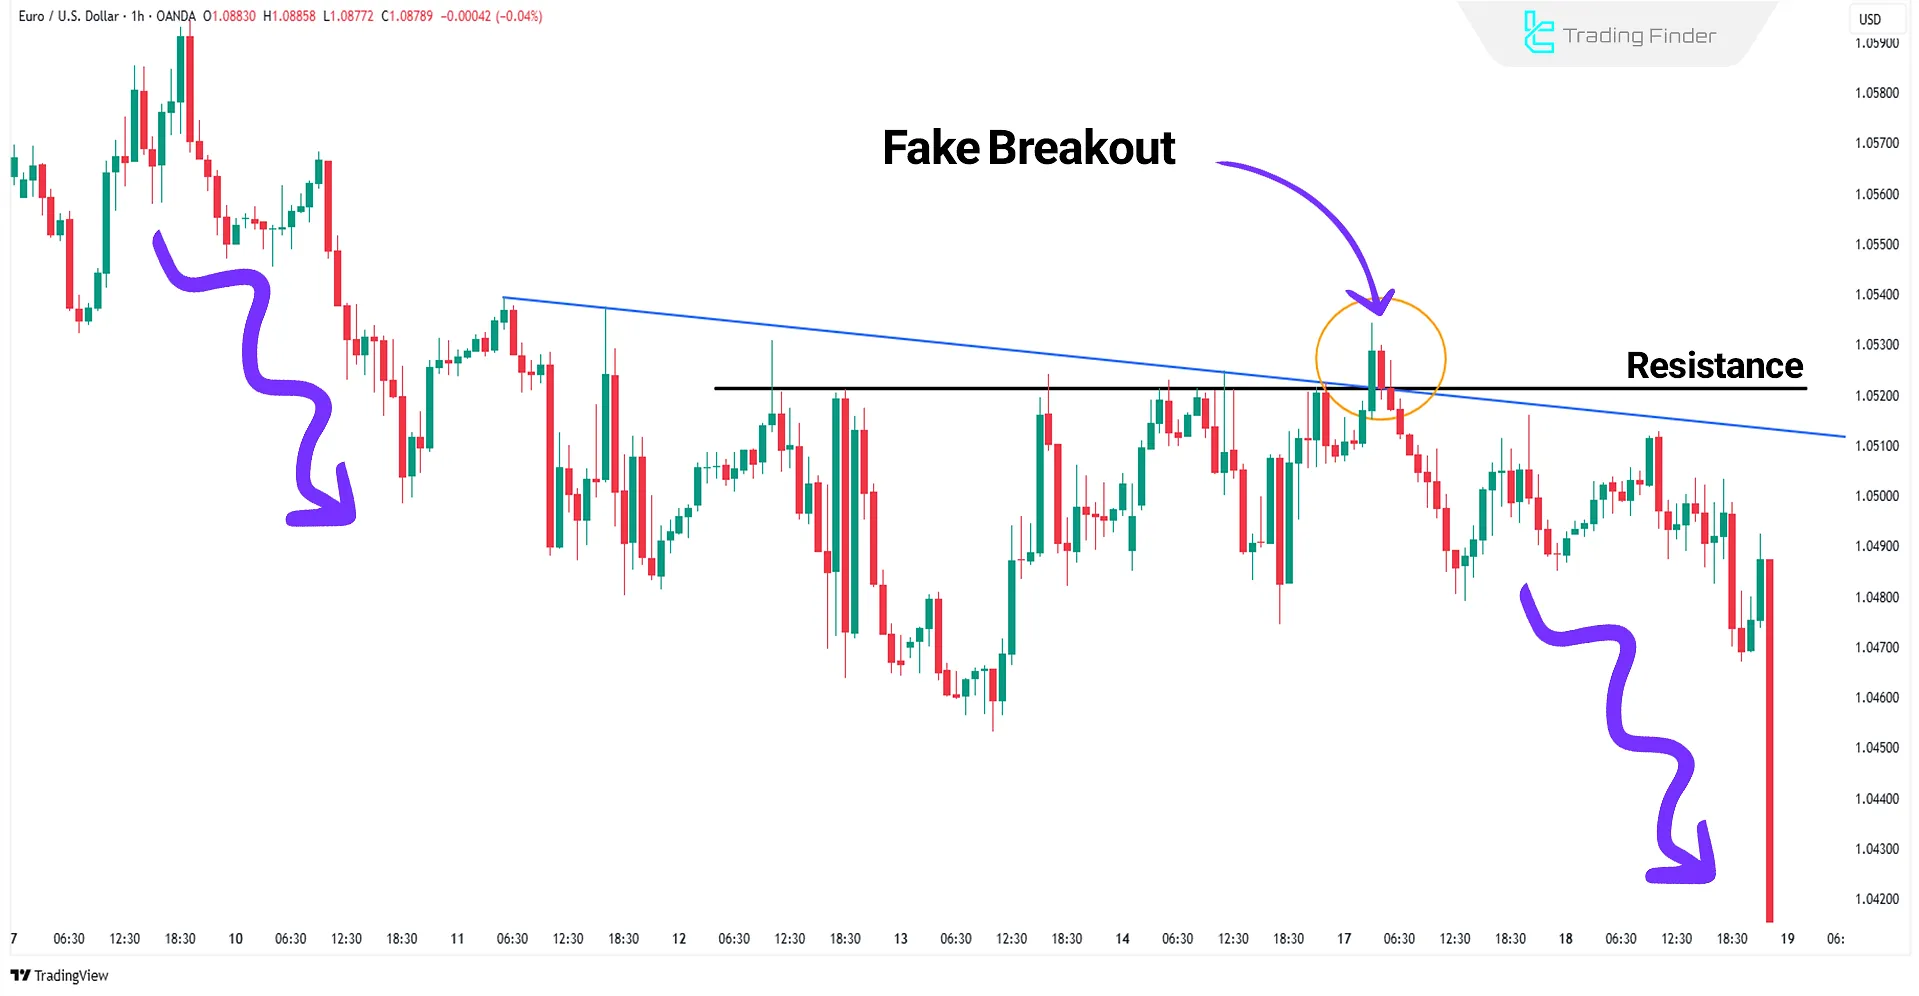
Fake Breakouts
Fake Breakouts are structural market phenomena where price quickly reverses after initially breaching a key level like Support or Resistance.
This move often traps early retail traders and triggers their stop-losses (Stop Loss Orders). In many cases, major market players like Market Makers engineer these fake breakouts to gather liquidity (Liquidity Pools).
They absorb liquidity with a false breakout before driving price back into the original market direction. Understanding fake breakouts plays a crucial role in advanced Price Action and validating real breakouts.
The Role of Candle Wicks in Liquidity Grabs (Liquidity Grab)
Long wicks in candlestick patterns are not merely signs of market excitement; in many cases, they reveal the mechanism of liquidity absorption by Liquidity Providers (LPs) and financial institutions.
Application of wicks in support and resistance:
- At supports: Long bearish wicks below the support level indicate the activation of stop-losses from early buyers, and after liquidity is absorbed, the market bounces upward;
- At resistances: Long bullish wicks above the resistance level hunt sellers’ stop-losses and create conditions for institutions to enter short positions.
In the video Liquidity Grab Strategy in Smart Money Style on the Mind Math Money channel, the role of candle wicks in liquidity grabs is clearly demonstrated:
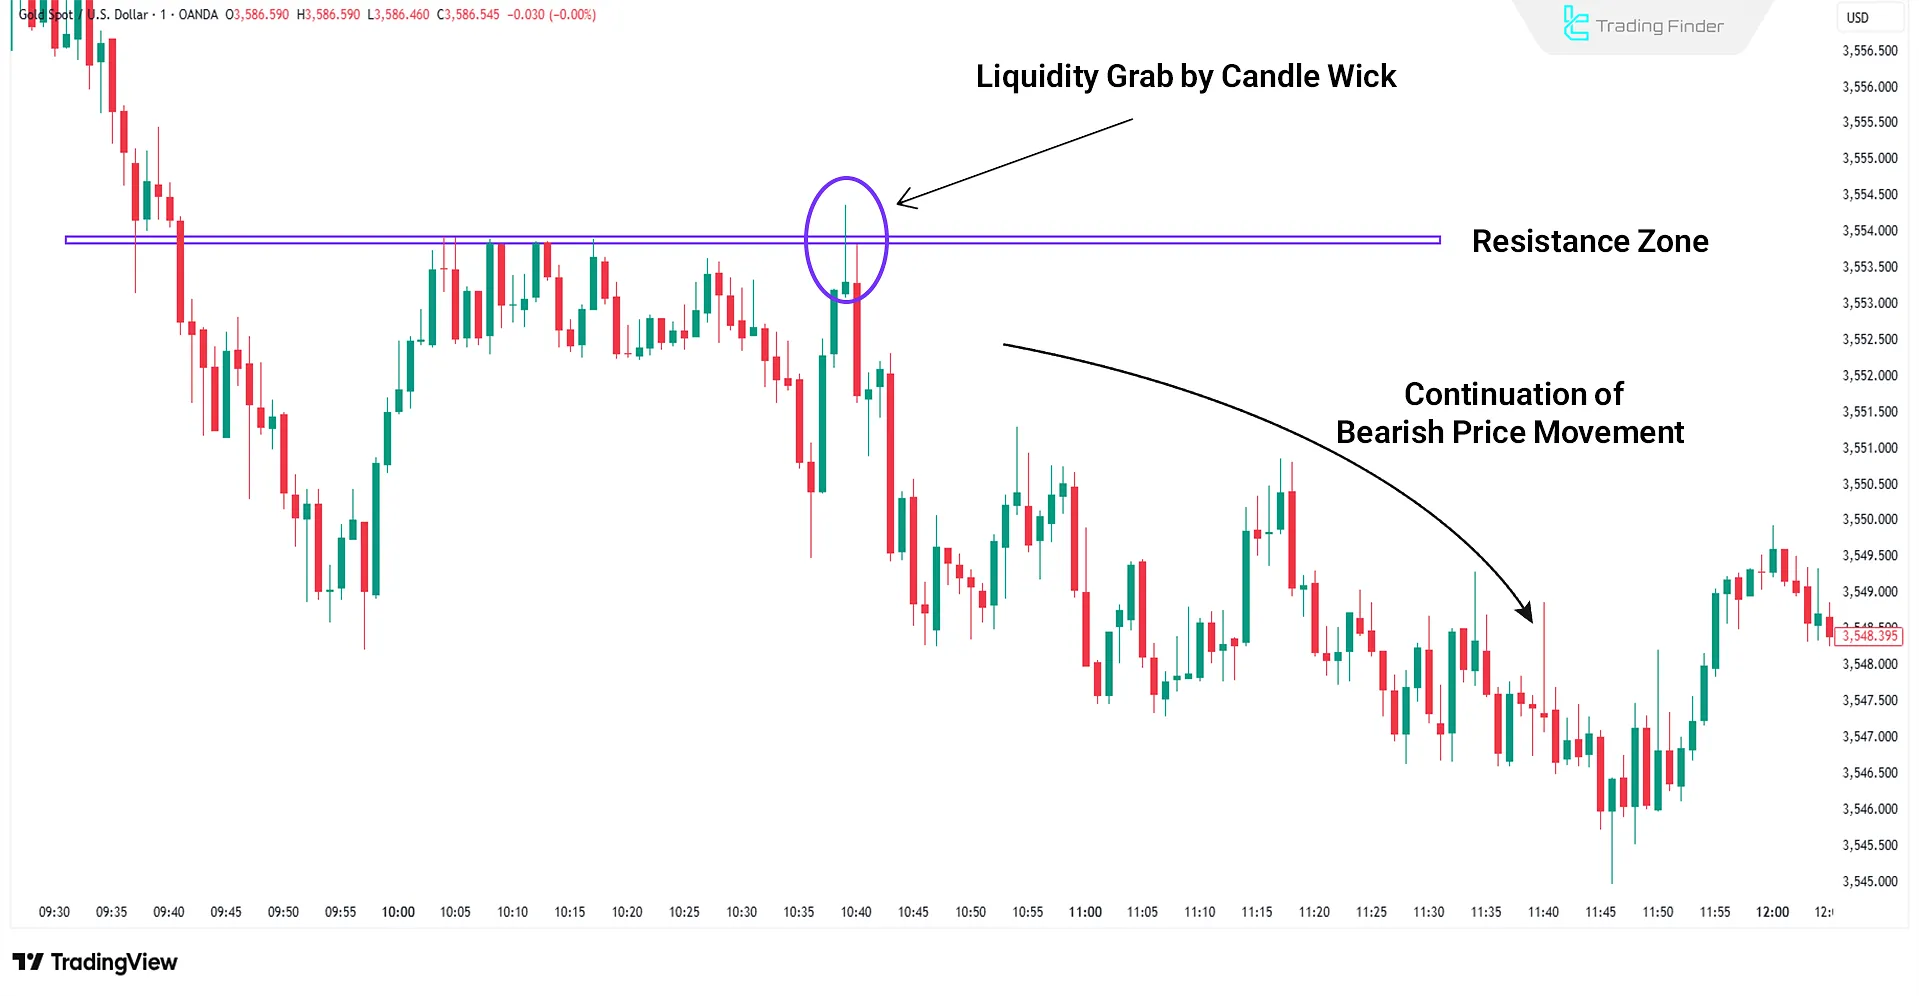
Example of liquidity grab with candle wicks in support and resistance zones
The gold chart in the one-minute timeframe was in a downtrend, which, after a move upward and a liquidity grab behind the resistance zone, continued its bearish movement.
This liquidity grab appeared as a shadow or candle wick on the chart.
Note: Liquidity hunts at support and resistance zones are usually carried out by candle wicks.
Setting Stop Loss When Trading Support and Resistance
In trades based on Candlestick with Support and Resistance, the permission to enter depends on the confirming candle. If price touches the support level of the confirming candle, it suggests weakness and potential invalidation of the level.
Thus, the best place for setting the Stop Loss is just beyond the confirming candle, with slight extra margin to account for minor fluctuations or market spread.
Setting Take Profit When Trading Support and Resistance
To determine the Take Profit, traders can use upcoming Support or Resistance zones. Additionally, spotting reversal candlestick patterns against the trade direction can prompt early exits.
Two main strategies:
- Using future support/resistance levels: Natural targets for completing the move;
- Spotting opposite reversal patterns: Reversal signals appearing along the path justify earlier profit-taking.
Combining both methods help protect trading gains against sudden price reversals.
Candle Wicks in Trading Sessions and Killzones
In different trading sessions such as London, New York, and Tokyo, the length and position of candle wicks can reveal where liquidity has been absorbed and which zones have gained support or resistance roles.
Combining wick analysis with Killzones provides a clearer picture of market structure. These time windows represent the moments when the main liquidity flow enters the market, and candle wicks often act as signals of order collection during these periods.
Long wicks in the London Killzone are usually recognized as liquidity hunts, while short wicks in the New York session may confirm trend continuation.
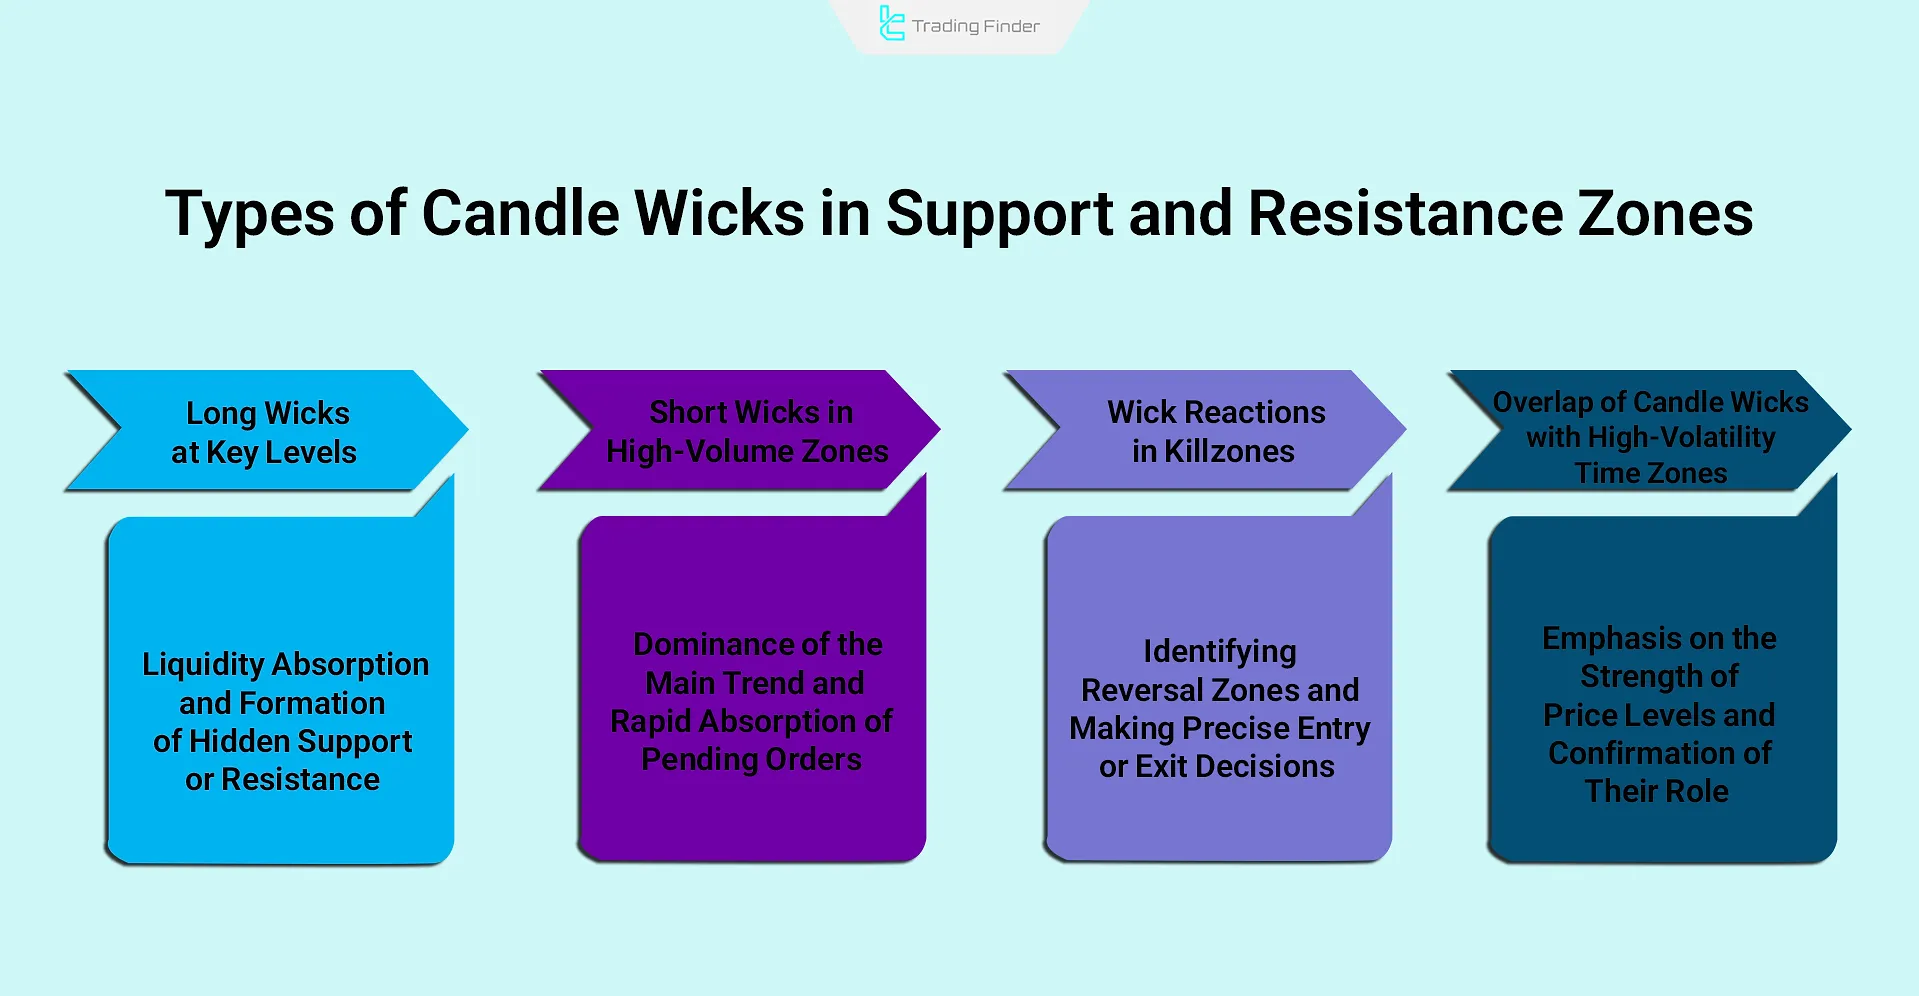
Concept of wick types in support and resistance zones:
- Long wicks at key levels: indicate liquidity absorption and the formation of hidden support or resistance;
- Short wicks in high-volume zones: show dominance of the main trend and quick absorption of pending orders;
- Wick reactions in Killzones: a tool for identifying reversal zones and making precise entry or exit decisions;
- Overlap of wicks with high-volatility time ranges: emphasizes the strength of price levels and confirms their role.
In-depth understanding of wick–Killzone convergence gives professional traders the ability to spot points where the market releases liquidity only once. These zones are where true support and resistance are formed.
Placing stop-loss based on candlestick wicks
Wicks are considered microstructural boundaries of support and resistance. When a candle closes with a long wick, it shows that the market absorbed liquidity at that level and then pushed the price in the opposite direction.
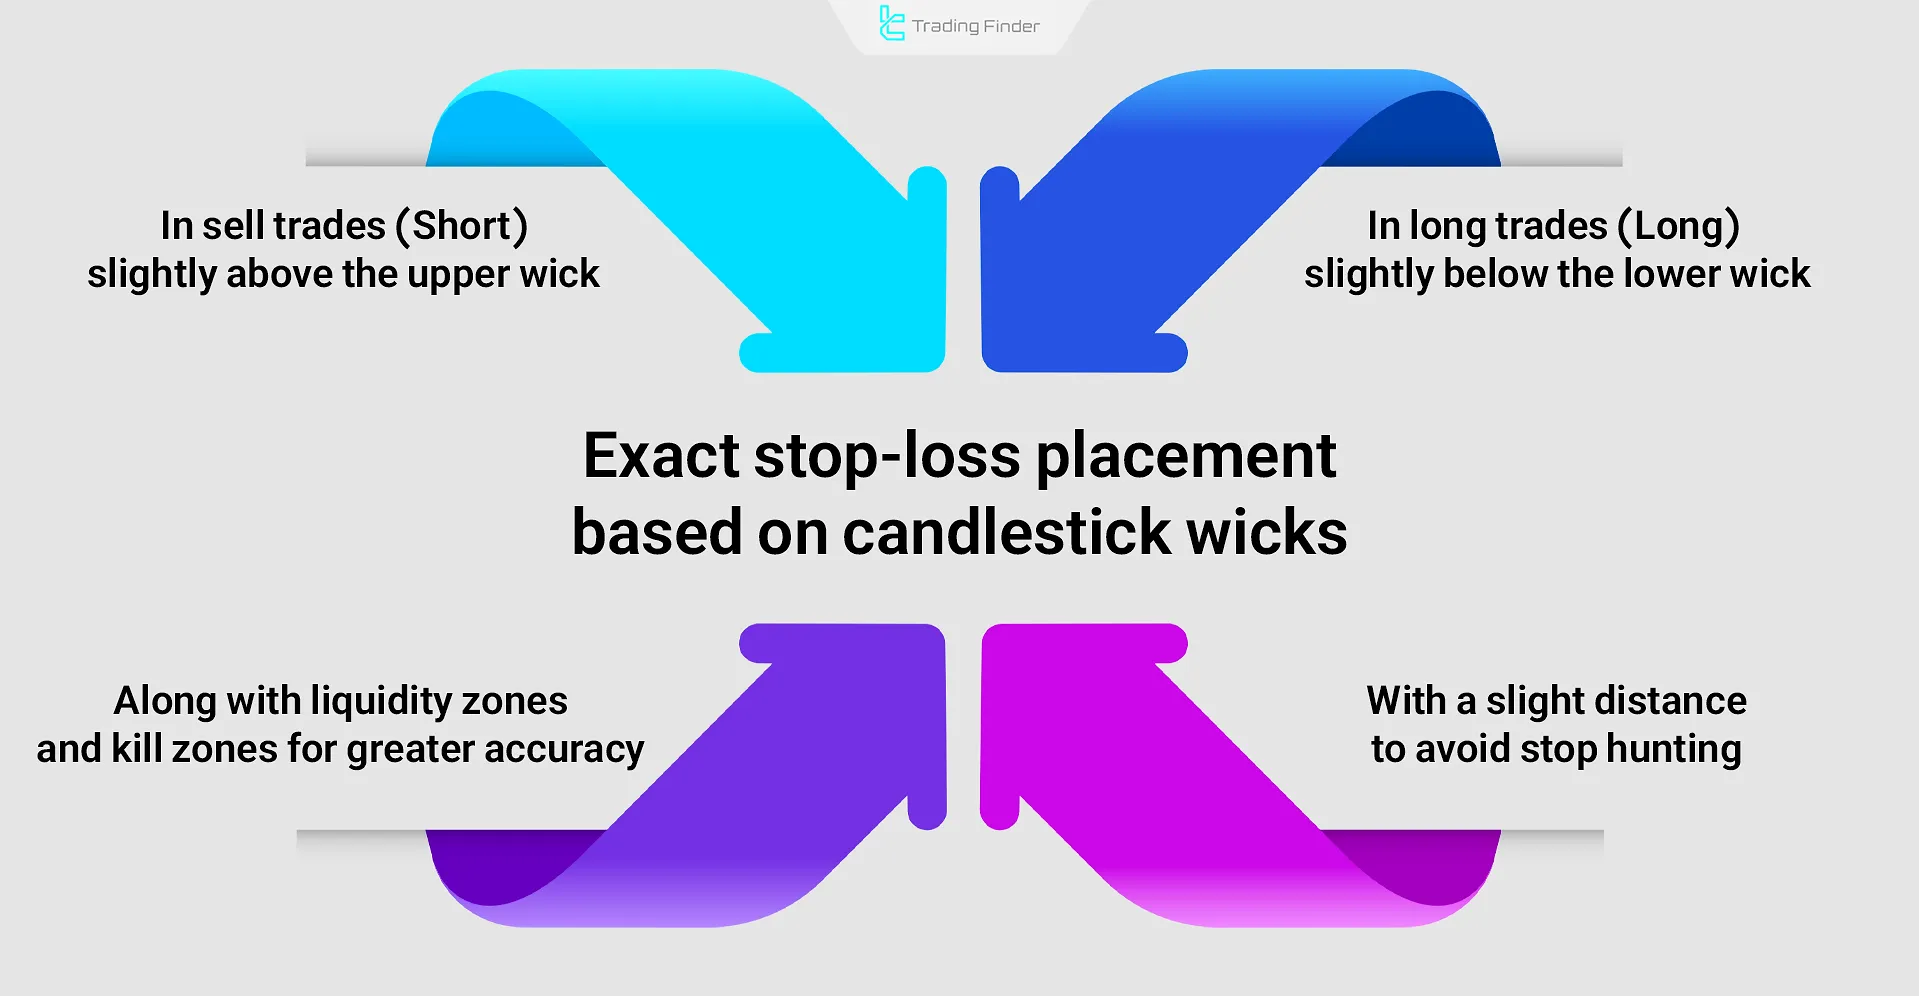
In such cases, the stop-loss should not be placed exactly at the tip of the wick but slightly below lower wicks (in long positions) or slightly above upper wicks (in short positions) to leave room for natural volatility.
Stop-loss placement rules based on candlestick wicks:
- Stop-loss below the lower wick in a Long Position;
- Stop-loss above the upper wick in a Short Position;
- Small distance from the wick to avoid stop-hunting by short-term manipulations;
- Combining stop-loss placement with liquidity zones and Killzones for higher accuracy.
Common mistakes in wick analysis
The main challenge in wick analysis is distinguishing between genuine market reactions and deceptive moves caused by hidden liquidity.
Only by combining wick analysis with broader contexts such as support/resistance zones, order flow, and liquidity timing can repetitive mistakes be avoided.
Frequent mistakes in candlestick wick analysis:
- Relying on a single candlestick without considering the broader market structure;
- Ignoring higher timeframes and analyzing wicks only on short-term charts;
- Placing stop-loss exactly at the tip of the wick, getting triggered by liquidity manipulation;
- Incorrect assumption that every long wick necessarily signals a trend reversal;
- Overlooking wick confluence with Killzones and trading sessions;
- Using wicks as standalone signals without combining them with volume and market structure.
Important Notes on Using Candlestick Patterns in Support and Resistance
To improve the Win Rate when trading Candlestick Patterns in Support and Resistance, it's vital to observe these rules:
- Decreased Level Credibility: Each repeated touch reduces a level’s strength and increases its likelihood of breaking;
- Role Reversal: After breaking a resistance, it may act as support (and vice versa);
- Importance of Confluence Zones: Candlestick behavior at the confluence of static and dynamic levels provides powerful signals;
- Trending Markets: Candlestick patterns perform better in well-defined trending markets;
- Higher Timeframes: Analyzing on larger timeframes increases pattern reliability and reduces false signals.
Applying these principles significantly improves analysis accuracy and entry point quality.
Conclusion
Mastering the behavior of candlestick patterns near Support and Resistance levels is key for identifying optimal trade entries and exits.
Moreover, combining confirmations like trading volume, structure breakouts, indicator overlaps, and multi-timeframeanalysis further boosts trade analysis precision.


