


The double top and double bottom patterns are classified under classic reversal patterns in technical analysis.
These patterns are based on price action behavior and typically appear at the end of uptrends or downtrends. A correct interpretation of these formations helps identify price reversal zones.
What Is a Double Top Pattern?
In technical analysis, the double top pattern usually forms at the end of an uptrend. After a strong bullish move, the price hits a specific resistance level twice, fails to break through, and reverses direction.
The Double Bottomand Double Top patterns in Forex have been explained in a video tutorial on the Mind Math Money YouTube channel:
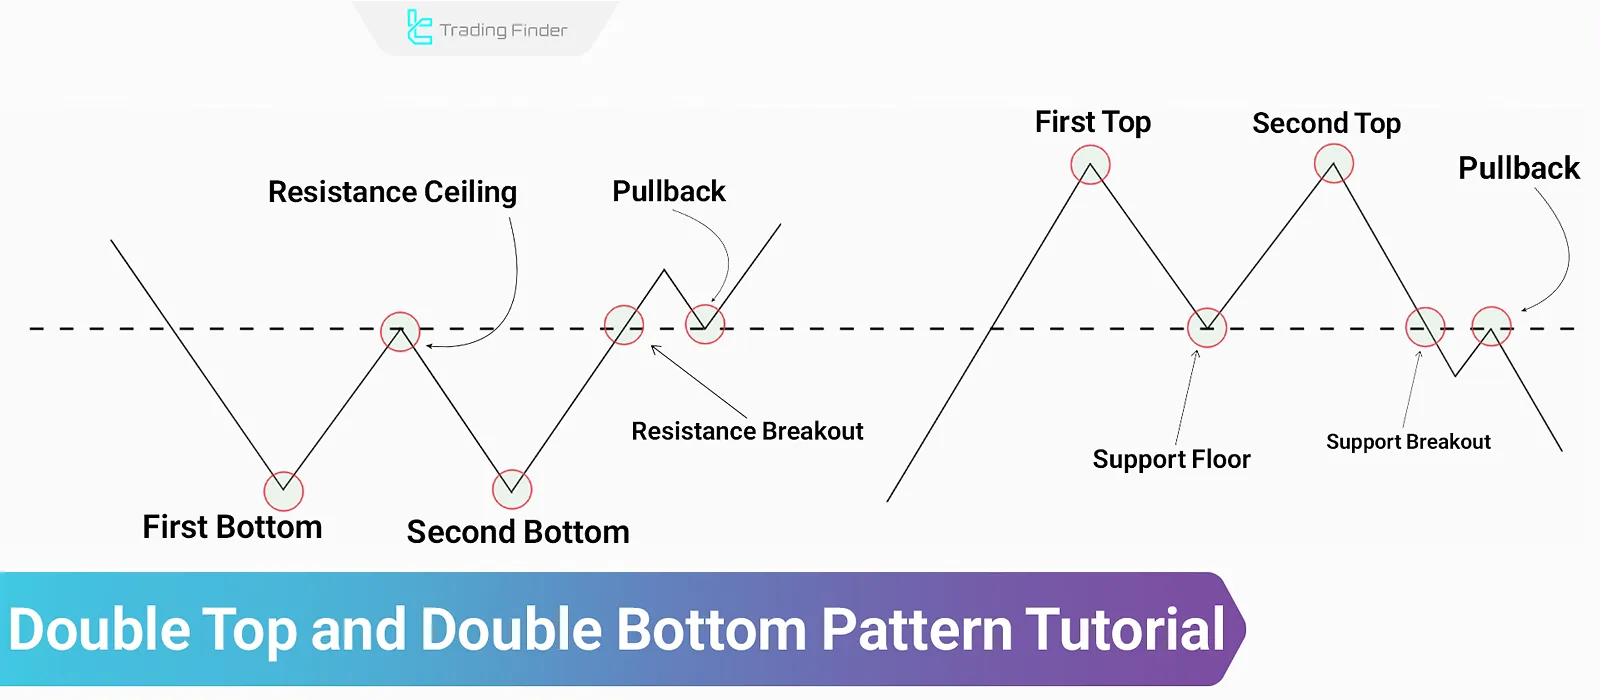
The main components of this pattern aretwo relatively equal highs and a middle valley. The support zone lies at the lowest point between the two tops, and breaking this level signals the start of a bearish trend.
Note: Aslight difference between the levels of the two tops is acceptable in this pattern.
In the article of Learning the double top and double bottom patterns on the Investopedia website, various aspects related to these two patterns are fully explained, and it is recognized as one of the reliable examples of the double top chart pattern.

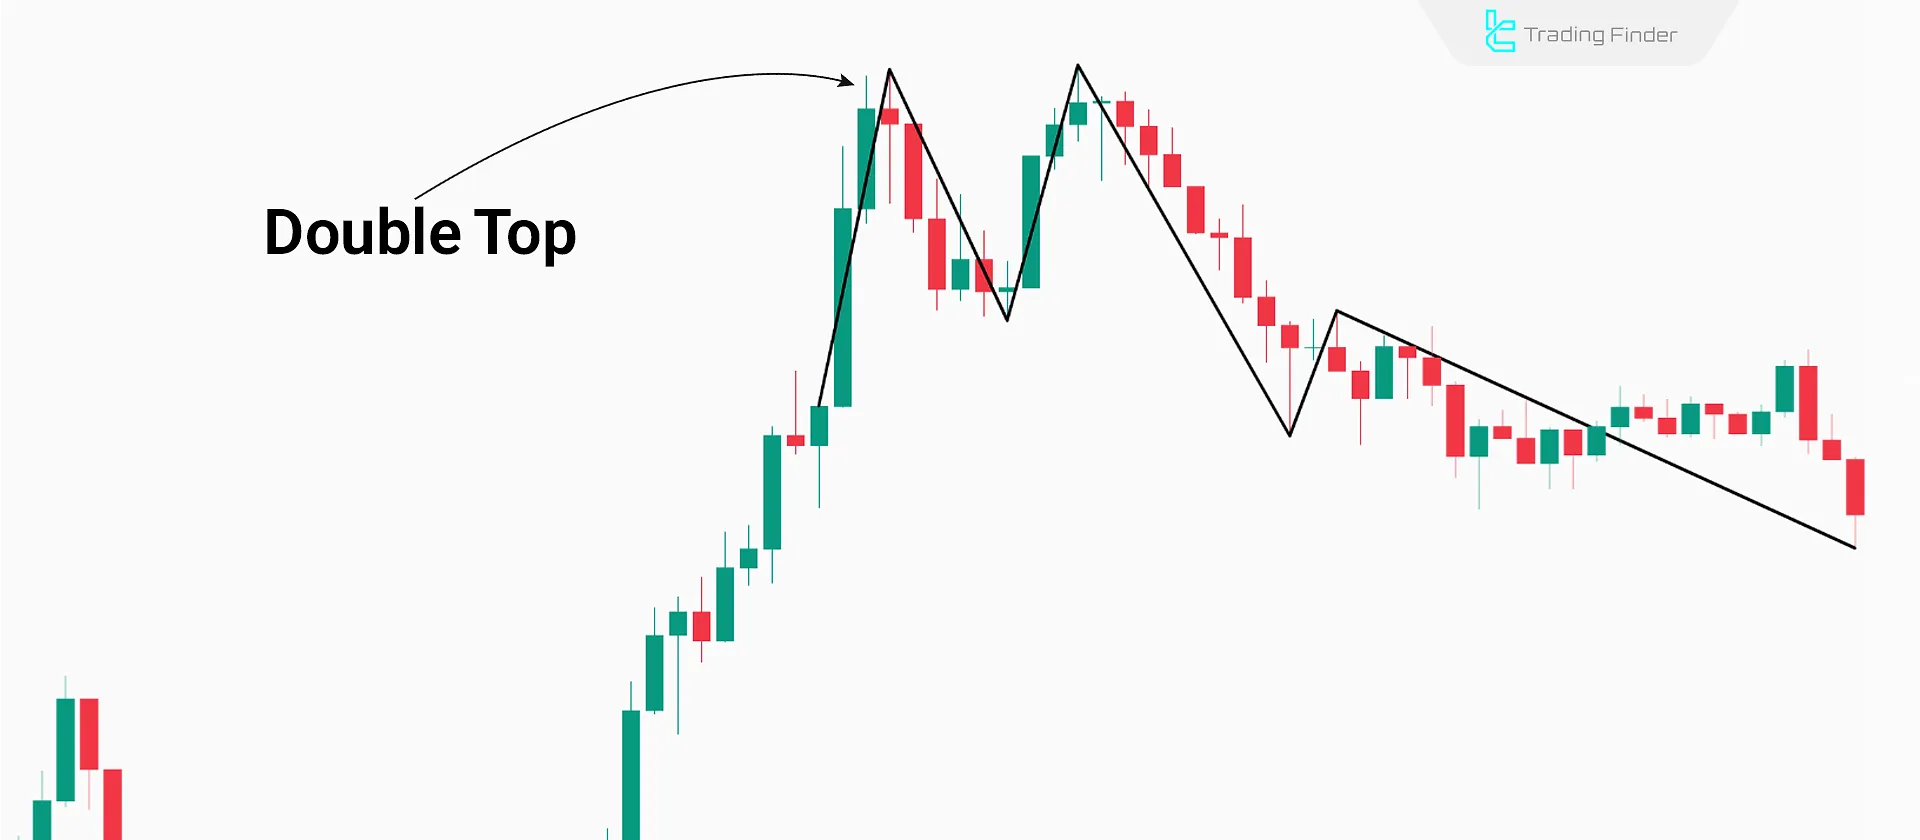
Example of a Double Top Pattern
In this example, after an upward trend, the price faces a correction and then starts another bullish move to surpass the previous level. However, renewed selling pressure causes the price to drop again. At this point, the structure of the double top formation can be clearly seen.
During the new downward move, the resistance level formed during the correction is broken; afterward, the price pulls back to the broken area and continues its decline. This movement represents a double top pullback, which plays a key role in the double top trading strategy.
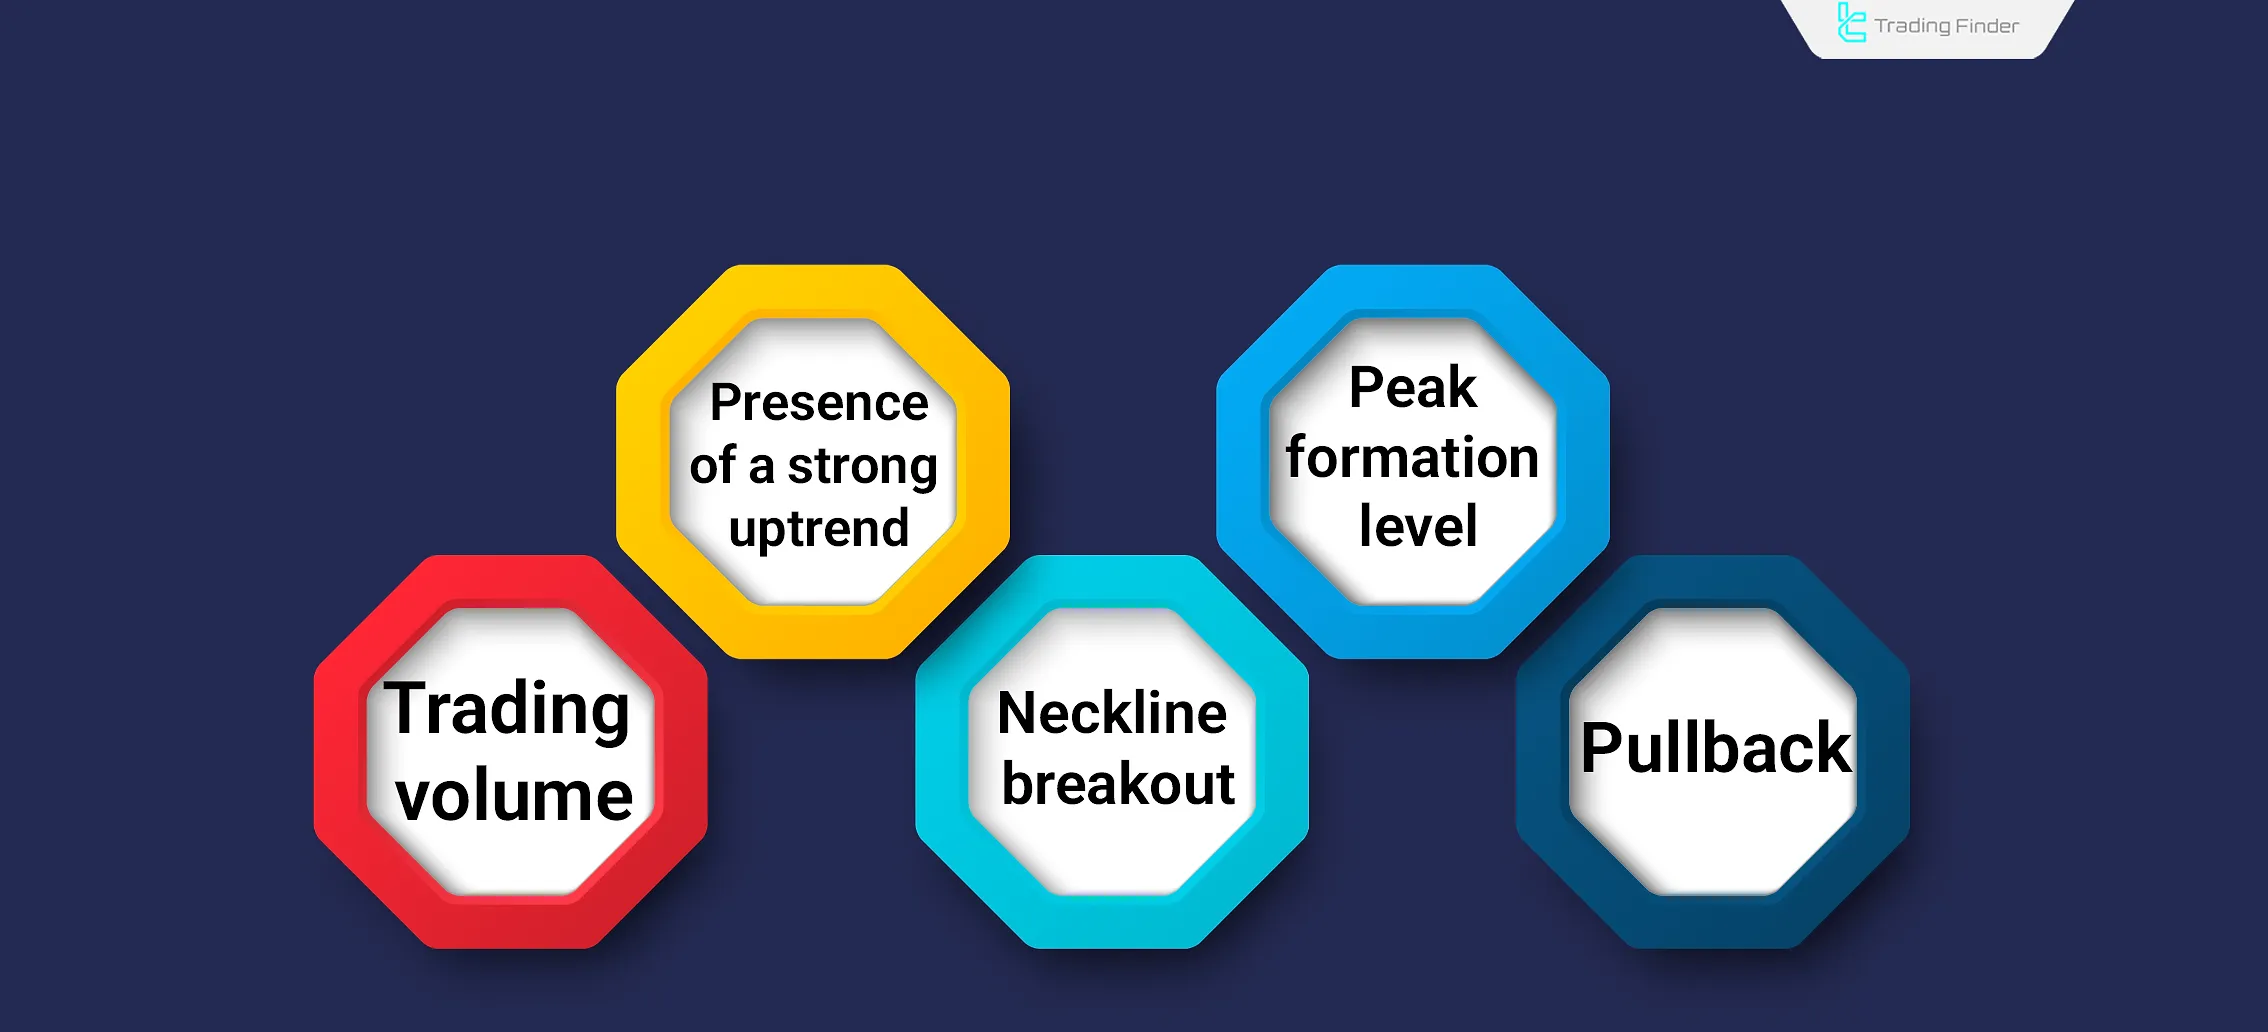
Validating the Double Top Pattern
To confirm the validity of this pattern, several factors related to price movement, trading volume, and other relevant considerations need to be taken into account. These include:
- Strong prior uptrend: The pattern must form after a strong upward movement;
- Top formation levels: The difference between the two peak levels should be minimal, slight variation is acceptable;
- Volume: During the pattern’s formation, volume should gradually decrease. Additionally, the volume at the second peak should be lower than at the first;
- Neckline break: A strong candlestick confirming the break of the support or resistance level is essential;
- Pullback: Formation of reversal candlestick patterns during the pullback to the trendline further validates the trend reversal.
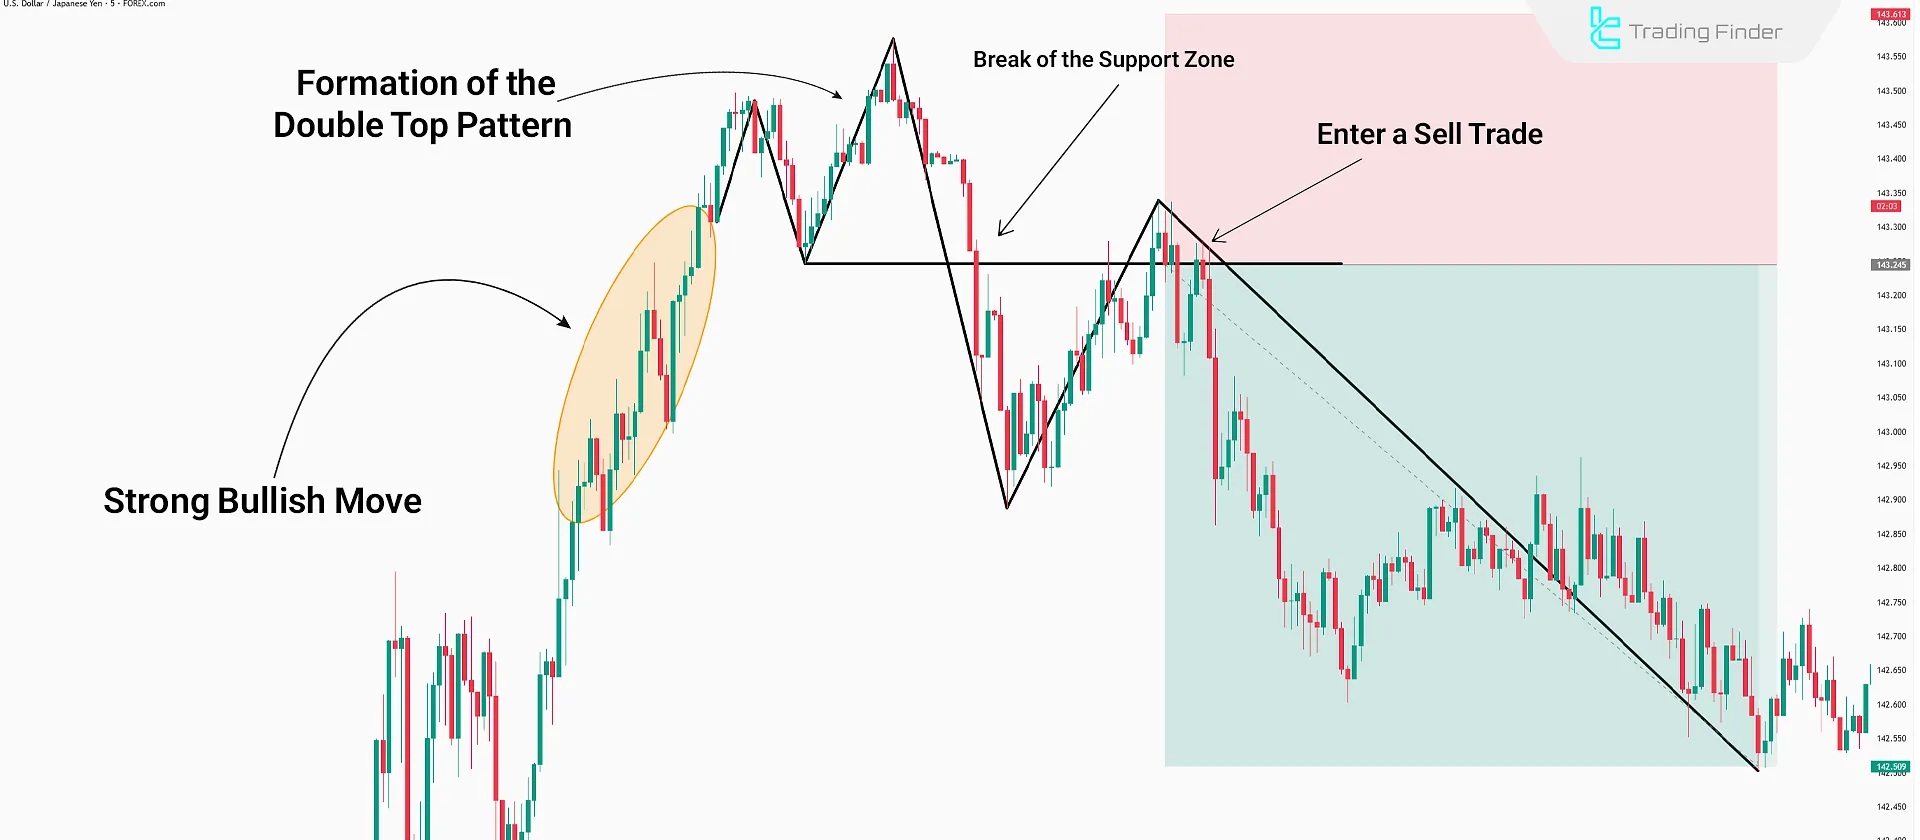
Step-by-Step Guide to Trading the Double Top Pattern
Using the double top pattern requires understanding price structure, volume behavior, and the rules for a valid support level breakout. By analyzing the pattern through price action, a bearish trend reversal can often be anticipated before it fully develops.
To improve the success rate, trading this pattern should adhere to a precise step-by-step process:
#1 Pattern Analysis and Confirmation
Two almost equal highs must form after a strong uptrend to confirm this pattern. A middle valley should exist between the two tops as the support level.
A gradual decline in trading volume during the pattern formation indicates weakening buying pressure, enhancing its validity.
#2 Entry Point
Once the pattern forms, the price tends to move toward the support level. After the breakout of the support, this point becomes the first entry level for the trade.
After a pullback to the broken support (now acting as resistance) and confirmation via a strong candlestick pattern, a second entry point can be considered. This entry is generally more reliable than the first.
An increase in volume during the breakout further validates the pattern and strengthens the trade signal.
#3 Setting a Stop Loss
There are two primary locations for placing the stop loss in this pattern, each offering different levels of risk and reliability:
- The most reliable stop-loss level is just above the second top. Although this position doesn't offer the best risk-to-reward ratio, it reduces the chance of a liquidity hunt;
- The alternative stop is behind the breakout candle, below the support line. This area carries a higher risk of being stopped, but often provides a more favorable risk-to-reward setup.
#4 Trade Management
To manage the trade effectively, monitoring volume activity as the price approaches the target is crucial. The first appropriate take-profit level is measured by calculating the vertical distance between the tops and the support level.
If the momentum remains strong as the price approaches the target, it might be reasonable to keep the trade open until the next support zone is reached.
Depending on the trading strategy, it is also logical to partially close the position ormove the stop loss to the entry point.
What Is a Double Bottom Pattern?
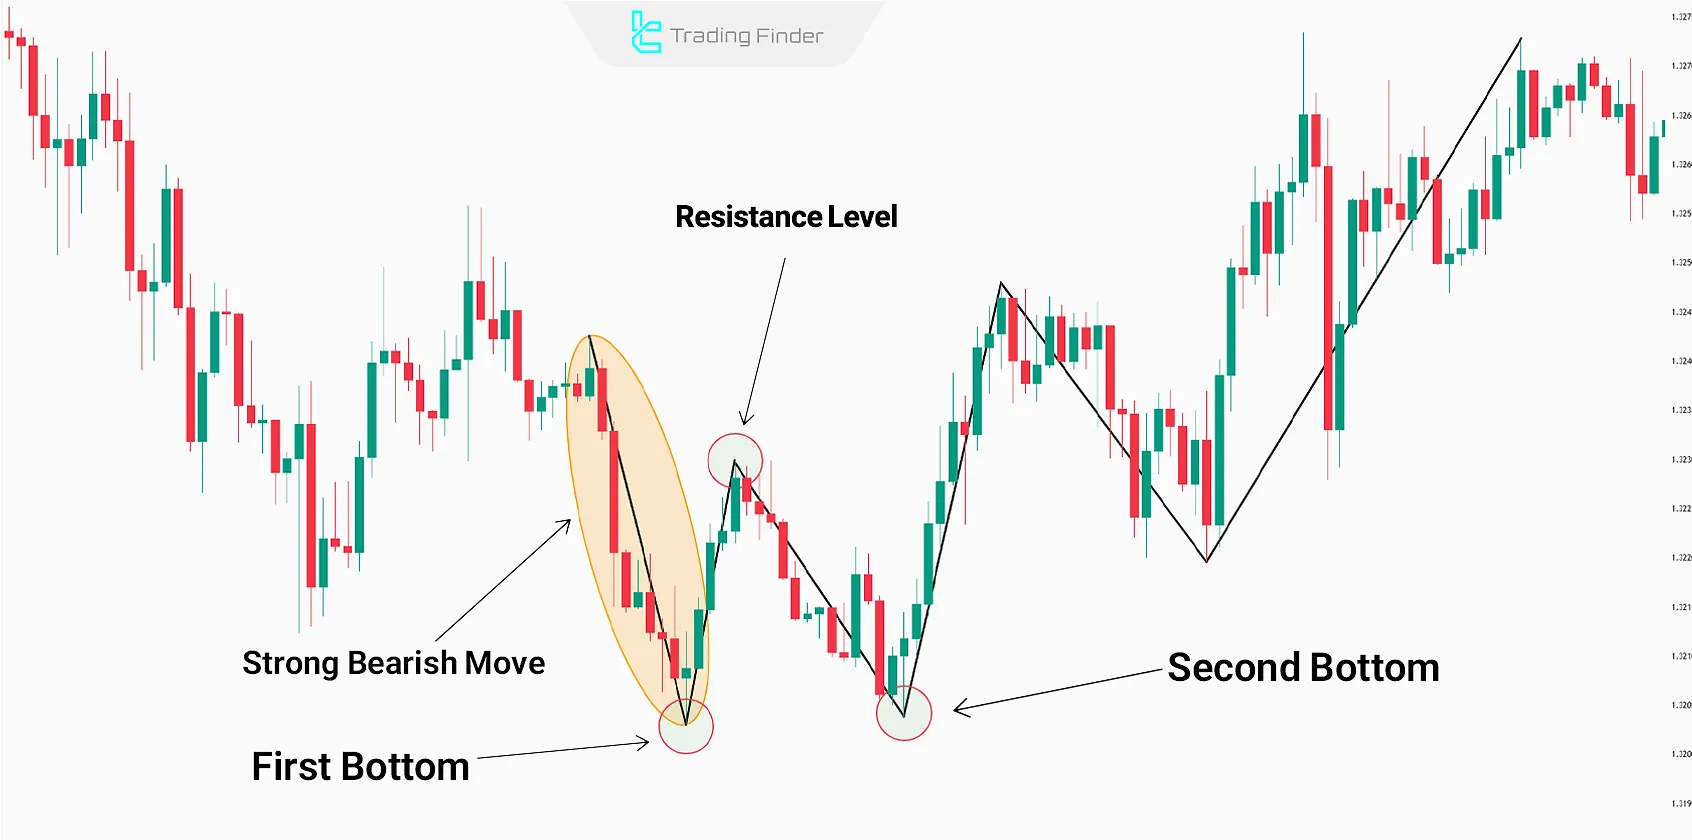
The double bottom pattern is another classic reversal pattern. It forms with two relatively equal lows near a significant support zone, indicating weakness among sellers and the emergence of buying pressure.
In this structure, the second bottom often grabs liquidity from below the first bottom. Once liquidity is absorbed, the price typically moves upward toward the resistance level.
Validating the Double Bottom Pattern
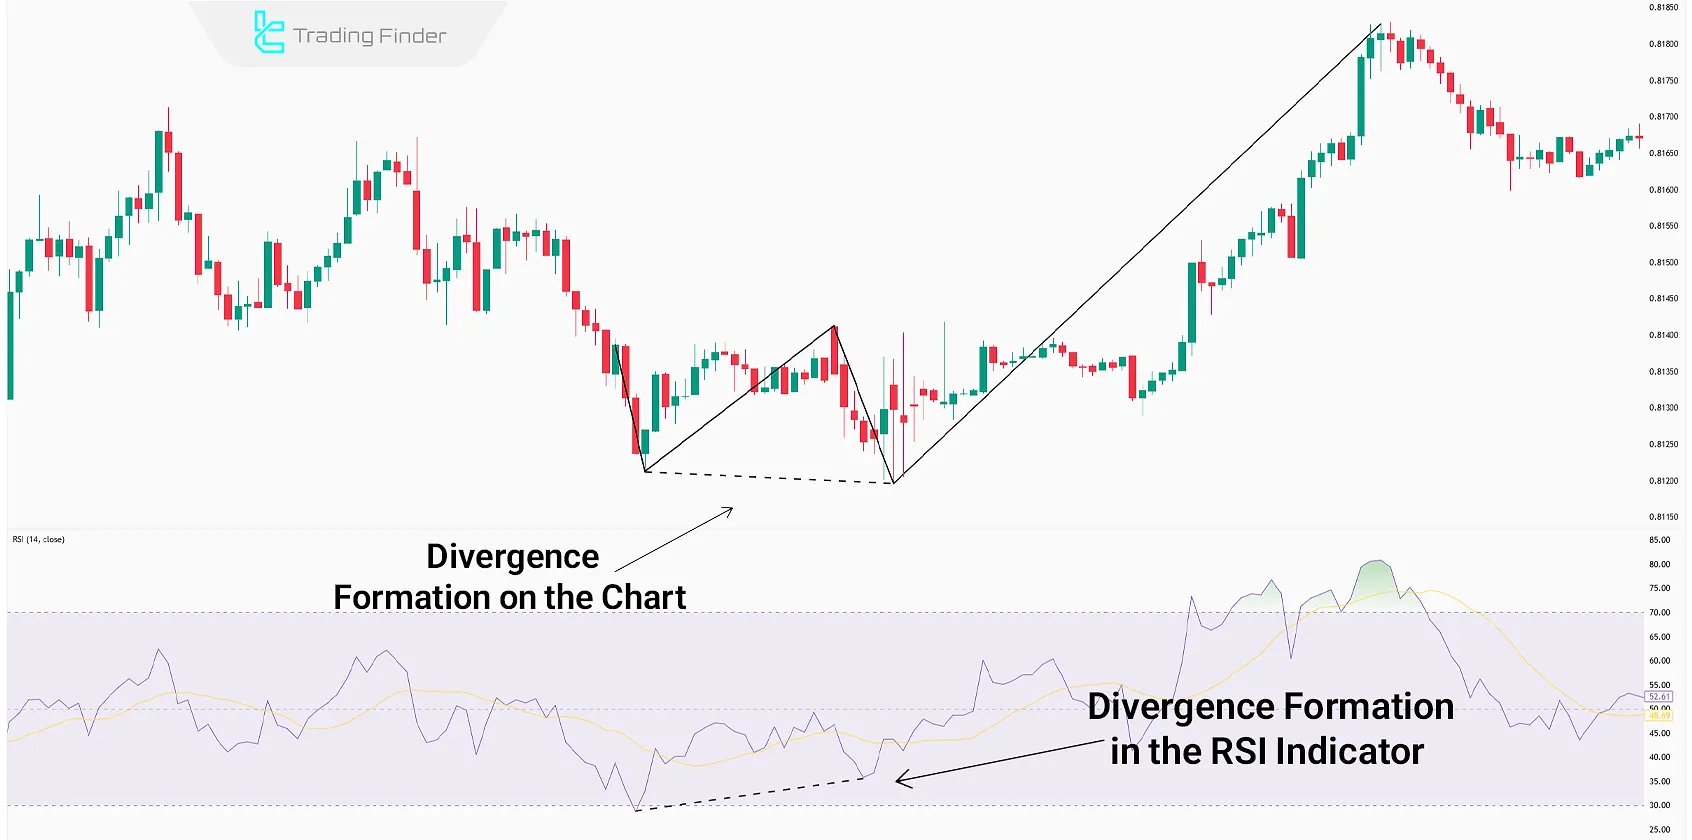
To assess the reliability of the double bottom pattern in technical analysis, one must examine several key elements, including the formation of a positive divergence and reversal candlestick patterns. Key factors include:
- Liquidity Grab: When the second bottom dips slightly below the first and then strongly rebounds, it adds credibility to the pattern;
- Positive Divergence: Detected between the lows using indicators likeRSI or MACD, confirming the pattern’s validity;
- Reversal Candlestick Structure at Second Bottom: Patterns such as Hammer or Engulfing candles reinforce the potential for a price reversal;
- Volume Behavior: A gradual drop in volume during formation, followed by a sudden increase at breakout, strengthens the trading signal;
- Consolidation Before Breakout: Sideways movements before breaking out signal accumulation by buyers, often resulting in a stronger bullish move post-breakout.
How to Trade the Double Bottom Pattern?
To trade the double bottom pattern effectively, traders must evaluate elements such as positive divergence, valid resistance breakout, and liquidity grab.
#1 Pattern Analysis and Confirmation
Following a strong bearish move, the pattern is confirmed when two nearly equal lows appear, separated by a peak in the middle.
A gradual decrease in trading volume and the formation of positive divergence between the two bottoms reinforce the pattern’s reliability.
#2 Entry Points
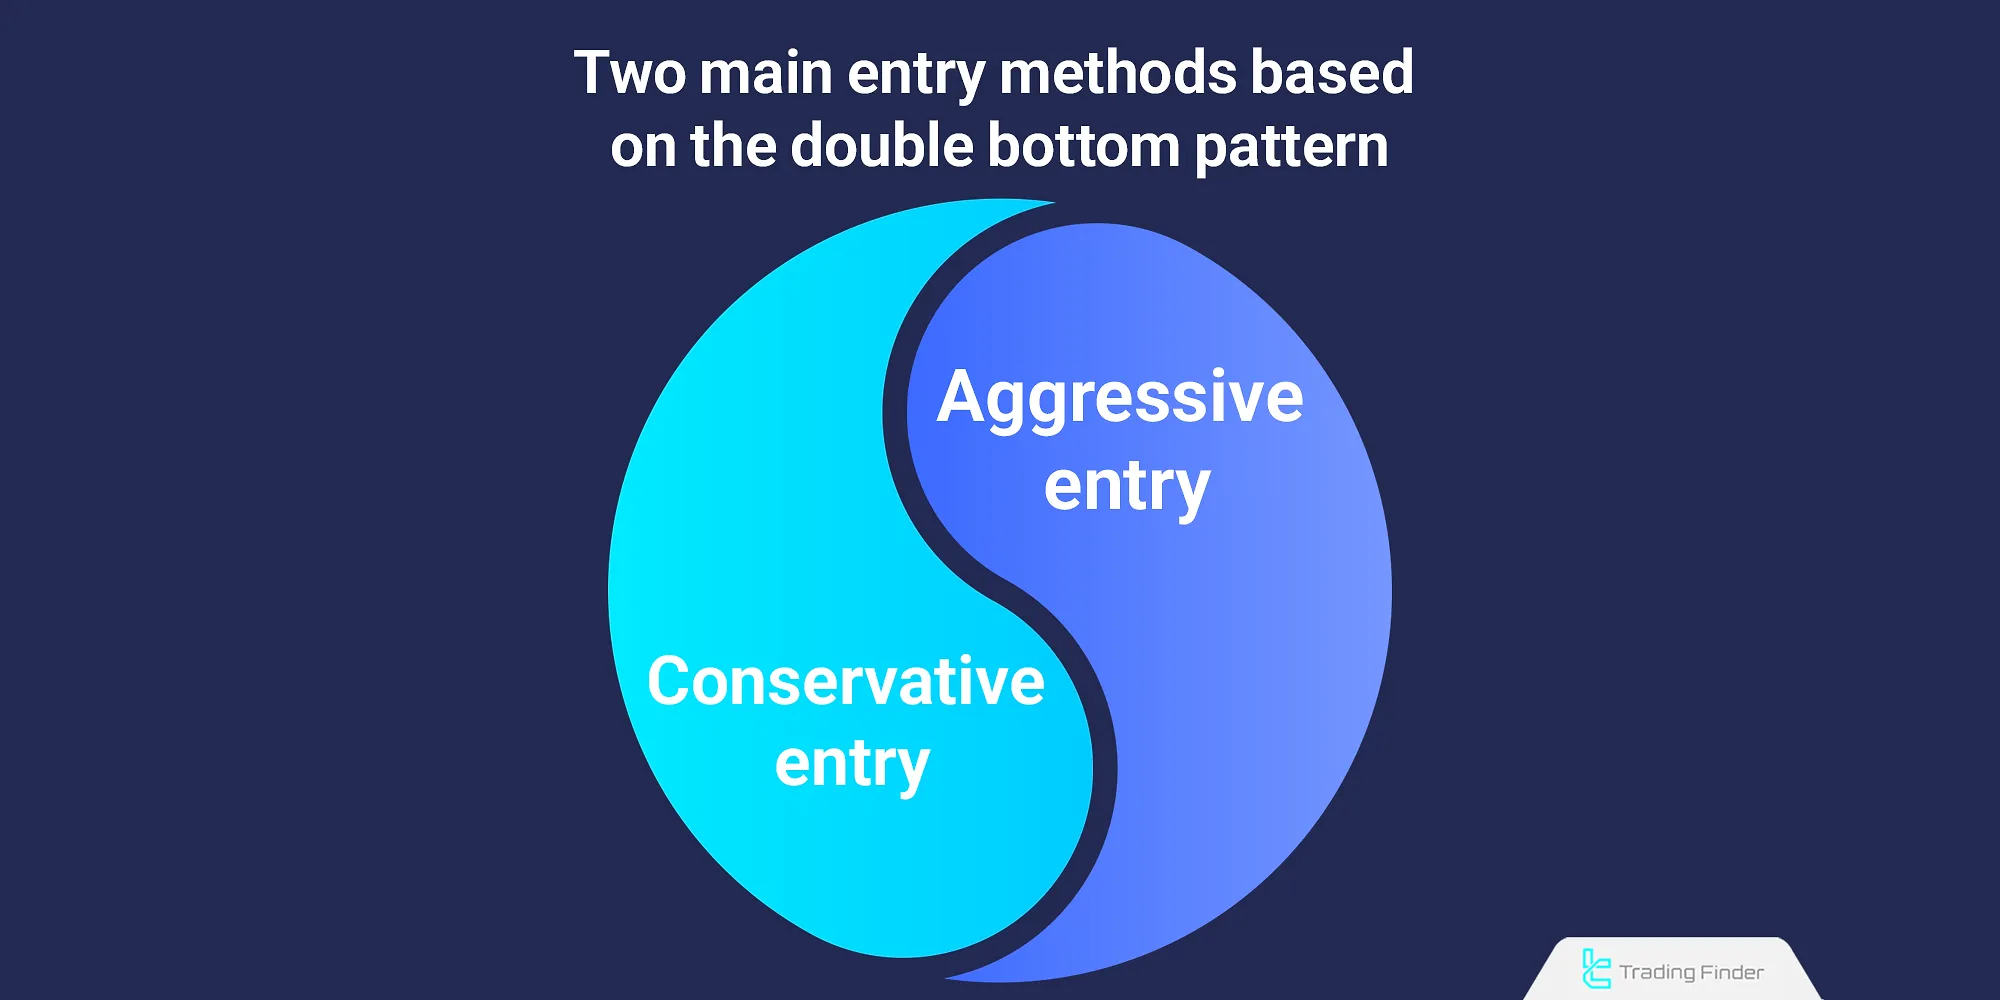
There are two main entry strategies for trading based on the double bottom pattern:
- Aggressive Entry: Enter the trade after observing a strong breakout candle in the resistance zone, even before the neckline is entirely broken;
- Conservative Entry: Enter after a confirmed breakout of the resistance area with a strong bullish candlestick and price closing above the pattern's neckline.
#3 Stop Loss Placement
In the aggressive approach, the stop loss is typically set slightly below the second bottom.
It can also be placed below the second bottom and the breakout candle of the resistance level to reduce risk.
#4 Trade Management
The profit target is determined by measuring the distance between the lows and the neckline of the pattern.
If the price surges toward the target without a pullback, traders may adjust the stop loss to keep the trade open and maximize profits.
Key Points About Double Top and Double Bottom Patterns
Factors like timeframe, shadow formations, and the pullback structure must be considered to evaluate the validity and improve the success rate of trades based on the double top and double bottom trading strategy.
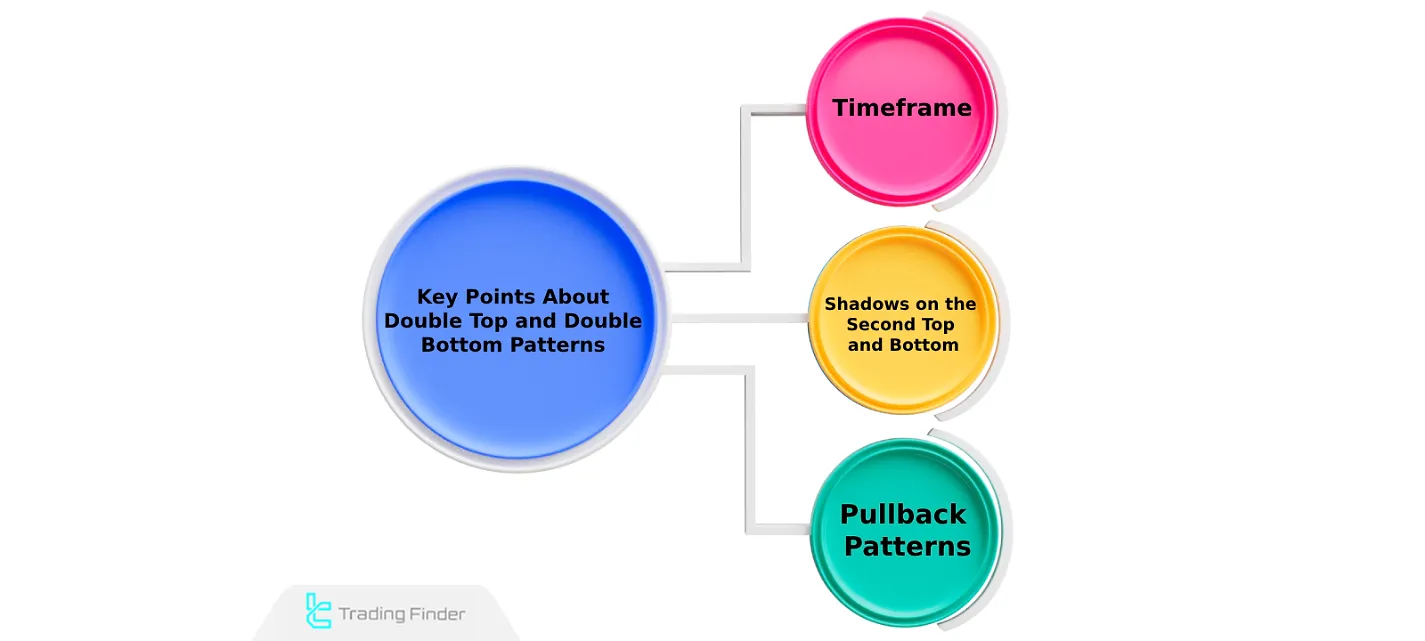
Timeframe
Understanding structural differences between timeframes is essential in analyzing these patterns.
- In lower timeframes like 15 minutes, fake breakouts and quick reversals are more common;
- In higher timeframes like the daily chart, patterns are generally more reliable and lead to larger price movements.
Shadows on the Second Top and Bottom
Another essential element in the double top and double bottom patterns is the presence of shadows on the second peak or valley.
These shadows reflect failed attempts by buyers or sellers to break through support or resistance levels. Their appearance often signals an increased probability of a trend reversal.
Pullback Patterns
After the breakout of support or resistance, pullbacks may not always return simply to the broken level. Instead, more complex corrective structures, such as reversal channels or flags, may form.
The Role of Time Frame in Double Pattern Analysis
In higher time frames such as daily and four-hour charts, the double pattern has greater reliability because market noise is lower.
It is recommended to identify the overall structure in a higher time frame and then check the neckline breakout point in a lower time frame (for example, M15 to H1).
This method improves the risk-to-reward ratio and reduces errors, making it highly useful for traders of double top in forex.
In volatile markets, analysts usually use multiple time frames to examine double bottom forex and double bottom double top patterns to assess the validity of signals.
Key Points for Identifying the Validity of Double Top and Double Bottom Patterns
The double top or double bottom pattern is more reliable when the height difference between the two tops or bottoms does not exceed 5 percent, and their formation period falls within a reasonable range of two to six weeks.
The trading volume should decrease on the second top or bottom, and an increase in volume during the neckline breakout is a sign of confirmation.
The greater the vertical distance between the tops or bottoms and the neckline, the higher the probability of reaching the target price. This structure is one of the precise examples of the double top bottom pattern in technical analysis double top.
Price Target Calculation in Double Top and Double Bottom Pattern
The price target in this pattern is calculated based on the vertical distance between the neckline and the top or bottom of the formation. This distance is projected from the breakout point in the direction of the new trend.
For example, if the distance between the top and the neckline is 800 units, after a valid neckline breakout, the initial target is also set 800 units in the breakout direction. Such patterns are usually recognized as double top pattern breakout or double bottom reversal pattern.
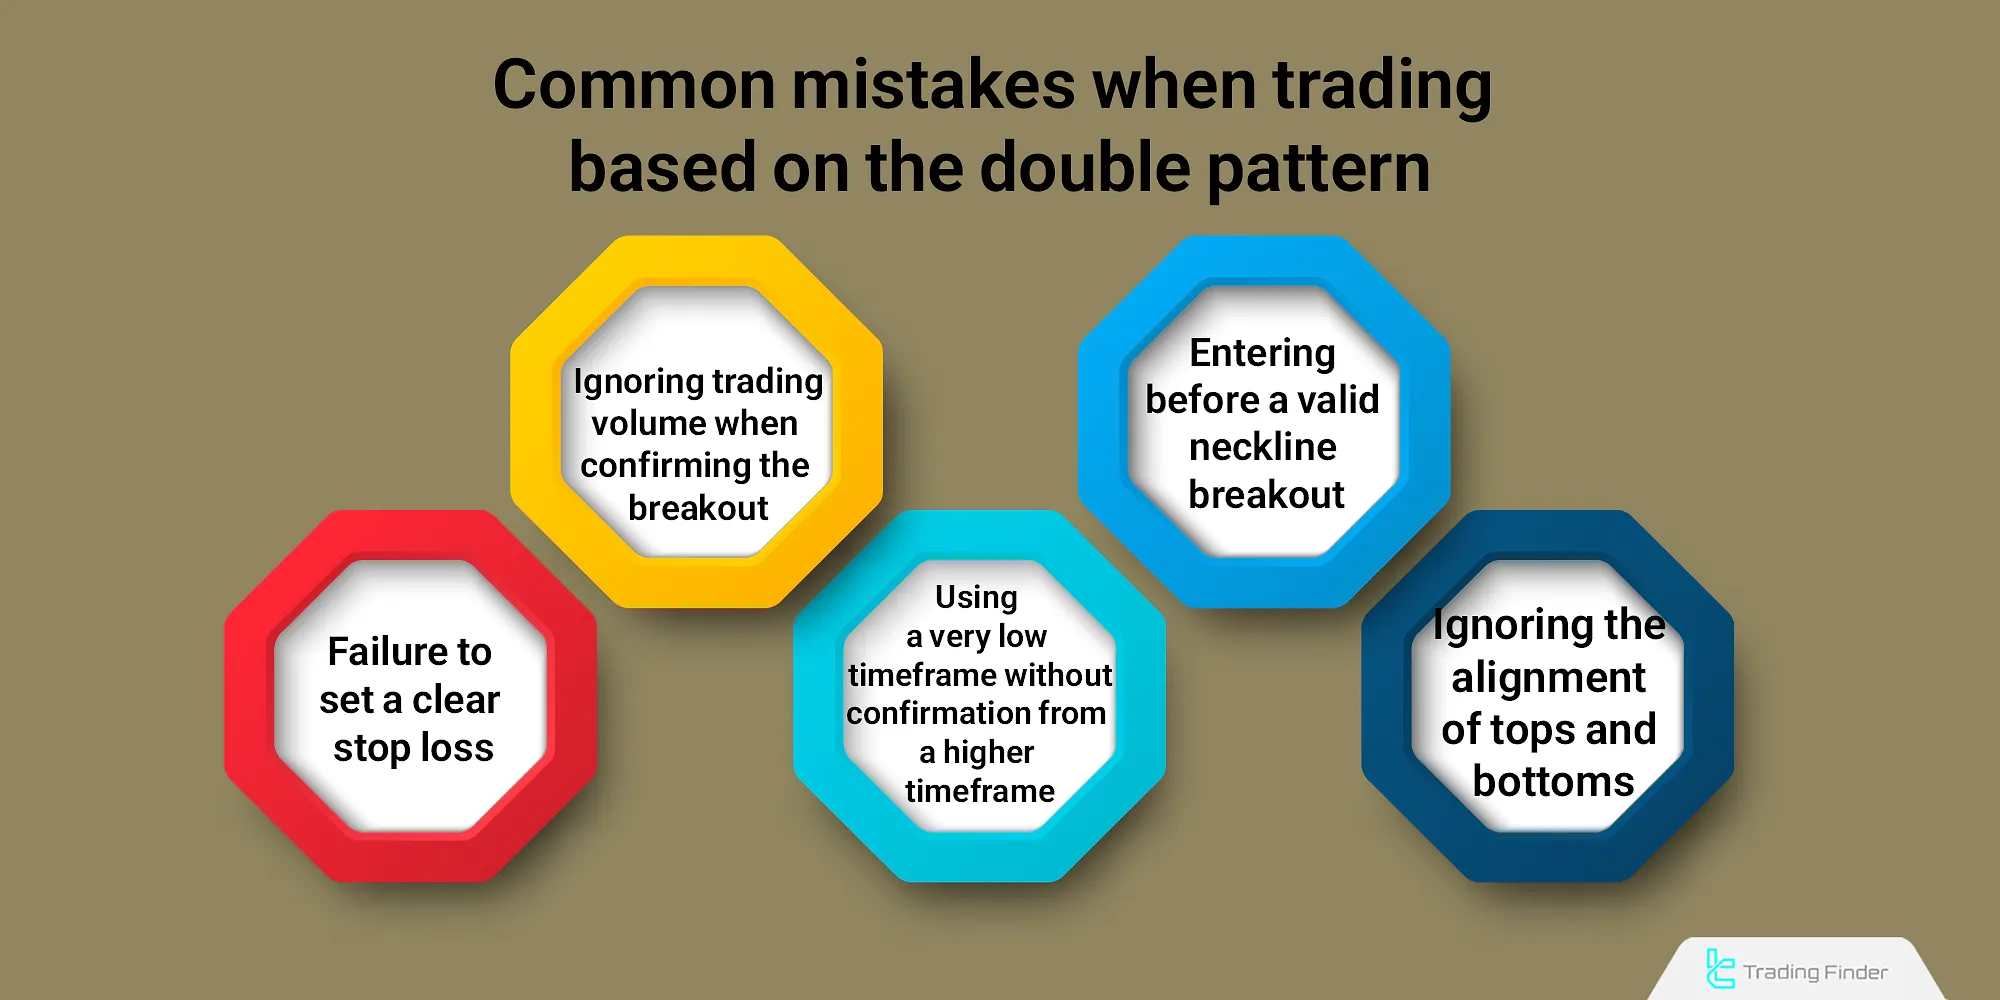
Common Mistakes When Trading Based on The Double Pattern
Paying attention to common mistakes in using this pattern helps increase the trading success rate. For instance, many traders confuse early entries with a fake double top pattern, while waiting for breakout confirmation is crucial.
Common Mistakes When Trading Based on the Double Pattern:
Pros and Cons of the Double Top and Double Bottom Patterns
Due to their simple structure, the double top and double bottom patterns are easier to identify than other classic patterns. However, their high dependency on multiple confirmations can also increase the error rate in trades.
Advantages of Double Top and Bottom Patterns
These patterns are quick to signal a trend reversal and can be integrated into various trading strategies due to their flexibility. Key benefits include:
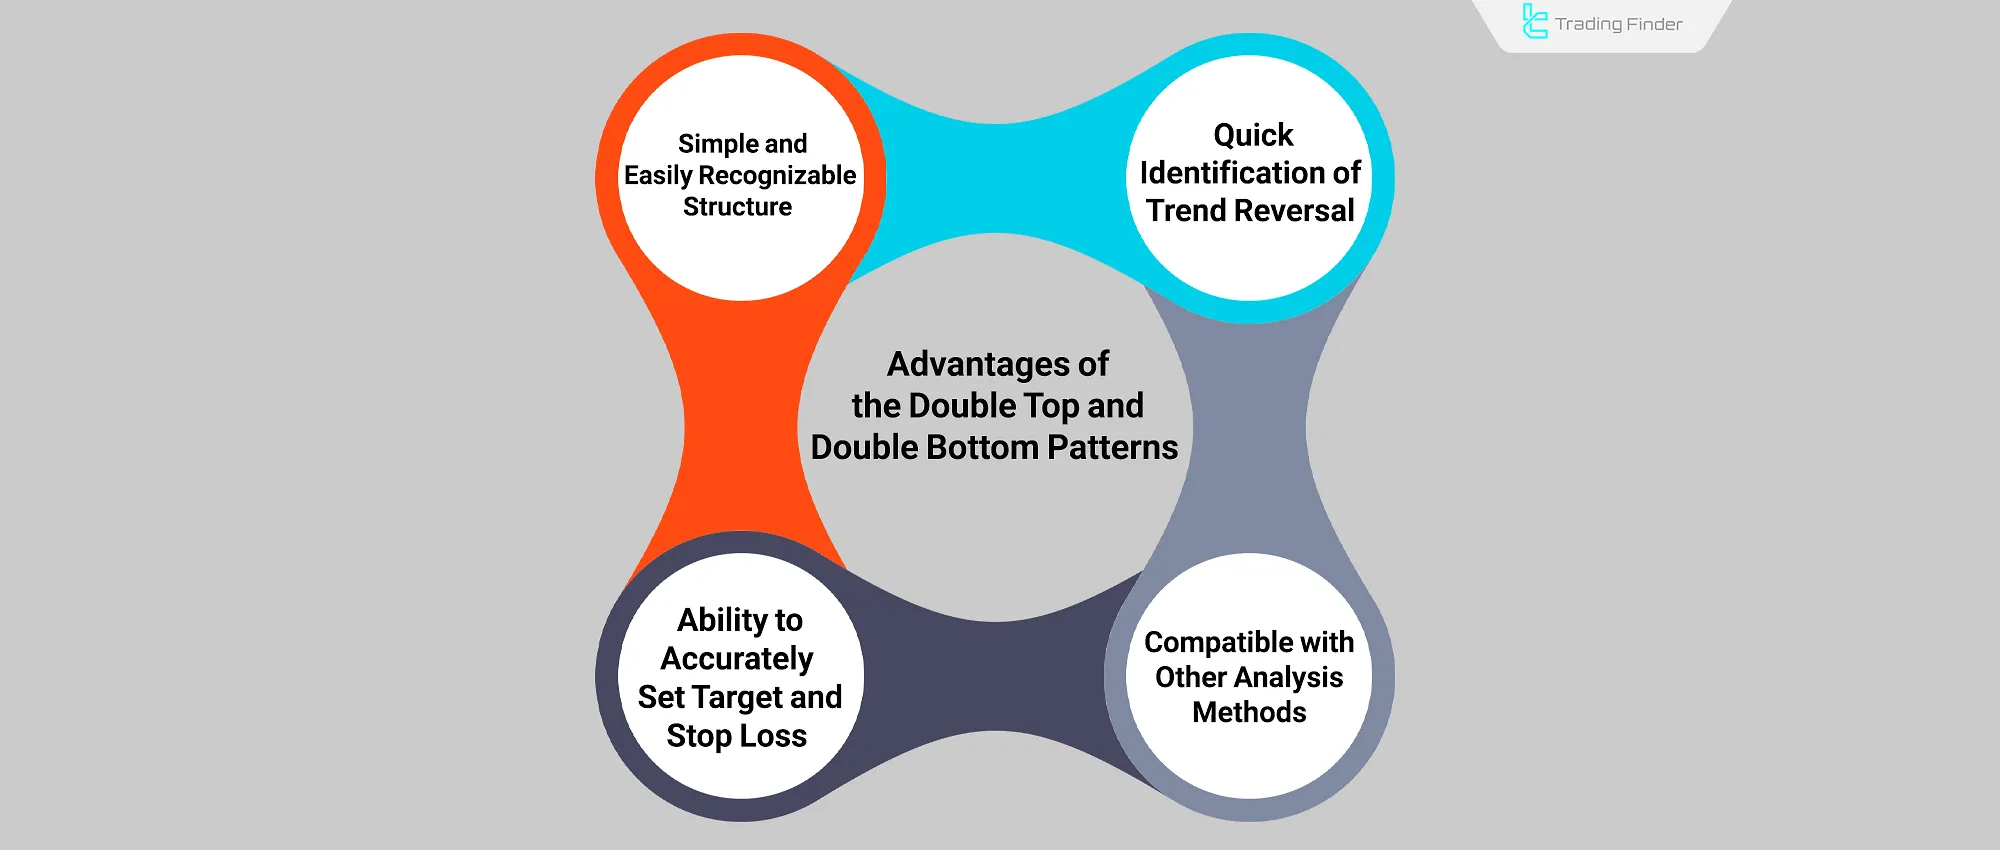
- Early Reversal Identification: These patterns often appear in the early stages of a price reversal, allowing traders to enter the new trend sooner;
- Simple and Recognizable Structure: The clear formation of two tops or bottoms, accompanied by a neckline, makes them easy to spot, even in volatile market conditions;
- Precise Target and Stop-Loss Definition: The vertical distance between the peaks (or troughs) and the neckline offers a logical basis for calculating take-profit and stop-loss levels;
- Compatibility with Other Analysis Methods: They work well alongside indicator divergences, Fibonacci retracements, or support/resistance levels, enhancing overall technical analysis.
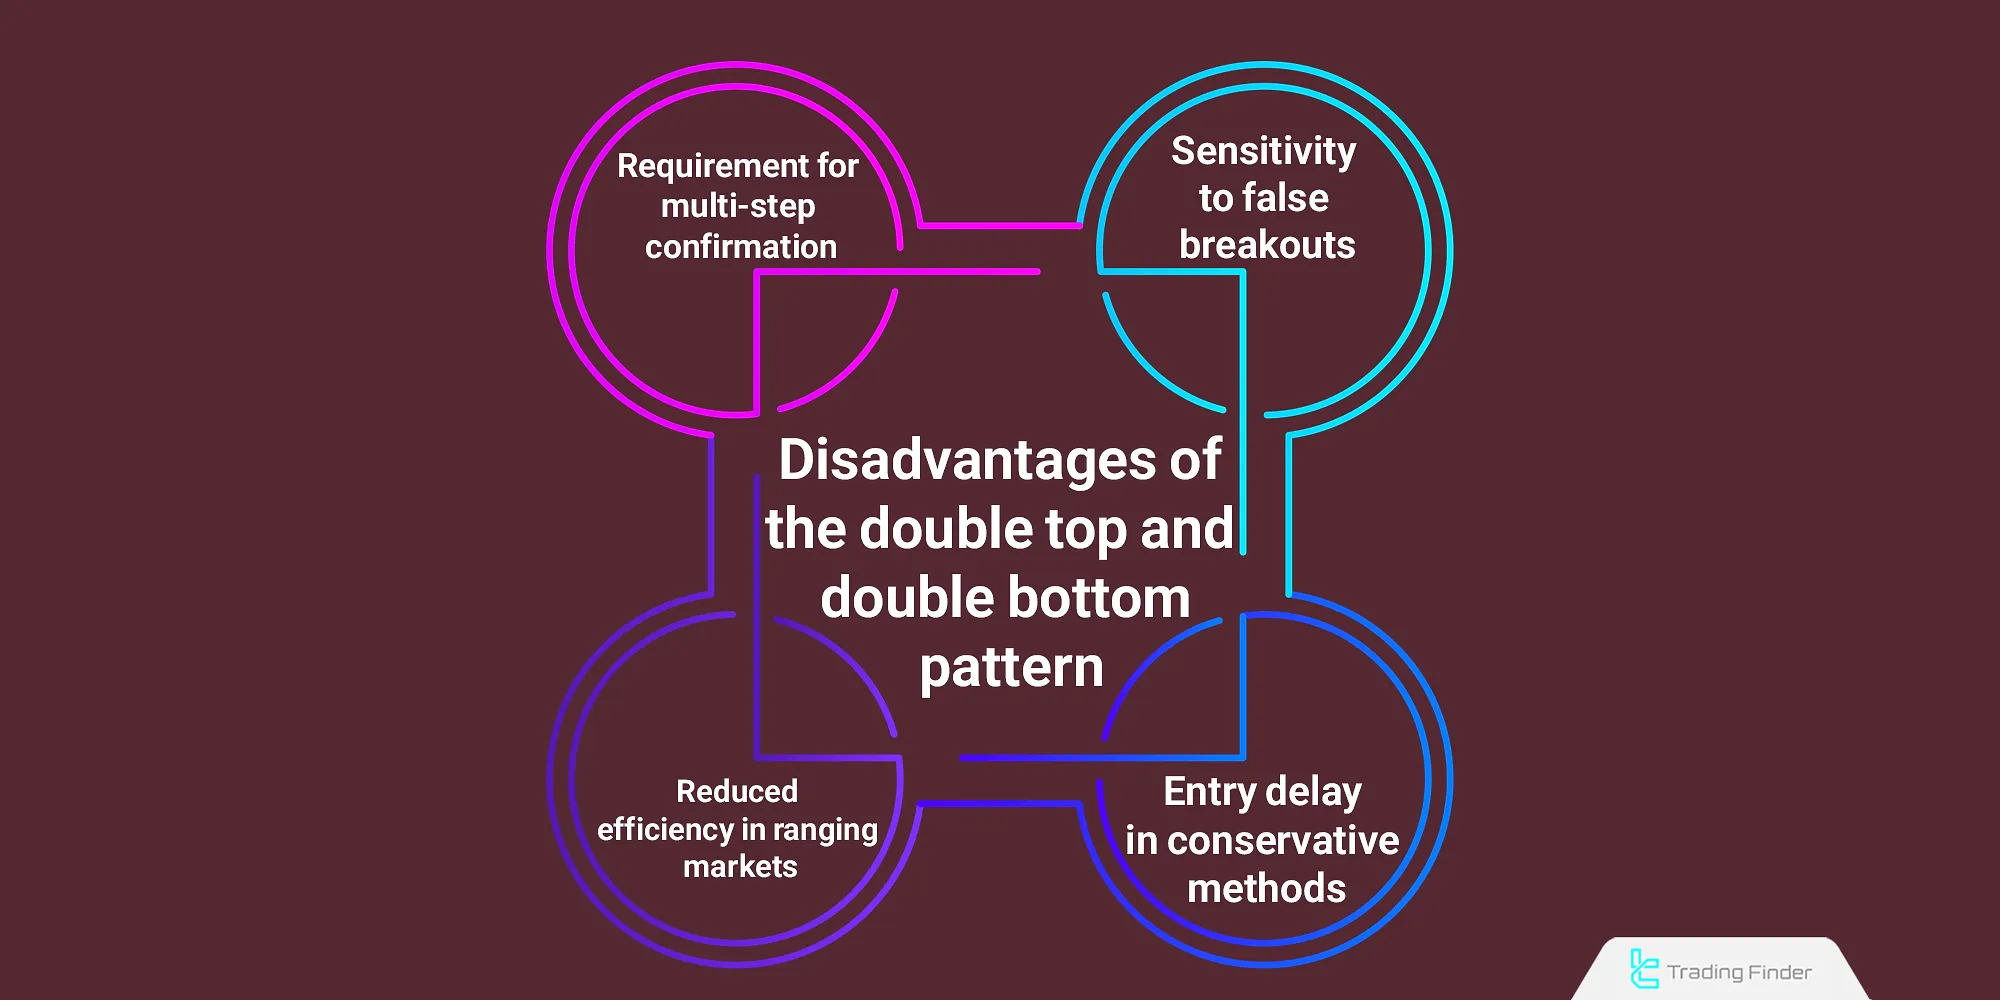
Disadvantages of Double Top and Bottom Patterns
False breakouts are a frequent issue with these patterns, necessitating multiple layers of confirmation, which can result in missed opportunities. Disadvantages include:
- Vulnerability to Fakeouts: In highly volatile markets or lower timeframes, the neckline may break falsely, only for the price to quickly reverse, invalidating the pattern;
- Requirement for Multi-Level Confirmation: To avoid mistakes, the pattern must be validated with additional confirmations, such as volume analysis or reliable reversal candlesticks;
- Delayed Entry in Conservative Approaches: Waiting for a confirmed neckline breakout can cause traders to miss a portion of the move, reducing the risk-reward ratio;
- Reduced Effectiveness in Ranging Markets: These patterns may produce false signals more frequently in sideways or non-trending conditions.
Double Bottom & Double Top Indicator
The Double Top & Double Bottom indicator is one of the powerful tools in technical analysis that helps traders identify market reversal points with high accuracy.
It is based on the ZigZag algorithm with a period of 3 and can automatically draw double top and double bottom chart patterns on the chart. In this tool, double tops are marked in blue and double bottoms in red, allowing the analyst to easily identify trend reversals.
The DTDB indicator belongs to the category of reversal and leading indicators and can be used for forex double bottom pattern, cryptocurrency, and commodities.
It performs accurately for various trading styles including day trading, multi-timeframe analysis, and scalping. In addition, color, line thickness, ZigZag period, and deviation percentage can be adjusted in the indicator settings for further customization.
For example, in the 4-hour timeframe of the USD/CAD pair, the DTDB indicator identified a double bottom pattern, showing a trend reversal from bearish to bullish, which was an example of a double bottom reversal.
In contrast, in the 1-hour timeframe of USD/CHF, the formation of a double top pattern caused a reversal from bullish to bearish, representing a double top reversal that serves as an exit signal for many traders.
Overall, the Double Top & Double Bottom indicator is a precise, lightweight, and practical tool for identifying reversal patterns, making its understanding essential for every technical trader.
When combined with tools such as RSI or Moving Average, it enhances analytical strength and plays a key role in double top technical analysis. Its use in Forex markets is especially valuable for identifying the double top forex pattern.
- Free download of the Double Top Double Bottom pattern indicator for MetaTrader 4
- Free download of the Double Top Double Bottom pattern indicator for MetaTrader 5
Comparison of Double Top and Double Bottom Pattern with other Classic Patterns
A comparison between M and W patterns and other classic structures such as Head and Shoulders or Rounded Bottom is performed across parameters like formation conditions, signal accuracy, and reliability.
These studies show that trading double top and double bottom chart pattern are highly popular among technical traders.
Feature | Double Top Pattern | Head and Shoulders Pattern | Reversal Rectangle Pattern |
Appearance | Two tops at the same level with a horizontal neckline | Three peaks with a higher central top | Horizontal range zone |
Confirmation Point | Breakout of neckline with high volume | Breakout of slanted neckline | Breakout of upper or lower boundary |
Common Error | Early entry | Incorrect neckline drawing | Trading in the middle of the range |
Price Target | Distance from top to neckline | Distance from head to neckline | Height of the price range |
These differences make the double tops and bottoms chart pattern more effective than other structures for early trend reversal identification.
Difference between the double top pattern and the head and shoulders pattern
At first glance, the double top pattern looks very similar to the head and shoulders pattern, but the main difference lies in the taller middle peak in the head and shoulders structure.
Head and Shoulders Pattern | Double Top Pattern | Characteristics |
Three peaks, middle one higher | Two tops at equal height | Number of peaks |
Similar to three peaks with different heights | Shaped like the letter M | Visual appearance |
Middle peak (head) higher than shoulders | Both tops nearly at the same level | Peak position |
Usually upward or downward sloping | Usually horizontal | Neckline |
Trend reversal from bullish to bearish | Trend reversal from bullish to bearish | Main signal |
Stronger and more confirmed | Medium to strong | Pattern reliability |
Confirms main trend reversal | Identifies overbought areas and potential reversal | Use in technical analysis |
This table shows that the difference in double top meaning from the head and shoulders structure mainly lies in the method of breakout confirmation and neckline positioning.
Comparison with Other Classic Patterns
The double top and double bottom patterns can be compared to classic patterns, such as the head and shoulders or rounded bottoms, based on formation conditions, signal accuracy, and other factors.
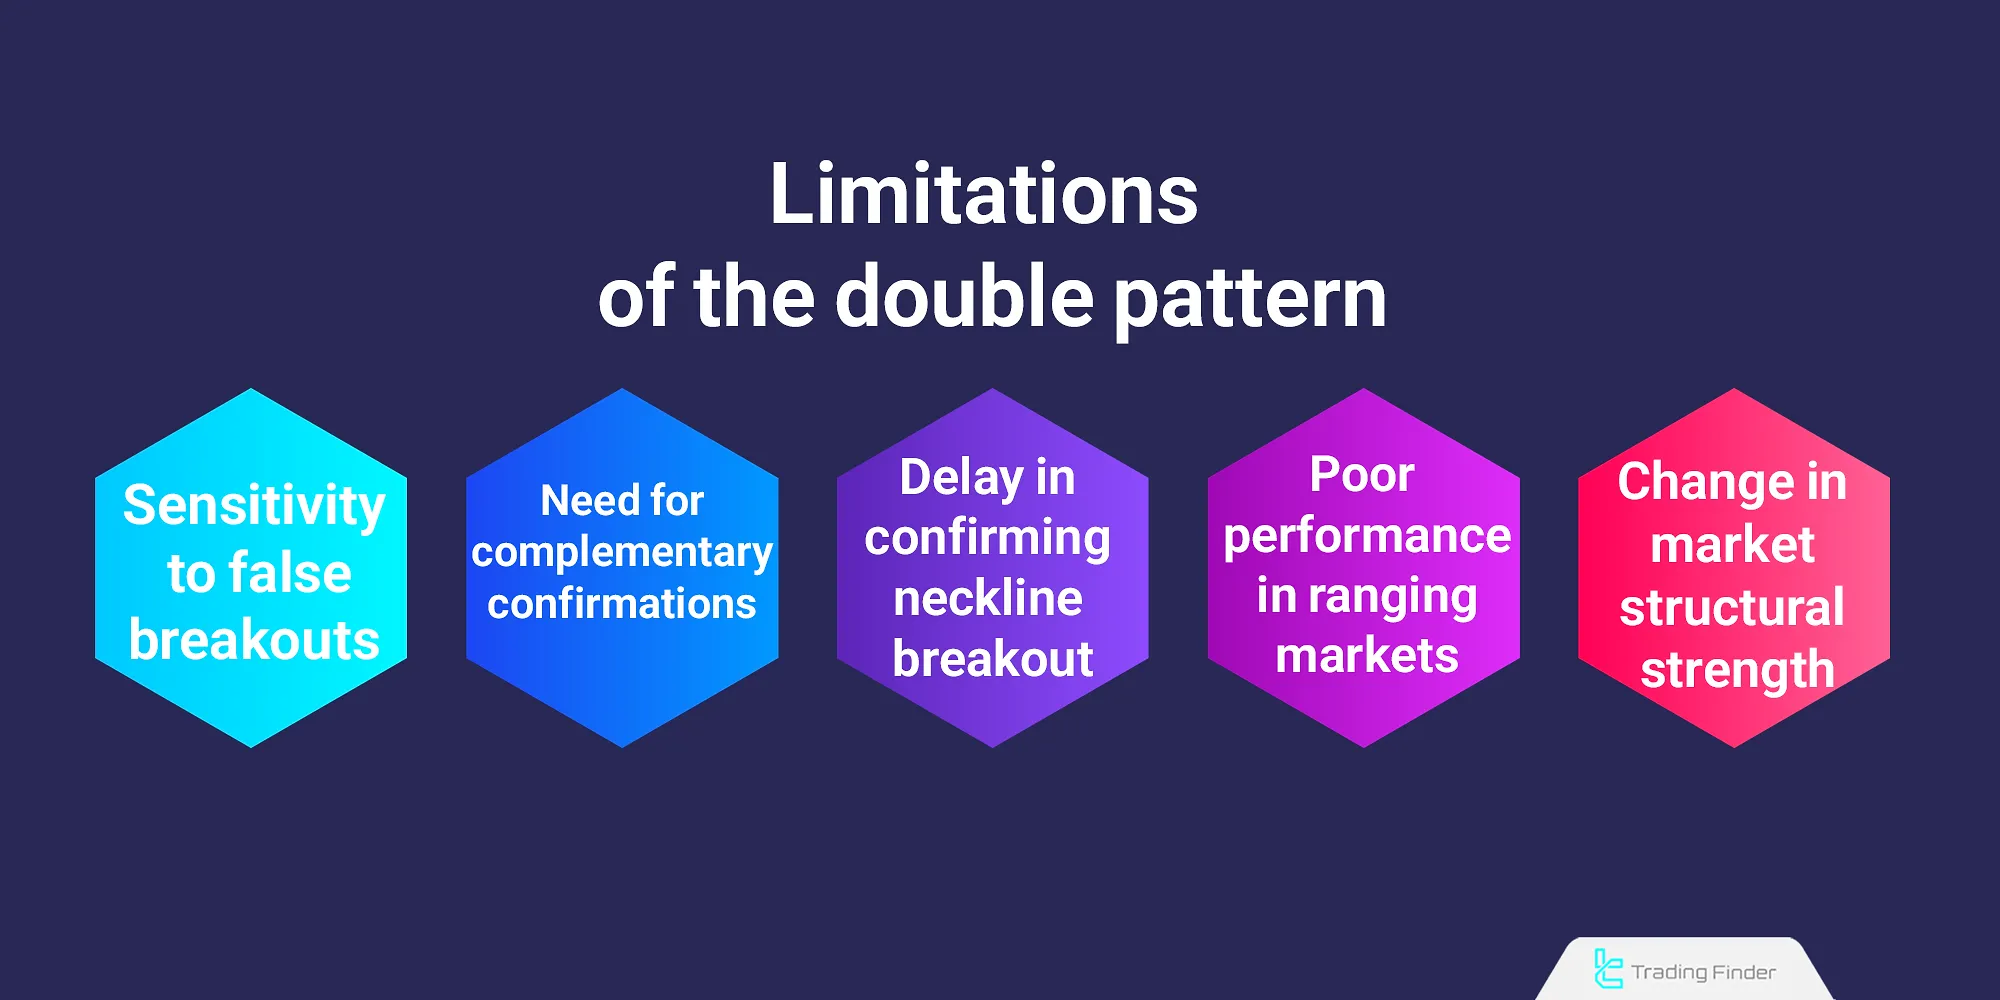
Limitations of the Double Top and Double Bottom Patterns
Using the double top and double bottom patterns in isolation without considering market structure or other confirmations can significantly lower the win rate. Therefore, it’s crucial to be aware of their limitations:
- Fake Breakouts: The neckline might temporarily break, only to be quickly reclaimed, invalidating the setup. This is especially common in low timeframes or illiquid markets;
- Dependency on Supplementary Confirmations: Merely seeing two tops or bottoms is insufficient. To enhance analytical accuracy, traders must examine indicator divergences, unusual volume activity, or strong reversal candlesticks;
- Delayed Confirmation of the Neckline Breakout: Sometimes, the price may retest the neckline after the breakout. Failing to wait for confirmation can lead to entering unsuccessful trades.
Application of the Double Pattern in Volatile Markets
In highly volatile markets such as cryptocurrencies, the double pattern must be analyzed with stronger confirmations due to the frequent occurrence of false breakouts. Using volume, higher time frames, and confirmation candles around the neckline area is of greater importance.
Crypto traders are advised to set slightly wider stop losses and more conservative targets to avoid repeated formations similar to the fake double top pattern.
In such markets, understanding the types of double top pattern is crucial, as each has its own conditions, and incorrect identification can lead to changes in risk management.
Invalidation and Reversal Scenarios in the Double Pattern
Sometimes, after the neckline breakout, the price quickly reverses and invalidates the broken level. In this case, the pattern structure is invalidated, and exiting the position becomes necessary.
If the price stabilizes again in the opposite direction, the same area can be used as a new support or resistance level. In volatile markets, the confirmation of the closing candle and the increase in volume are highly important.
In these situations, traders use concepts such as double top candle pattern, double top candlestick, or even double top pattern in trading for final evaluation. These assessments are usually accompanied by the technical analysis double top method to help confirm genuine breakouts.
Conclusion
The double top and double bottom patterns are among the most well-known reversal structures in technical analysis, used across markets such as Forex, crypto, and stocks.
Combining these patterns with volume indicators and moving averages improves analytical precision. Professional traders using trading double top and double bottom reversal can identify market turning points with high success probability.
Ultimately, understanding concepts such as double top breakout, double top reversal, and double bottom - double top helps traders make more accurate decisions in changing market conditions.
Many analysts refer to this structure as an example of the double top bottom within the double top trading strategy, which delivers effective results in both Forex and crypto markets.


