


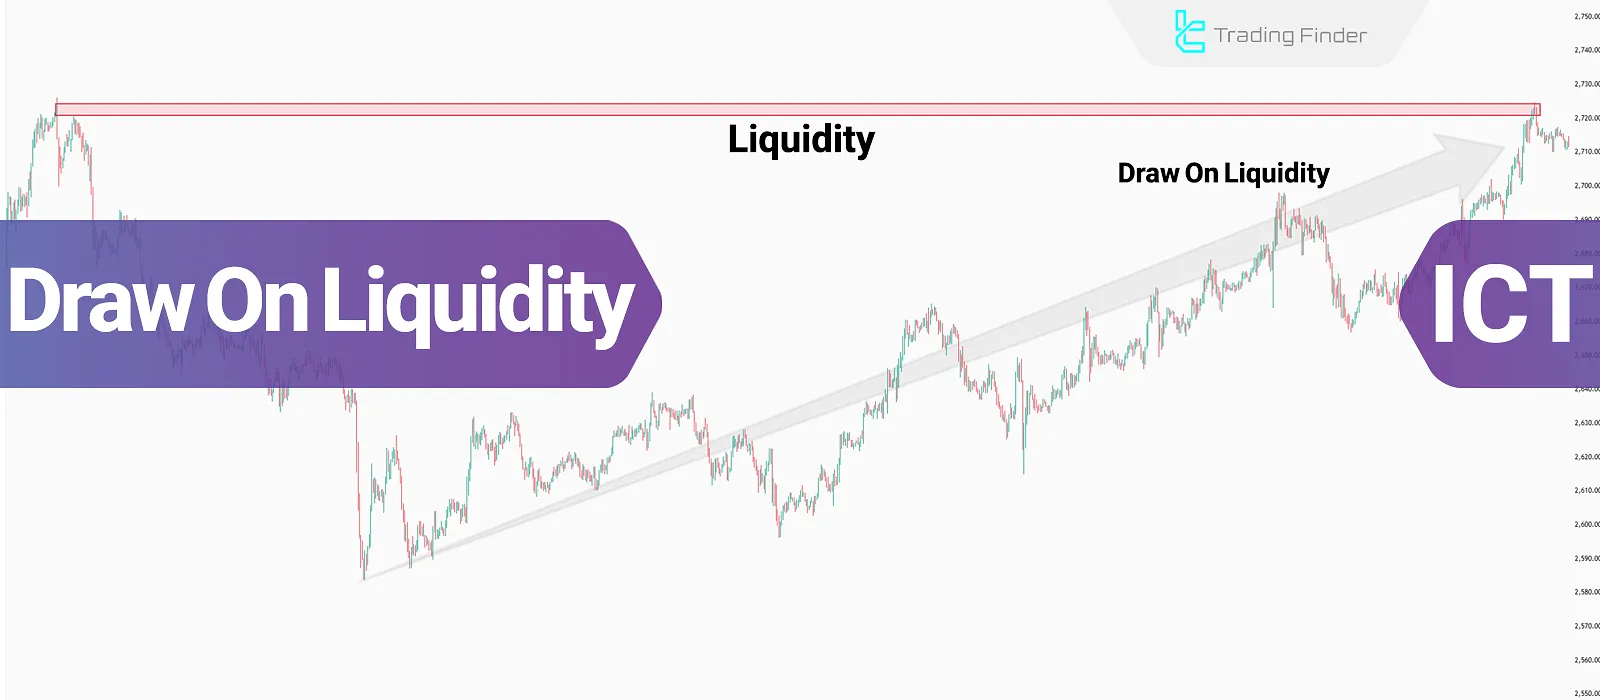
In the ICT Style trading framework, price is constantly drawn toward liquidity pools such as equal highs, equal lows, and clusters of stop-lossorders.
The idea of Draw On Liquidity (DOL) explains how market makers and institutional order flow use these areas as targets to fuel the next move. A sweep above a double top or below a swing low reflects this process of tapping into hidden liquidity.
After liquidity is taken, price often respects structural references like Breaker Blocks(BBs) or Fair Value Gaps (FVGs) to continue delivery.
In this sense, DOL not only clears liquidity but also signals a potential Market Structure Shift (MSS), helping traders align entries with institutional order flow.
What is Dol meaning?
Liquidity accumulates at key points such as old highs and lows, equal highs and lows, support and resistance zones, and order block areas.
In ICT style, the Draw On Liquidity (DOL) concept refers to price movement toward these zones to absorb the liquidity needed for continuation.
Draw On Liquidity (DOL) is explained in a video on the TTrades YouTube channel:
How to find draw on liquidity? Types of Liquidity in the Market
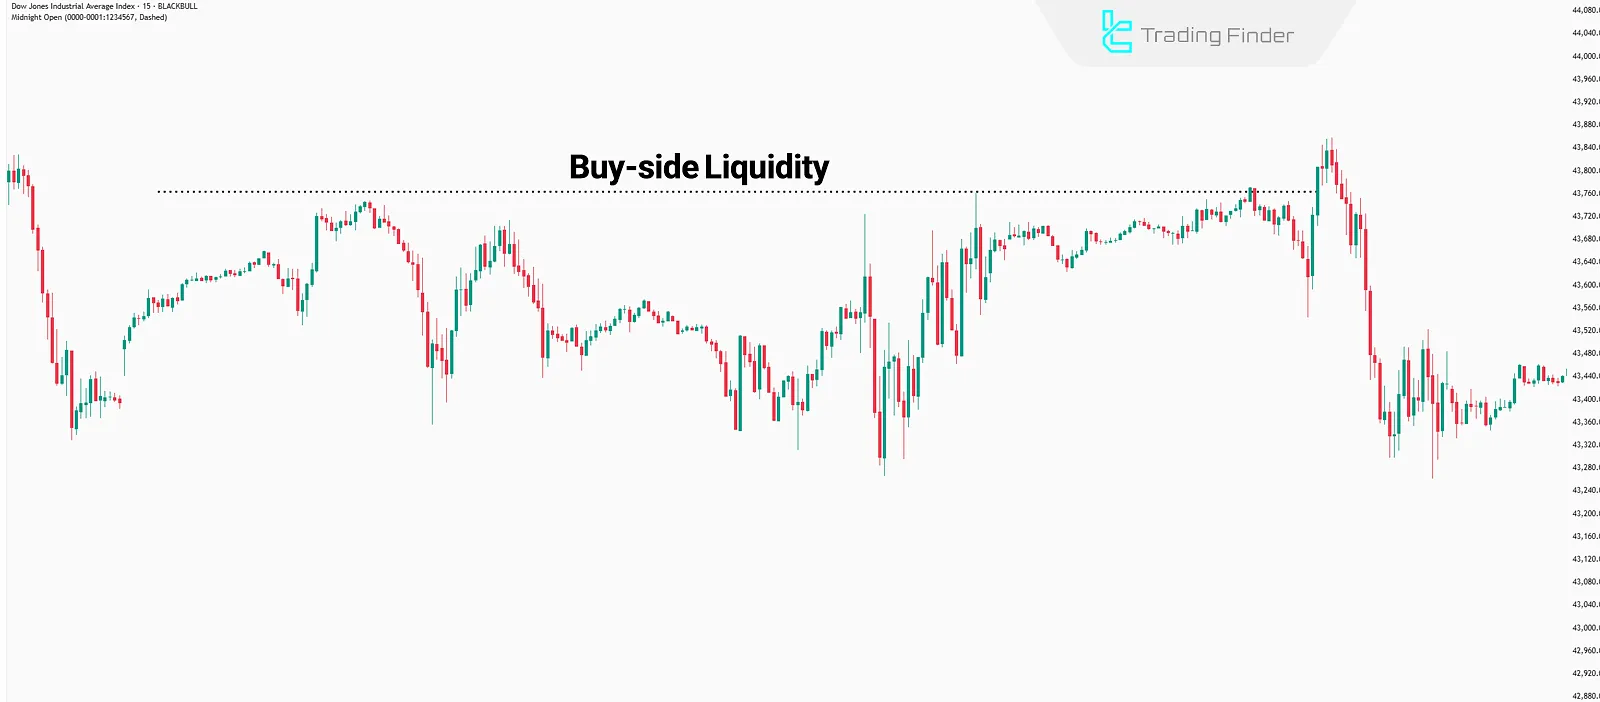
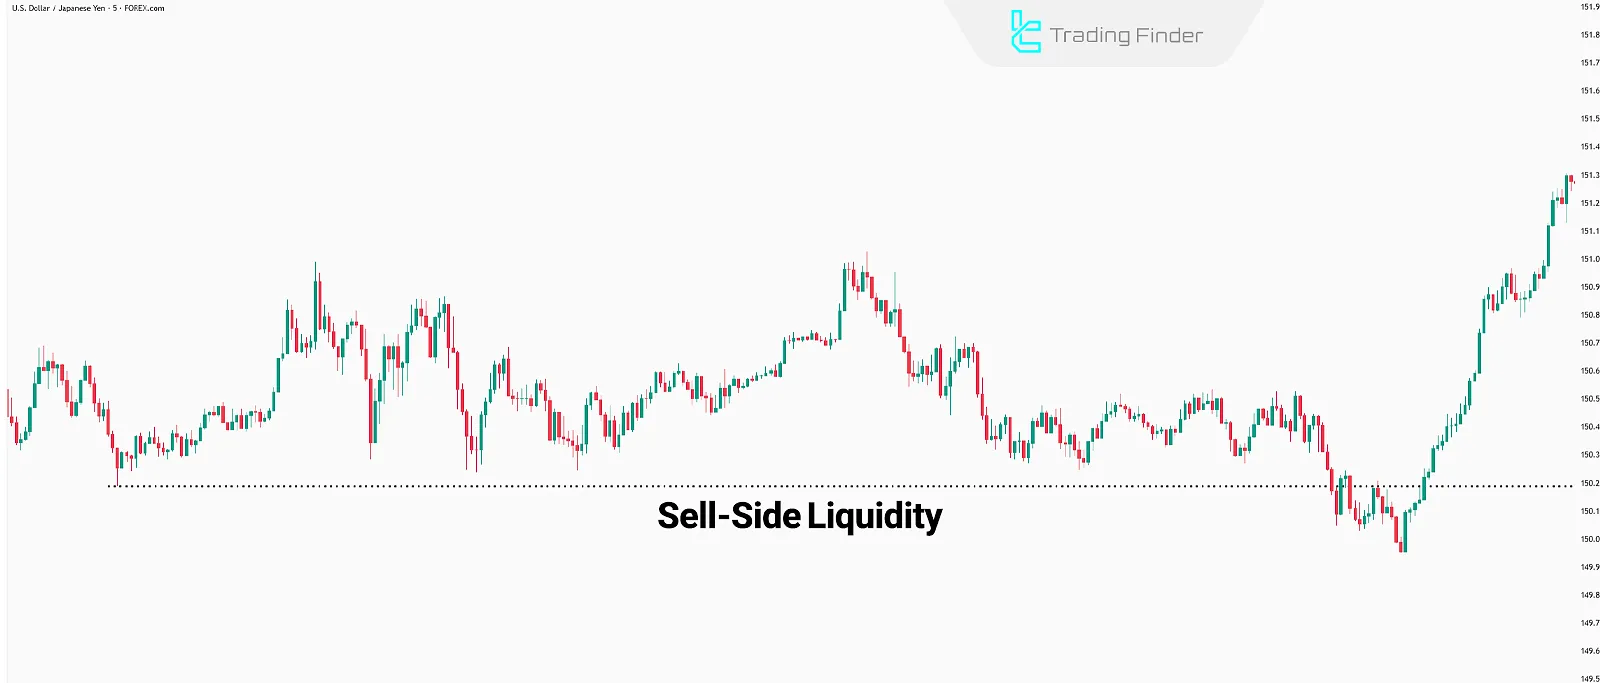
The forex market contains two primary types of liquidity, both playing a crucial role in analyzing the Draw On Liquidity (DOL) concept:
Buy-Side Liquidity
This type of liquidity is located above the current market price an area where buy stop orders and Understanding draw on liquidity.
op losses of sell trades accumulate. These are often found near swing highs or key resistance levels.
Sell-Side Liquidity
Sell-side liquidity exists below the current market price a region where sell stop orders and stop losses of buy trades are placed. These are typically found near swing lows or support areas.
The Role of Market Makers in Draw On Liquidity
According to the Draw On Liquidity training on innercircletrading, market makers play a pivotal role in shaping DOL.
By guiding price toward areas packed with pending orders, they create conditions that allow large transactions to be executed without severe slippage.
For example, when a large cluster of stop-loss orders sits behind a key swing high or low, market makers can drive price into that zone to harvest the liquidity needed to fill their orders.
This looks like “liquidity hunting,” but in reality it’s a mechanism the market uses to source liquidity.
Identifying Draw On Liquidity Movement
To detect Draw On Liquidity (DOL) moves, first identify high-liquidity zones using core ICT concepts that naturally attract price.
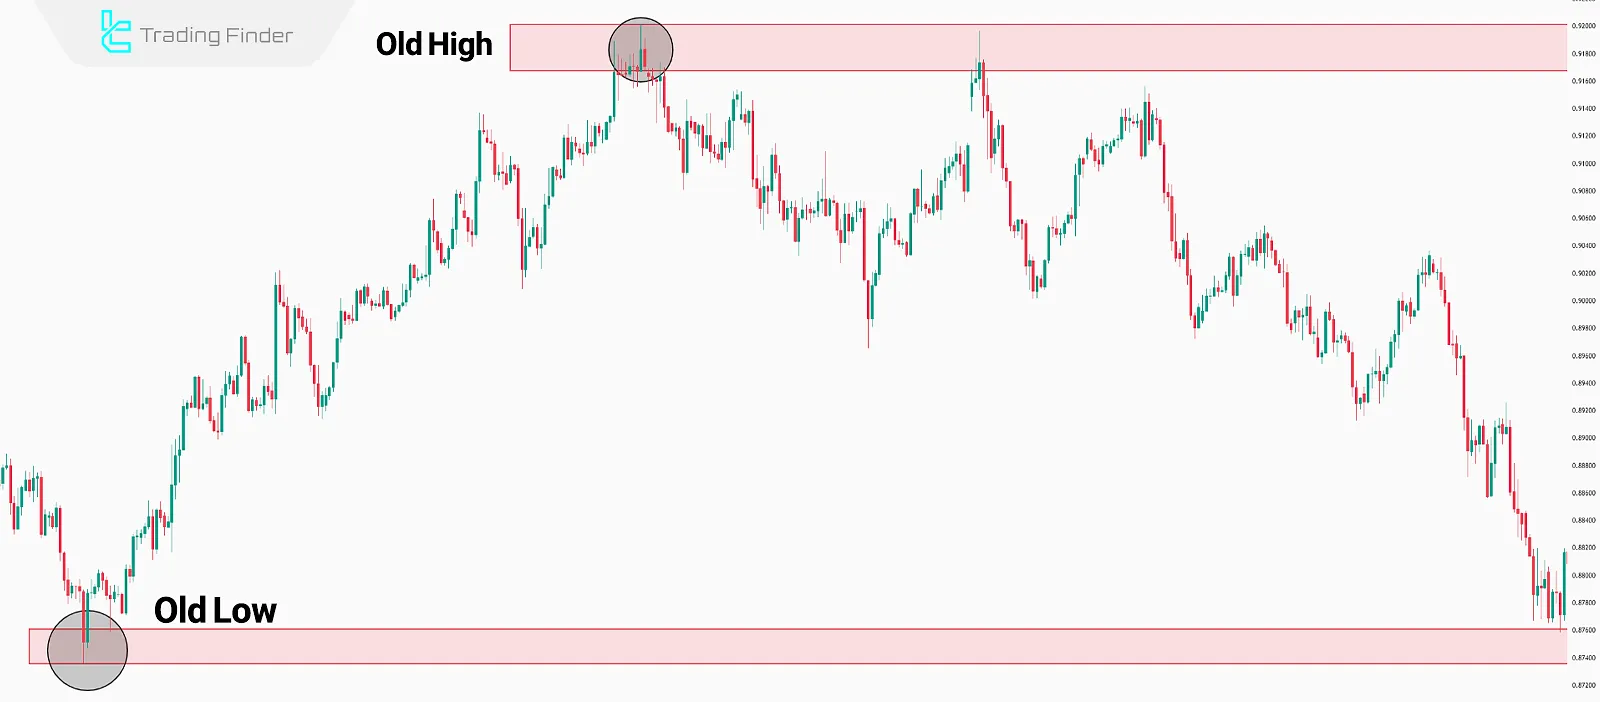
Old Highs and Lows
Old highs and lows are chart points where price previously reached and reversed. These levels are often prime targets for Draw On Liquidity (DOL) moves.
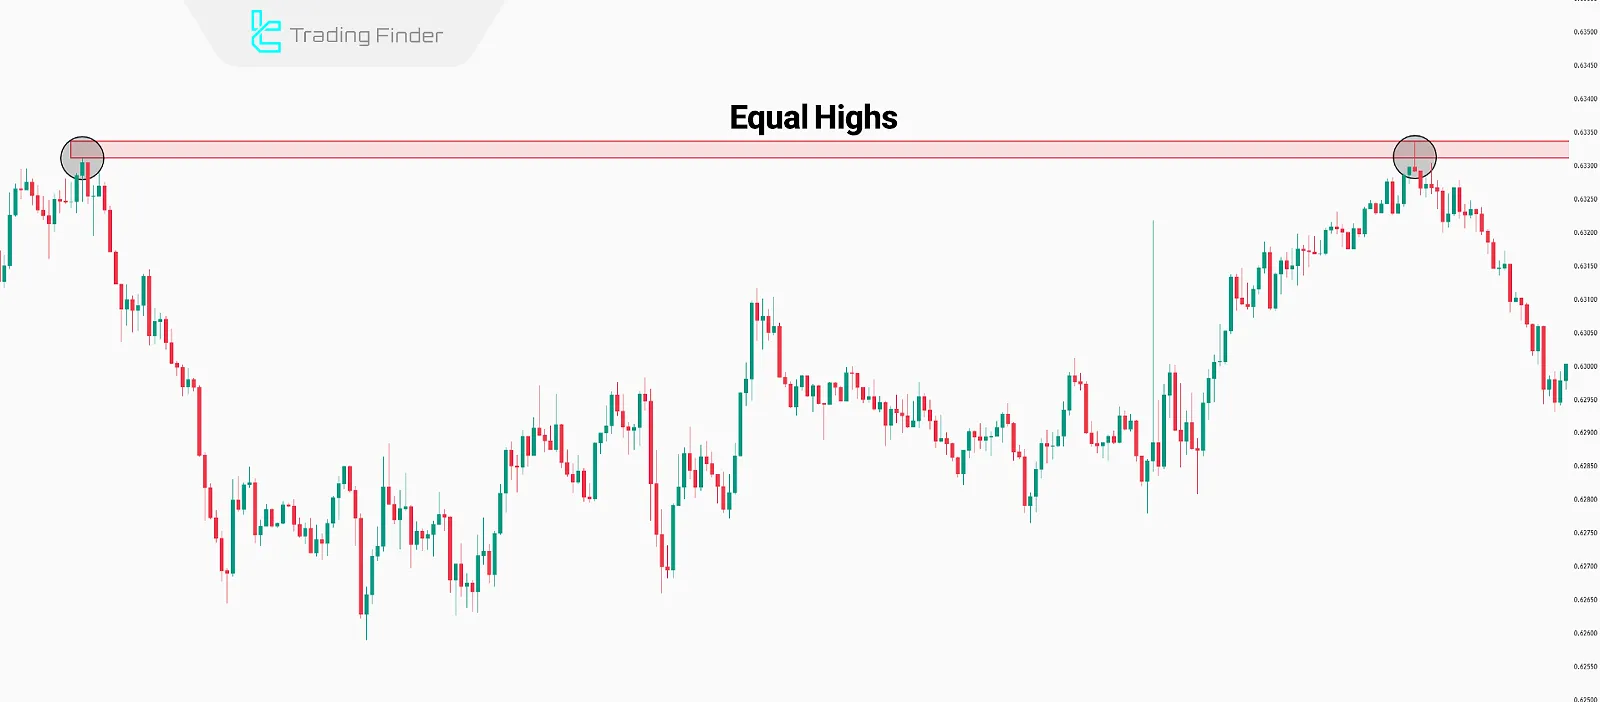
Equal Highs and Lows
Equal highs and lows are zones where price has repeatedly reacted at the same level. Retail traders often place stop losses behind these zones, creating ideal liquidity targets for Draw On Liquidity (DOL) moves.
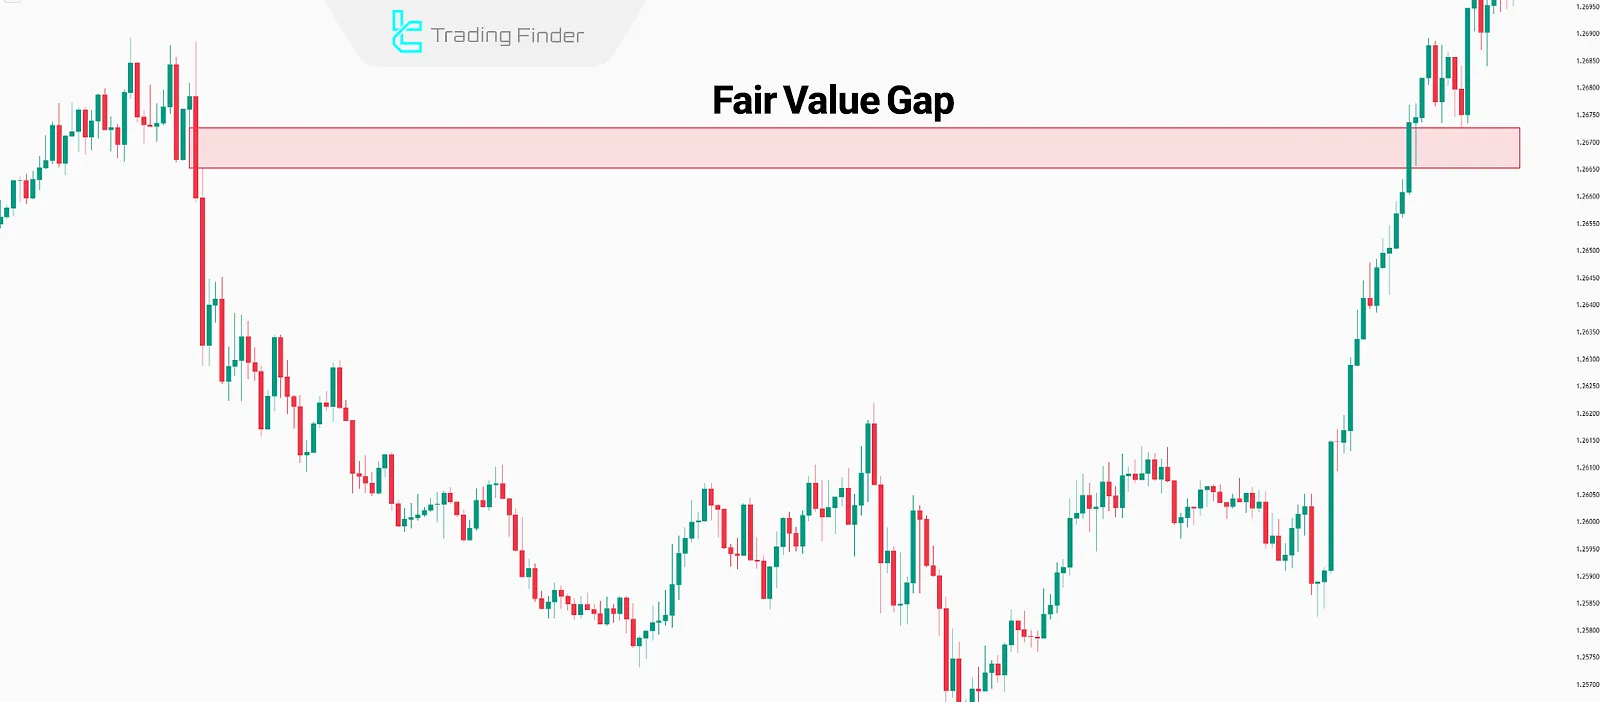
Fair Value Gap (FVG)
A Fair Value Gap (FVG) is a price zone where an imbalance between buyers and sellers occurs. This causes a rapid movement in one direction, resulting in a gap between candles.
As a result, many orders remain unfilled. These gaps create ideal zones for Draw On Liquidity (DOL) moves.
Example of Draw on Liquidity toward Fair Value Gap (FVG)
In this example, the price initially creates a gap on the chart through a strong bearish movement; therefore, in the continuation of its move, the price tends to rise and fill the price gap.
By analyzing the starting point of the bearish move, it becomes possible to identify the first formed Fair Value Gap (FVG).
Subsequently, as the price begins its bullish movement, it fills the created price gap, completing the Draw on Liquidity process.
ICT Tools for Identifying Draw On Liquidity
Within the ICT framework, several structures indicate where institutional orders and retail stop-losses tend to cluster. These are magnets that price ultimately gravitates toward to gather the liquidity required for continuation.
Table of ICT Tools for Identifying Draw On Liquidity:
Concept | Description |
Order Block | Zones where institutional orders stalled or reversed price and often act as liquidity destinations. |
Breaker Blocks | Levels where prior support/resistance failed and now host elevated liquidity. |
Fair Value Gap (FVG) | Gaps between candles caused by imbalance; price often returns to fill them. |
Break of Structure (BoS) | A market structure break that signals liquidity behind highs/lows was targeted and a new move has begun. |
Pros and Cons of Using Draw On Liquidity
While Draw On Liquidity (DOL) can optimize trade execution by identifying liquidity direction, it also poses challenges due to its dependency on liquidity presence and the need for deep order flow understanding.
Pros | Cons |
More precise entries | Requires high expertise in liquidity analysis |
Reduced slippage (Slippage) risk | Possibility of false breaks |
Greater accuracy in choosing stop-loss and take-profit | Risk of early entry before confirmation of a liquidity grab (Liquidity Grab) |
Trading in the direction of the liquidity flow | Difficulty identifying primary liquidity on lower time frames |
Improved trade timing | News can heavily distort liquidity |
Uncertainty at some liquidity levels | Reduced probability of being stop-hunted |
Trading Strategies Using Draw On Liquidity
Forex draw on liquidity isn’t just theory; it forms a basis for timing precise entries and exits. Accordingly, strategies related to DOL assume price is always seeking to trigger hidden orders and retail stops.
Therefore, by tracking these motions, DOL trading becomes feasible.
Table of Draw On Liquidity Strategy:
Strategy | Description |
Stop Hunt | Identifying Stop-Hunt Zones where retail traders are concentrated and entering draw on liquidity trades |
Combining DOL with Break of Structure (BoS) | Using a structure break as the signal that price is moving toward liquidity zones |
Smart Money Divergence (SMT Divergence) | Analyzing divergence between two assets or time frames to infer liquidity direction and confirm entries |
Advanced Draw On Liquidity Concepts
To grasp ICT draw on liquidity more precisely, you should know advanced ideas like High/Low Resistance Liquidity Run, chart-level zones, and Order Flow analysis. The table below summarizes these concepts.
Table of Advanced Draw On Liquidity Concepts:
Concept | Definition | Application in ICT Analysis |
High Resistance Liquidity Run (HRLR) | When the market repeatedly fails to pass a specific level, leaving liquidity pooled behind it | Indicates concentrated liquidity at a strong support/resistance band that unwinds later |
Low Resistance Liquidity Run (LRLR) | When price slices through prior levels easily and liquidity is absorbed quickly | Suggests smoother liquidity and faster movement toward subsequent targets |
Plotting Concepts on the Chart | Marking highs, lows, FVGs, and Order Blocks on the chart | Helps visualize likely liquidity paths and recurring patterns |
Order Flow Analysis | Studying buy/sell flow (Order Book/DOM) to locate real traded volume | Pinpoints zones with higher odds of institutional liquidity absorption for precise entries/exits |
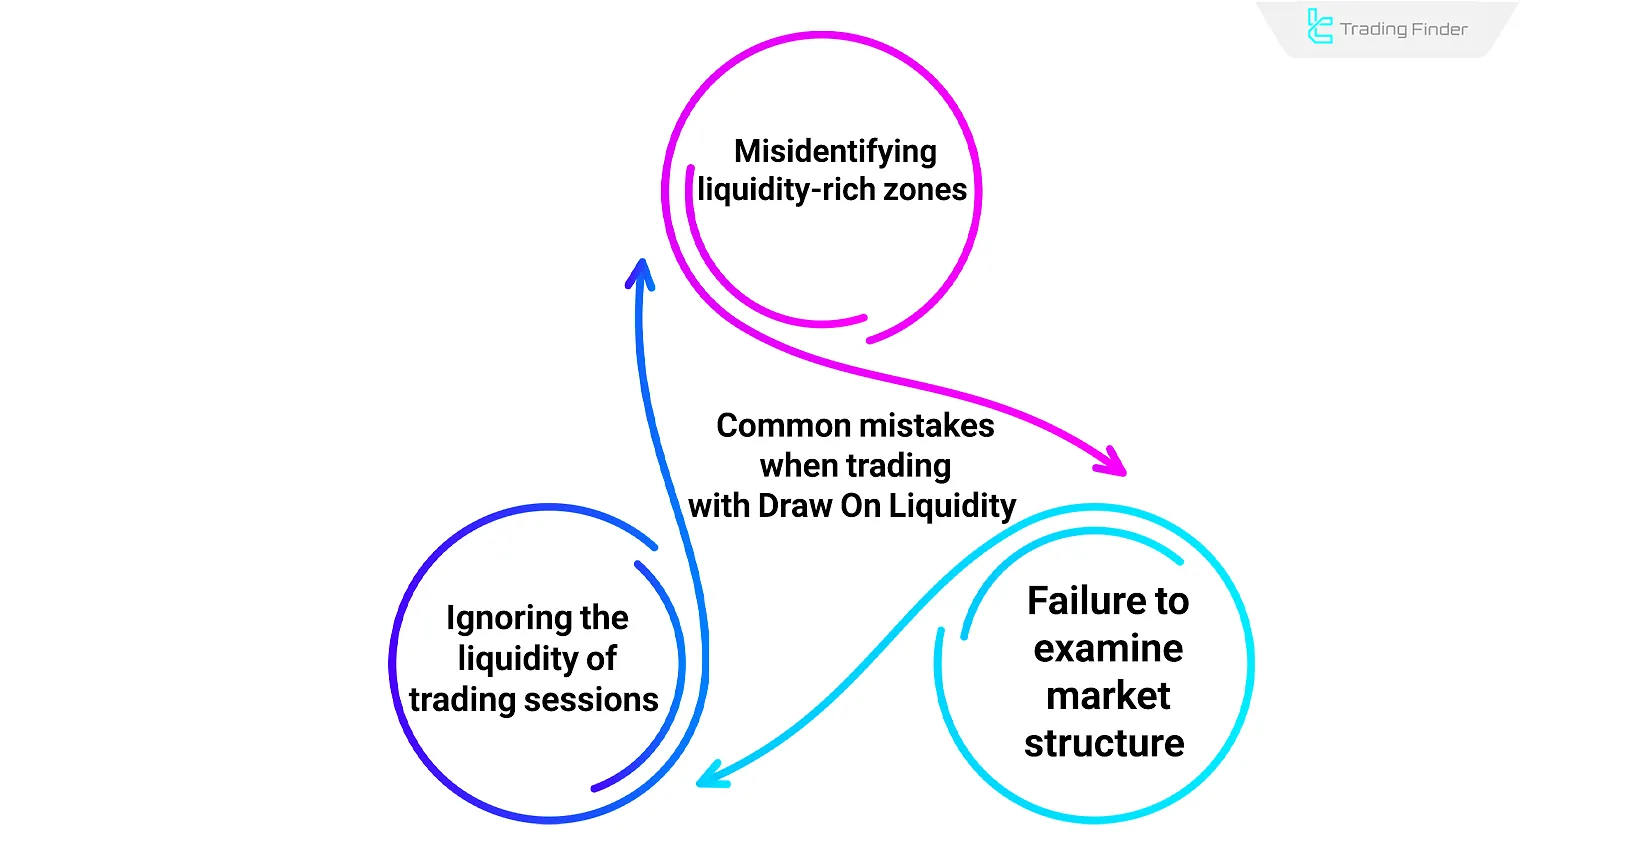
Common Mistakes in Draw On Liquidity
Despite ICT’s effectiveness, draw on liquidity ict can fail if traders misidentify liquidity areas or ignore risk management, lowering the win rate.
Common mistakes when trading with Draw On Liquidity (DOL):
- Mislabeling zones as “liquidity-rich” when they’re merely congested areas without real resting orders;
- Skipping market structure context: ignoring the prevailing trend or macro data can invalidate a DOL setup;
- Overlooking session-based liquidity: major moves often occur in the London and New York sessions; outside these, ambitious take-profit targets are less likely to be reached.
With the TradingFinder Liquidity Screener, you can scan zones likely to be targeted for Draw On Liquidity (DOL).
Liquidity Finder Indicator
The Liquidity Finder is an advanced indicator designed for traders working with ICT and Smart Money concepts.
Its main purpose is to highlight zones where retail stop-losses and order clusters accumulate, revealing how institutional players are likely positioned.
These zones often serve as magnets for price, generating strong movements once liquidity is captured.
On the chart, the Draw On Liquidity Indicator plots dashed liquidity lines that outline key areas of interest. These levels frequently emerge above Double or Triple Tops, below Double or Triple Bottoms, and around major bullish or bearish trendlines.
When price sweeps through such zones in combination with a liquidity grab or stop-hunt event, it can indicate a possible trend reversal or a major structural shift.
The indicator is not limited to one asset class. It is widely used across forex pairs, cryptocurrencies, stocks, and commodities, making it versatile for traders in different markets.
It also fits well into both intraday approaches and multi-timeframe strategies, where liquidity dynamics are crucial for precision entries and exits.
Case studies on pairs such as USD/JPY in an uptrend and BNB/USDT in a downtrend demonstrate how price frequently changes behavior after a liquidity sweep has taken place.
Customization is another strength of Liquidity Finder. Traders can adjust settings such as sensitivity of static versus dynamic liquidity lines, pivot periods, and the visibility of upper and lower levels. These options allow users to align the indicator with their personal trading style.
As a core ICT-related indicator on TradingView, Liquidity Finder enhances traditional technical analysis by mapping liquidity zones and decoding market structure—simply add the Liquidity Finder indicator in TradingView to spot high-probability setups with a professional edge.
Conclusion
In ICT style, Draw On Liquidity (DOL) moves refers to price being pulled toward high-liquidity zones. Identifying areas such as old highs and lows, equal highs and lows, and fair value gaps (FVG) is essential for analyzing DOL setups.
Although DOL strategies offer more accurate entries, they also carry challenges such as fake breakouts and the necessity of a deep understanding of order flow.


