


Dual Candlestick Patterns represent potential trend reversals in the market based on the relationship between two adjacent candles. Traders can use these two candlestick patterns to confirm entry and exit points in trades.
Compared to single candlestick patterns, a dual candlestick pattern provides more information, but it requires more time to identify and confirm.
Traders usually analyze dual candlestick patterns such as the Engulfing, Dark Cloud Cover, or Piercing Pattern alongside support and resistance levels and confirmation indicators to more accurately assess the probability of a trend reversal or continuation.
What Are Dual Candlestick Patterns?
Dual candlestick patterns are formations consisting of two candlesticks that convey valuable information about price behavior. In technical analysis, their interpretation depends on how the two candles are positioned relative to each other.
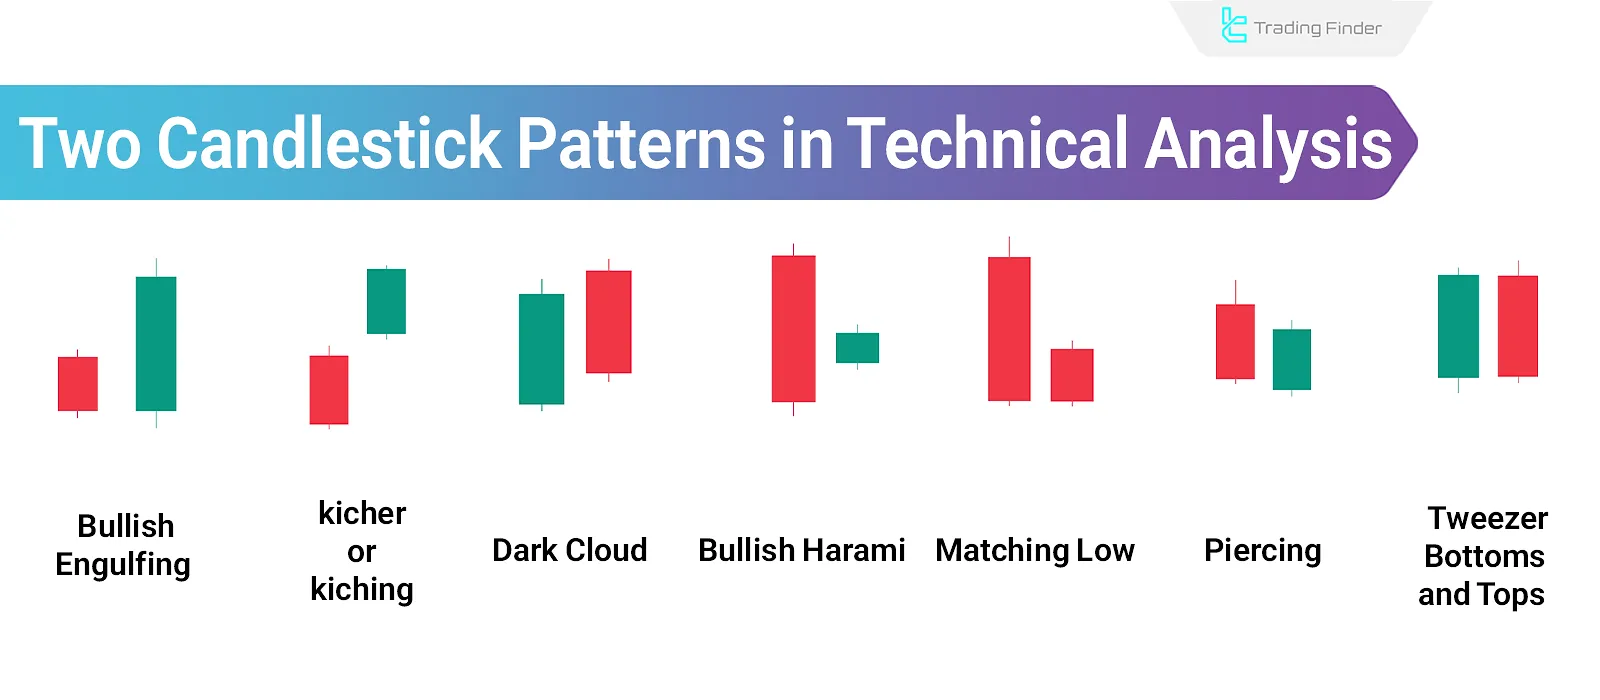
Types of Dual Candlestick Patterns
Bullish and bearish dual candlestick patterns have different interpretations depending on the type of both candles and how they are positioned next to each other, providing various types of market information.
These patterns come in several forms, which will be examined in detail below.
Types of Dual Candlestick Patterns:
- Bullish Engulfing
- Bearish Engulfing
- Kicking (Kicher)
- Dark Cloud Cover
- Bullish Harami
- Bearish Harami
- Matching Low
- Piercing Pattern
- Tweezer Bottoms and Tops
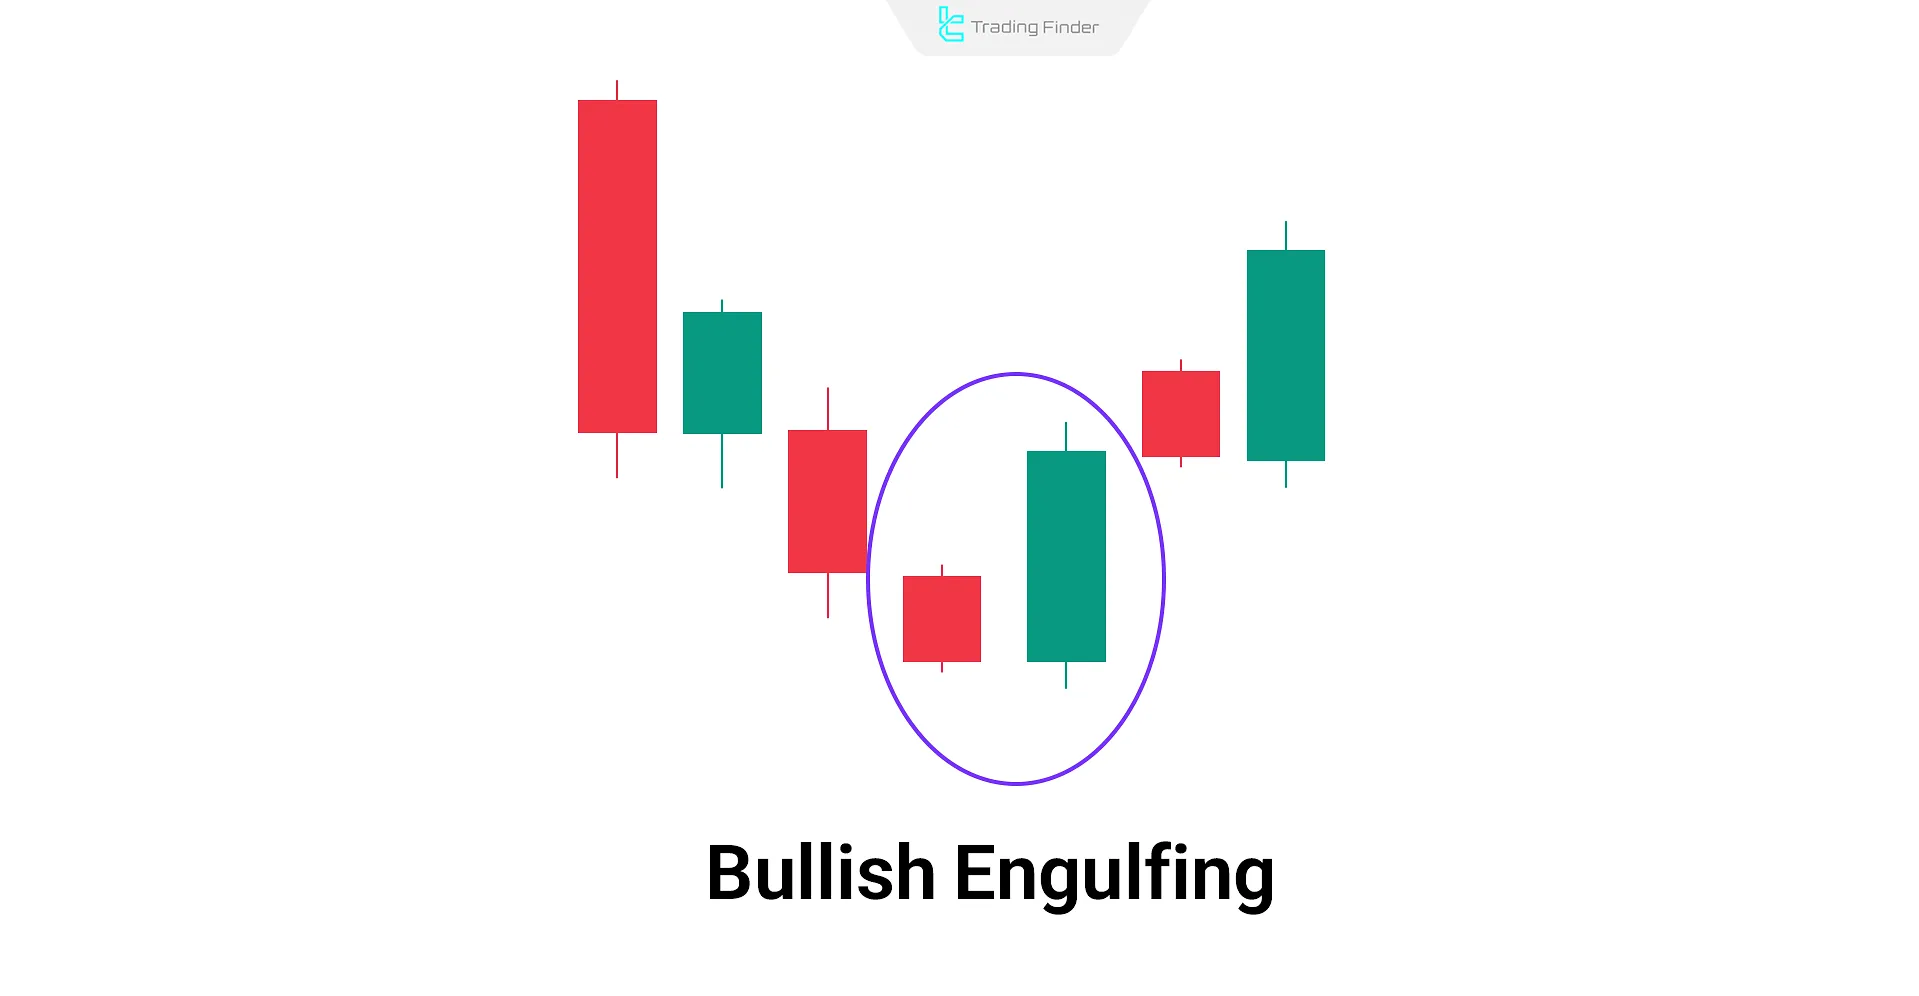
Bullish Engulfing Pattern
The Bullish Engulfing pattern is a reversal pattern usually found at the end of a downtrend. It is often ignored in uptrends.
Characteristics of Bullish Engulfing
This dual candlestick pattern consists of a small bearish candle followed by a large bullish candle that completely engulfs the first one. The shorter the bearish candle and the larger the bullish one, the more valid the signal.
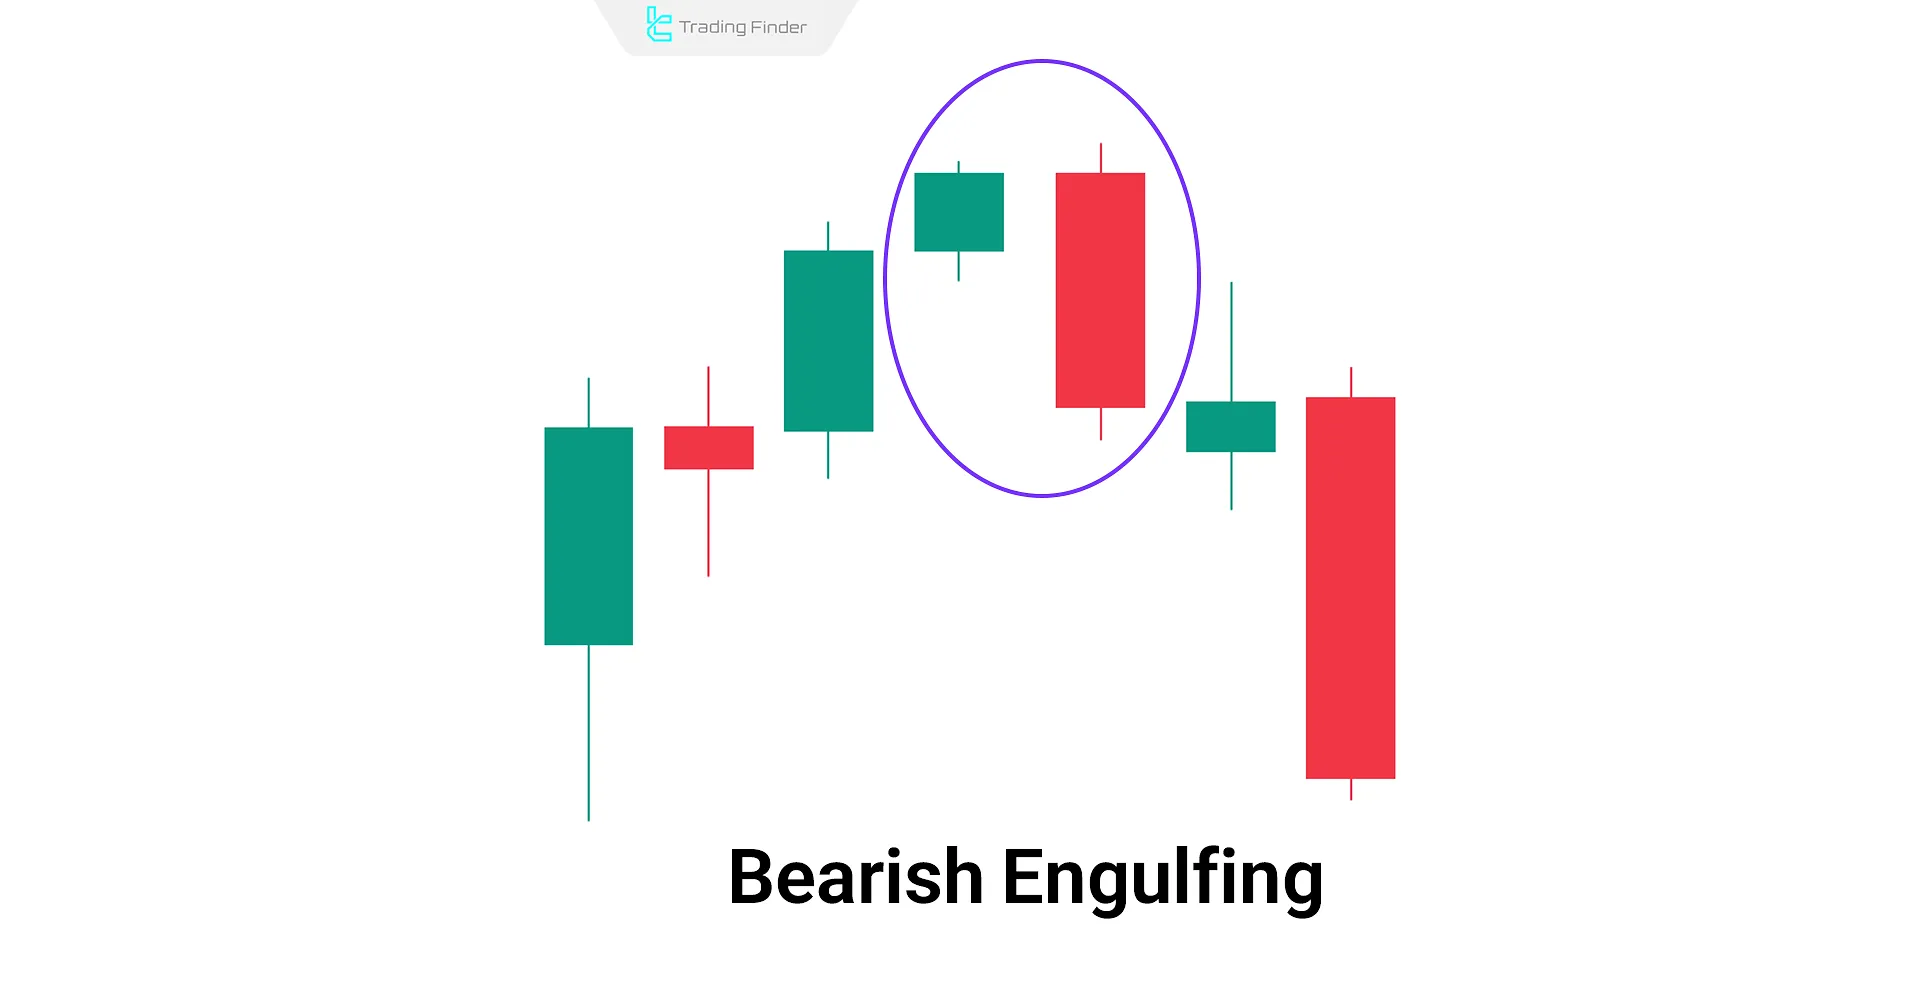
Bearish Engulfing Pattern
The Bearish Engulfing is the opposite of the bullish variation. It typically appears at the end of an uptrend and is often overlooked in downtrends.
Characteristics of Bearish Engulfing
It includes a small bullish candle followed by a strong bearish candle that fully engulfs the former. The smaller the bullish candle and the larger the bearish one, the stronger the pattern.
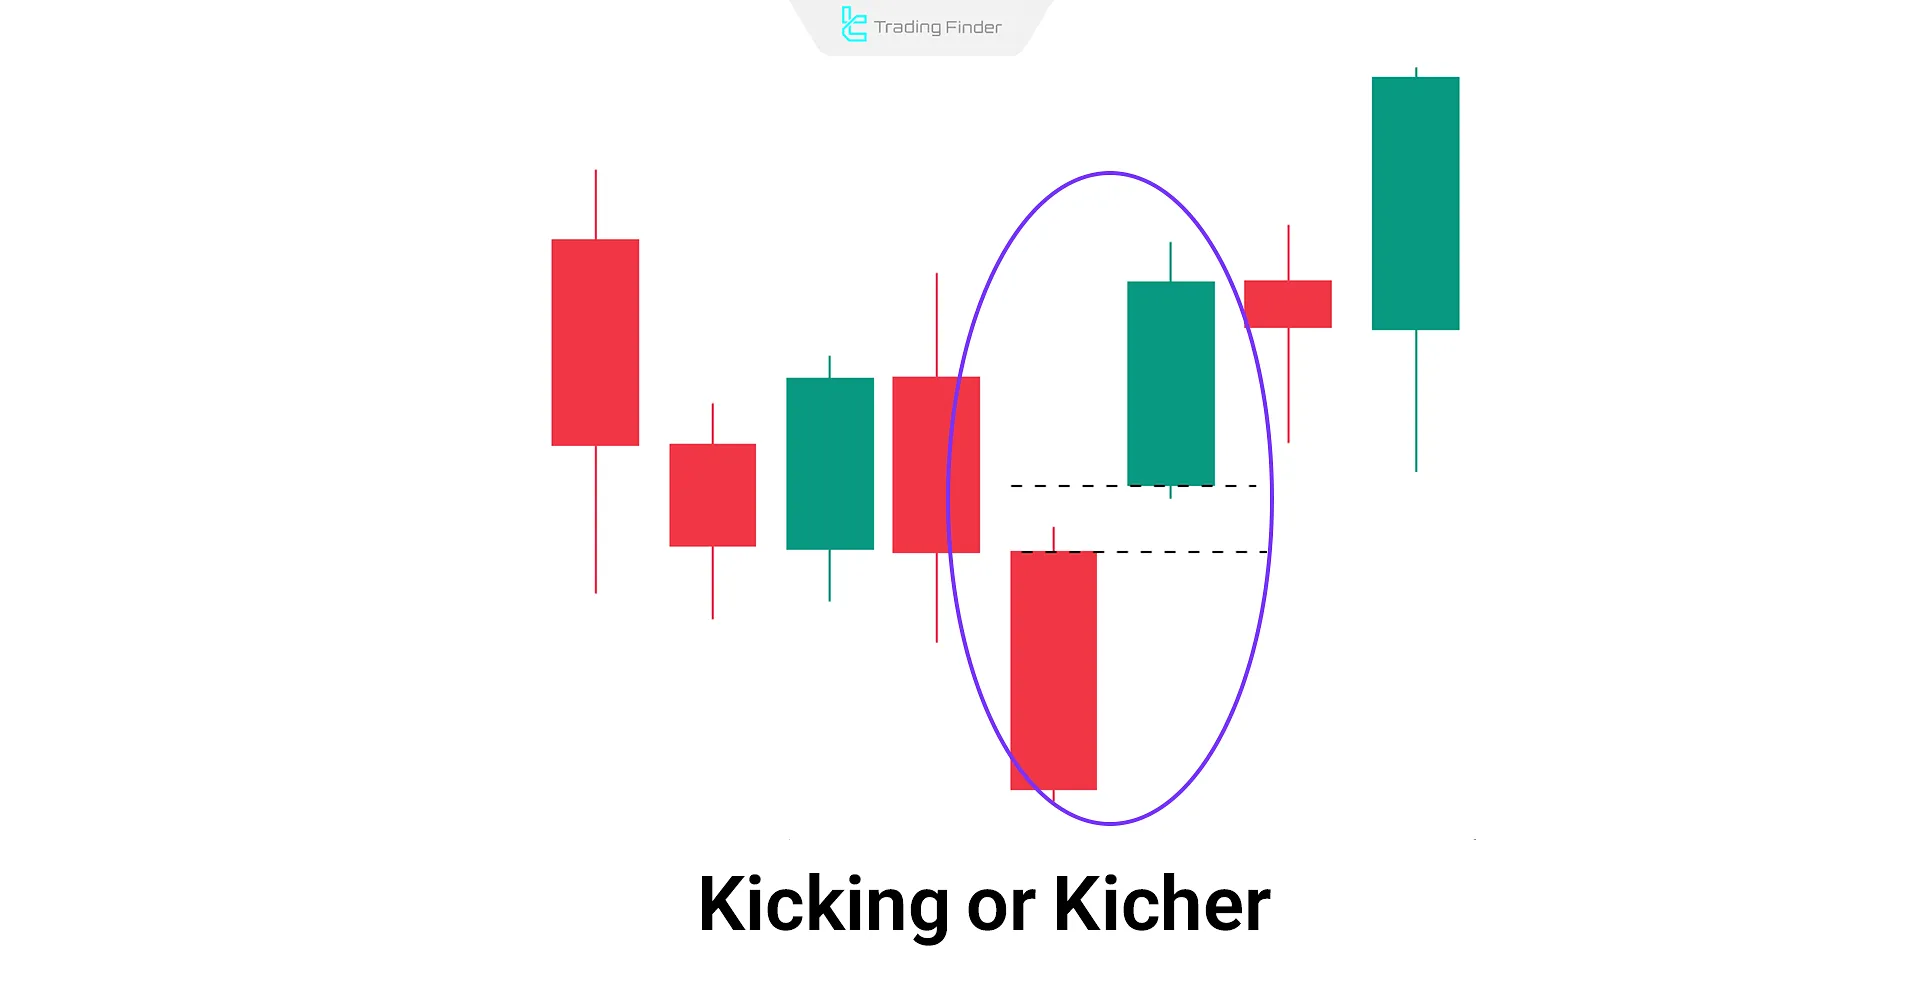
Kicking (Kicher) Pattern
The Kicking (or Kicher) pattern is a dual candlestickreversalsetup that can appear in various stages of a trend. It indicates a reversal bearish in an uptrend and bullish in a downtrend.
Characteristics of Kicking
This pattern includes a candle in the direction of the trend followed by a strong opposite-direction candle that gaps significantly up or down. This emotional shift in buying or selling often reflects a potentialreversal, which can catch traders off guard.
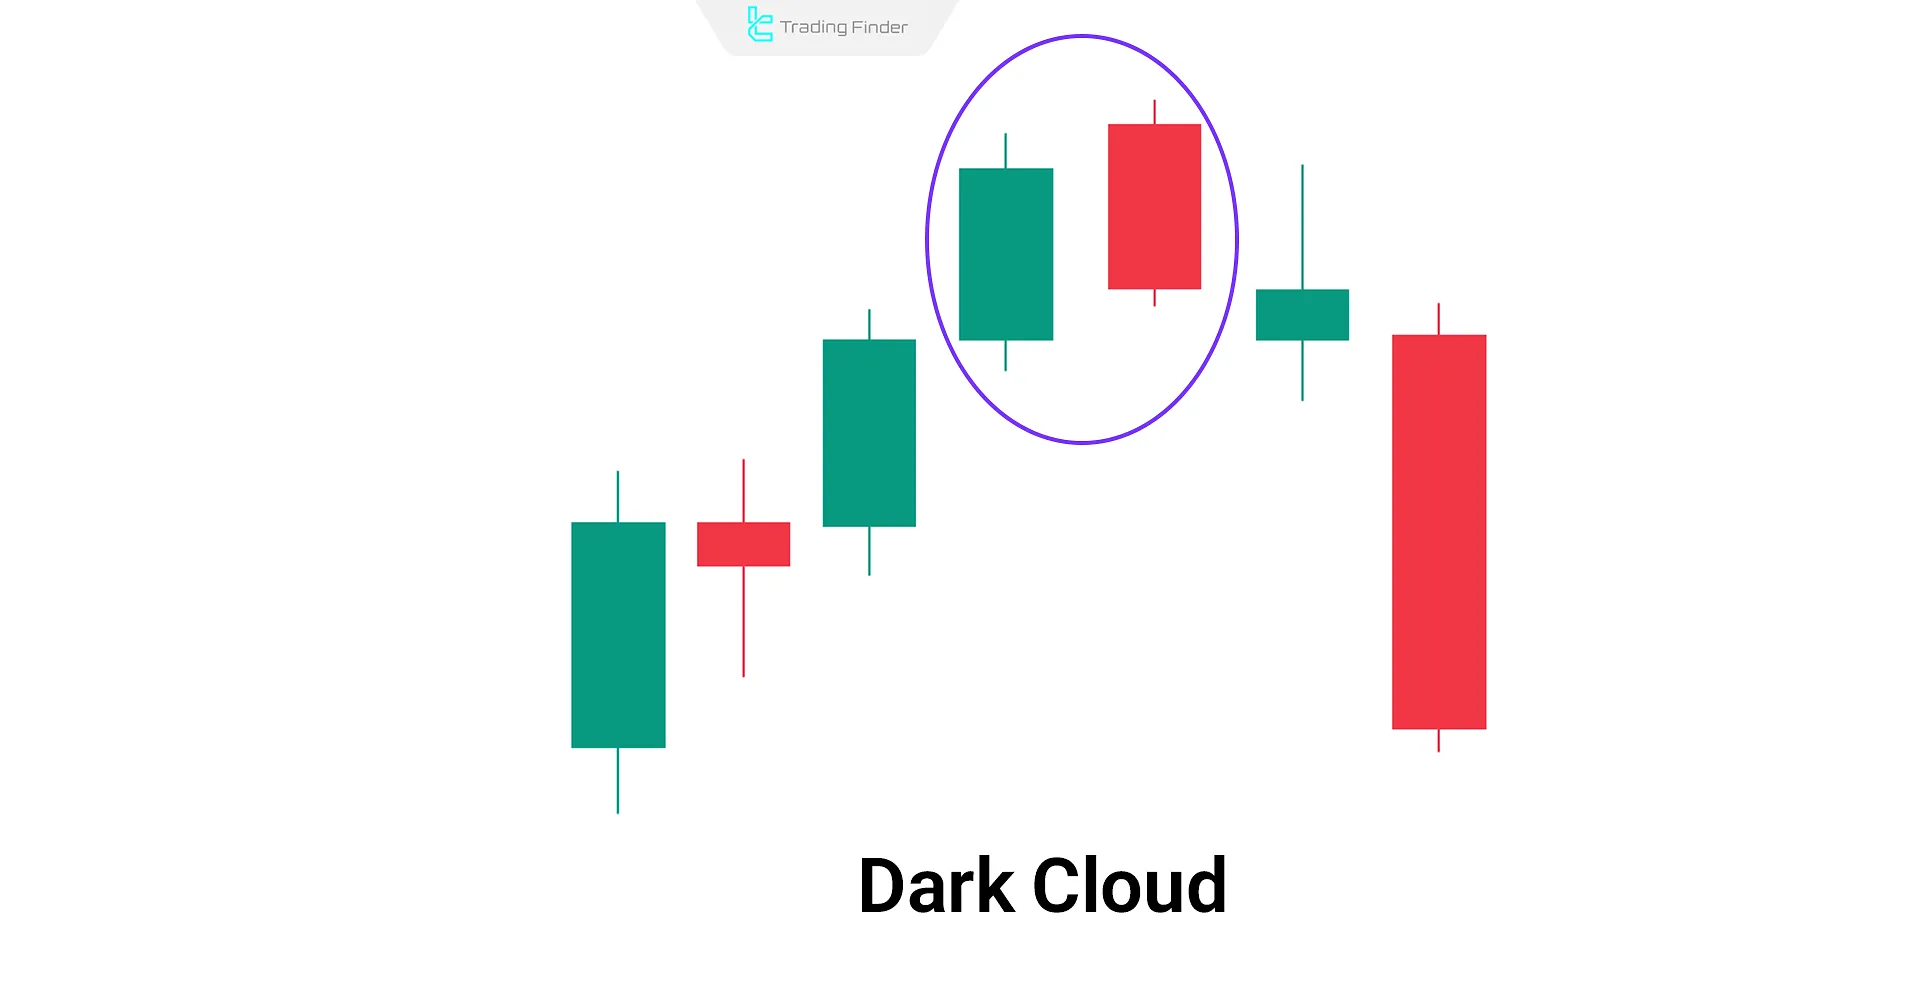
Dark Cloud Cover Pattern
The Dark Cloud Cover is a bearish reversal pattern formed after an uptrend. It is a signal to sell, but is typically ignored in downtrends.
Characteristics of Dark Cloud Cover
The first candle is bullish, and the second opens above the previous close but closes well below the midpoint of the first candle, signaling intensesellingpressure.
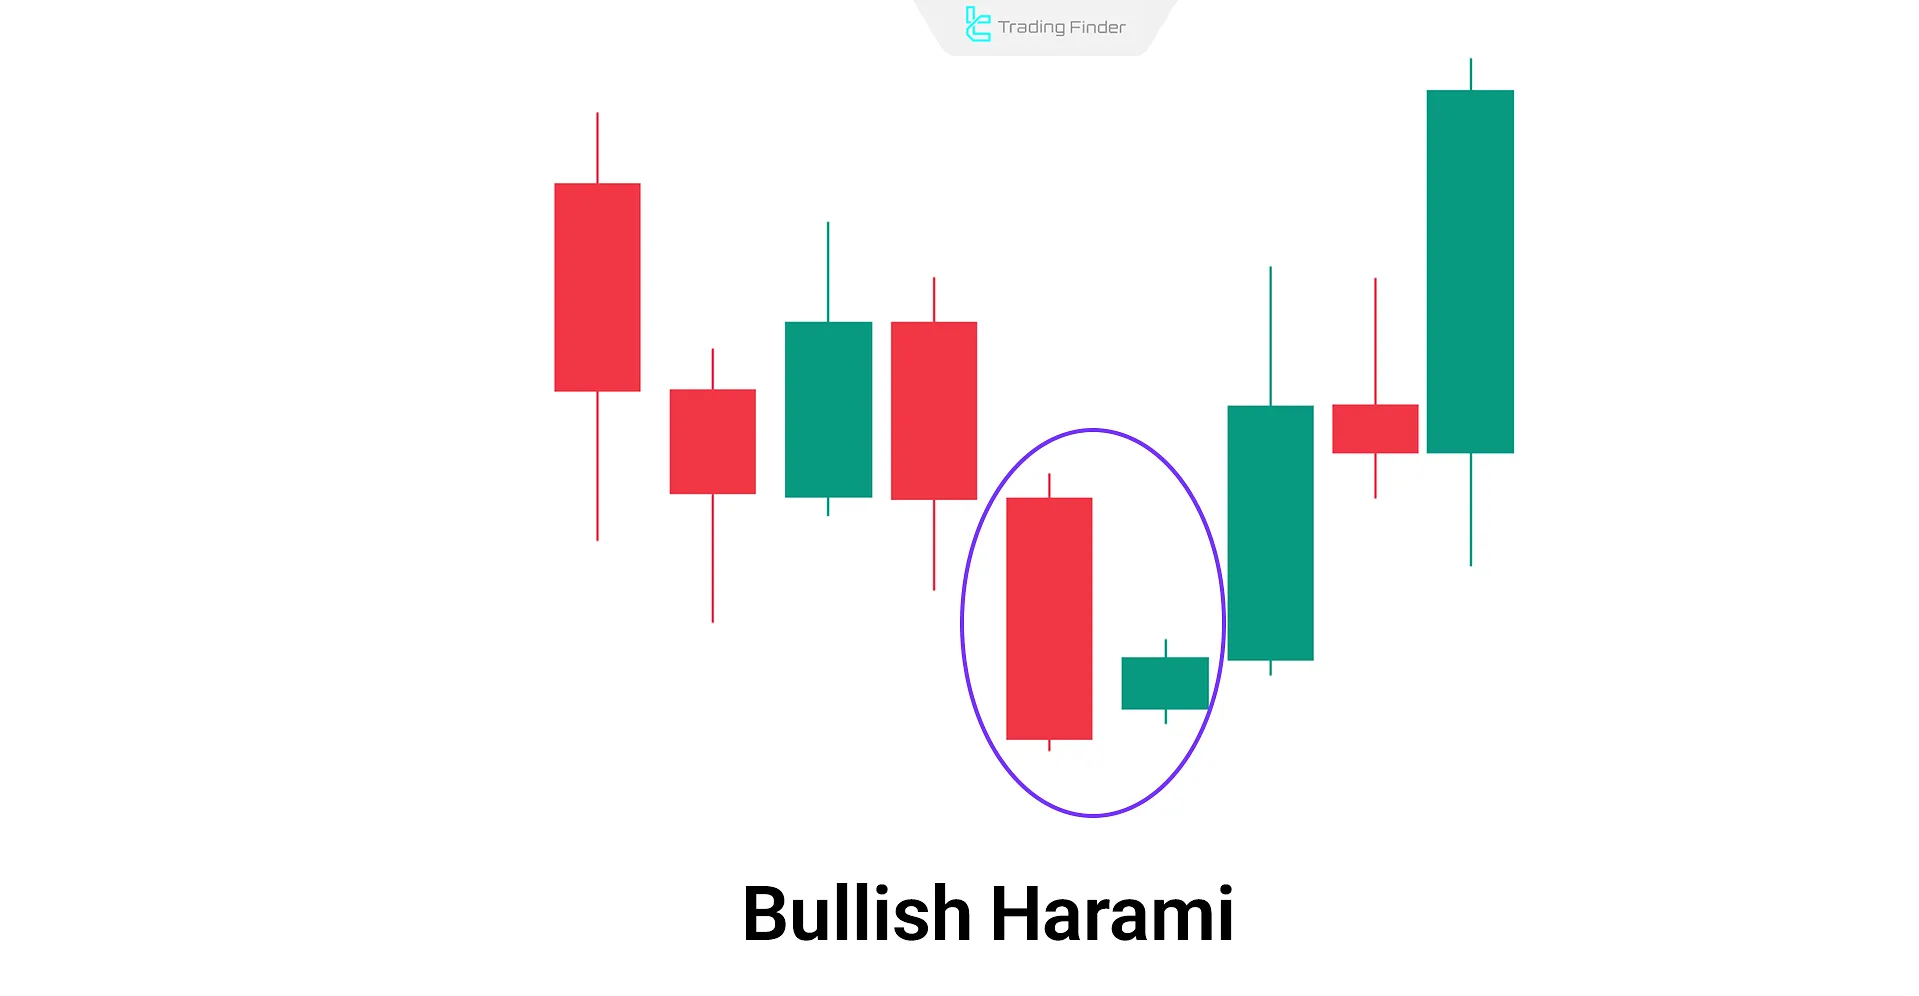
Bullish Harami Pattern
The Bullish Harami shows market stabilization and potential bullish reversal in a downtrend. It requires confirmation before entering a trade.
Characteristics Bullish Harami
A small bullish candle is contained within the body of a larger bearish candle. The second candle does not exceed the range of the first.
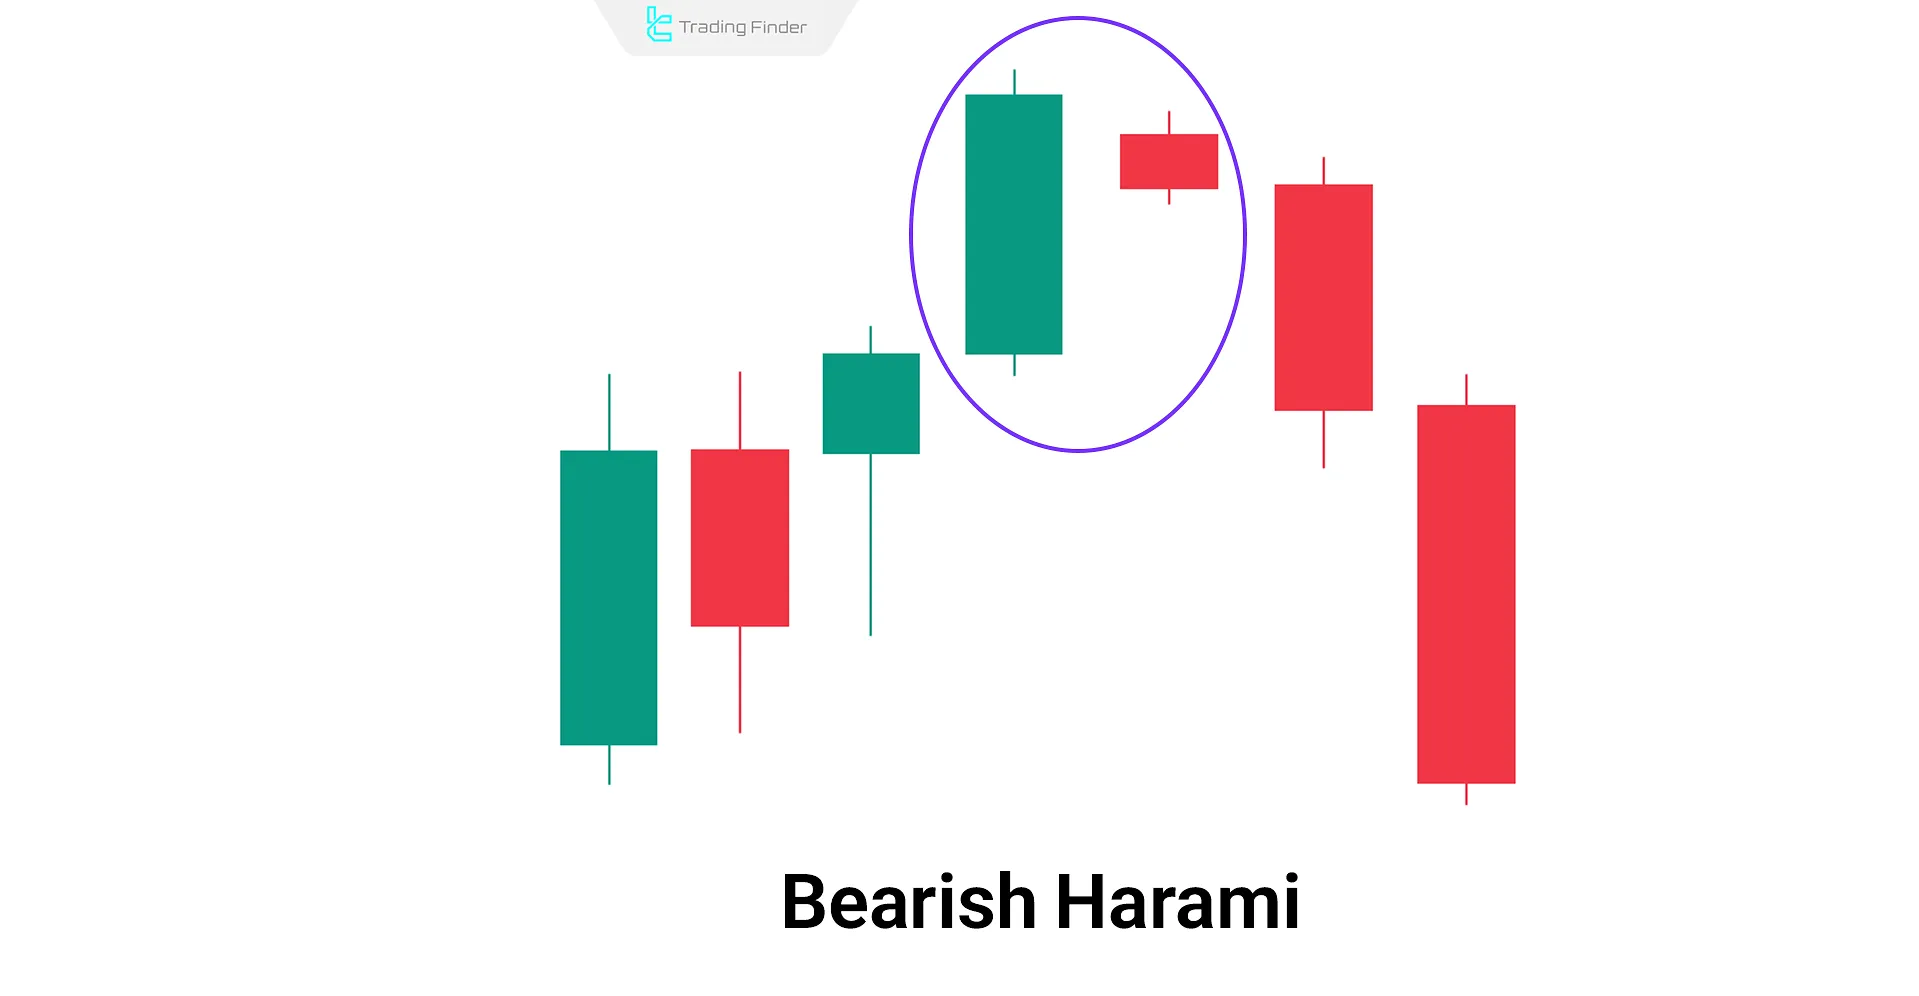
Bearish Harami Pattern
The Bearish Harami is a reversal signal opposite the bullish version. It's generally ignored in downtrends but is valid at the top of an uptrend.
Characteristics Bearish Harami
This two-candlestick pattern features a large bullish candle followed by a smaller bearish candle entirely within the prior candle’s body.
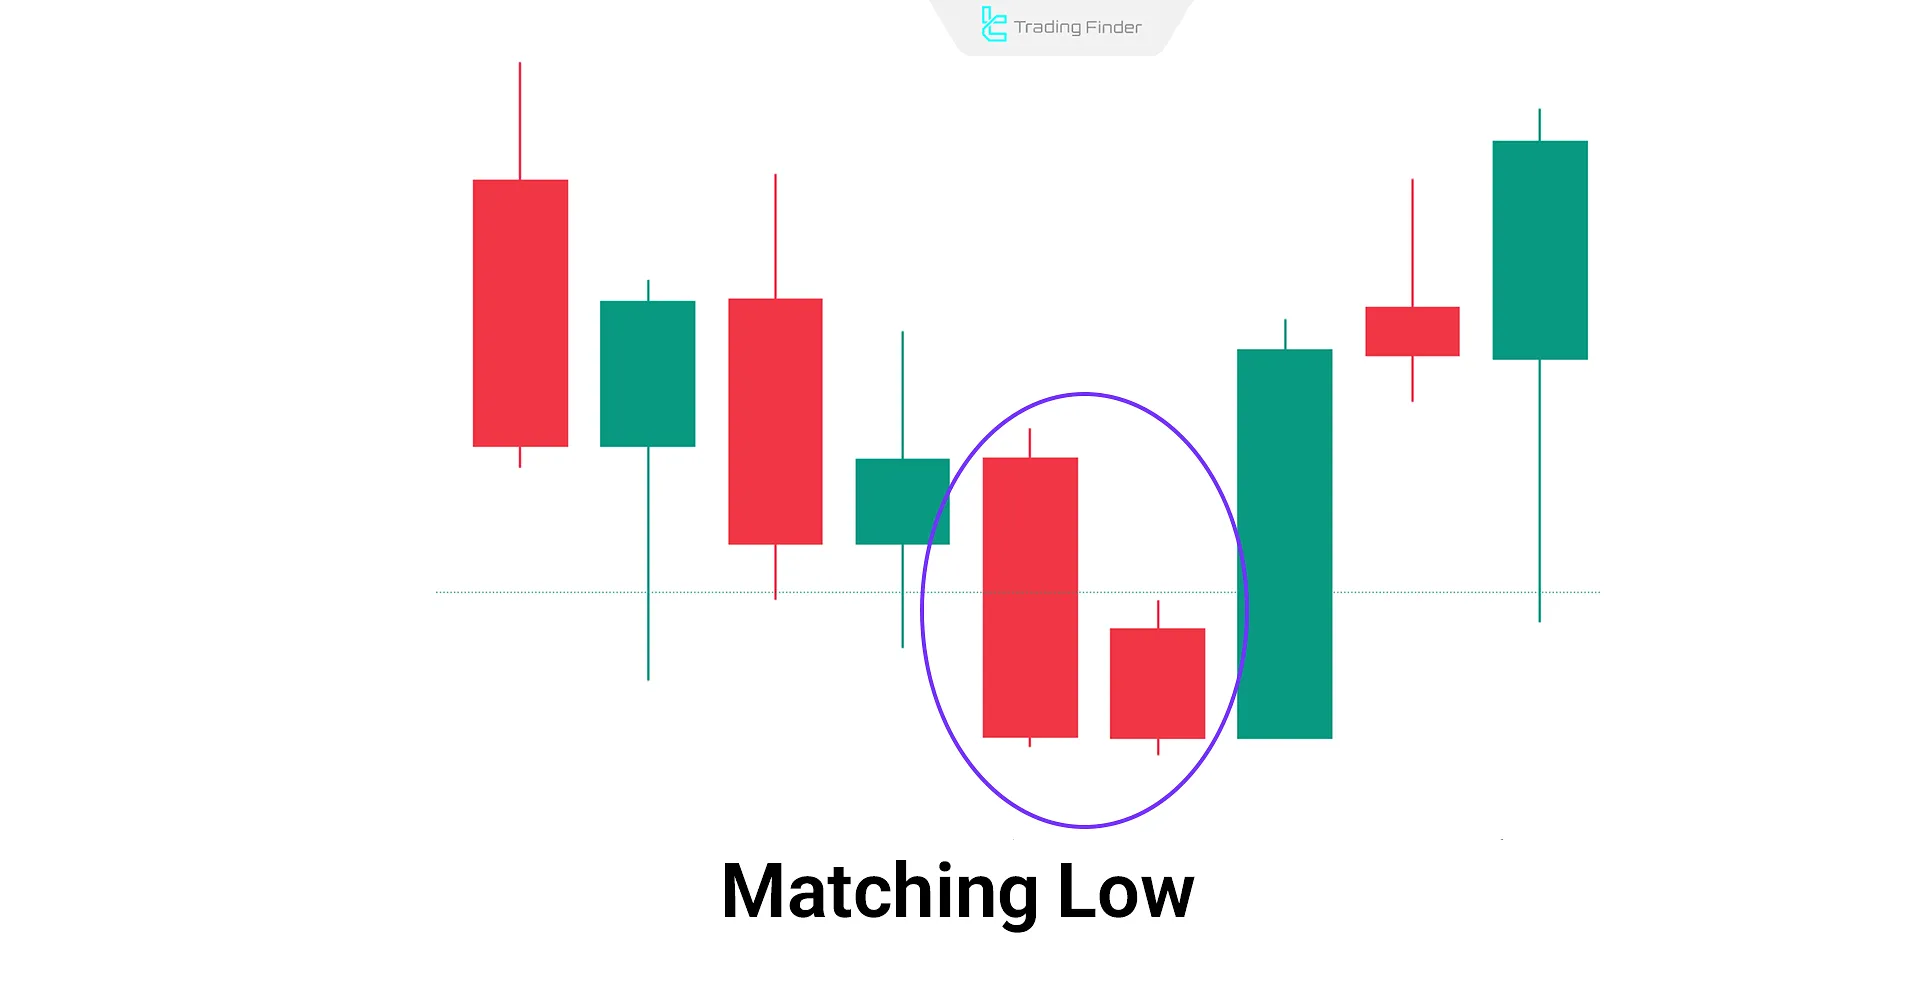
Matching Low Pattern
The Matching Low pattern indicates short-term support and potential price bounce, often forming at market bottoms.
Characteristics of Matching Low
Both candles are bearish, but the second opens higher and closes at the same level as the first. This setup shows buyer support at a key level.
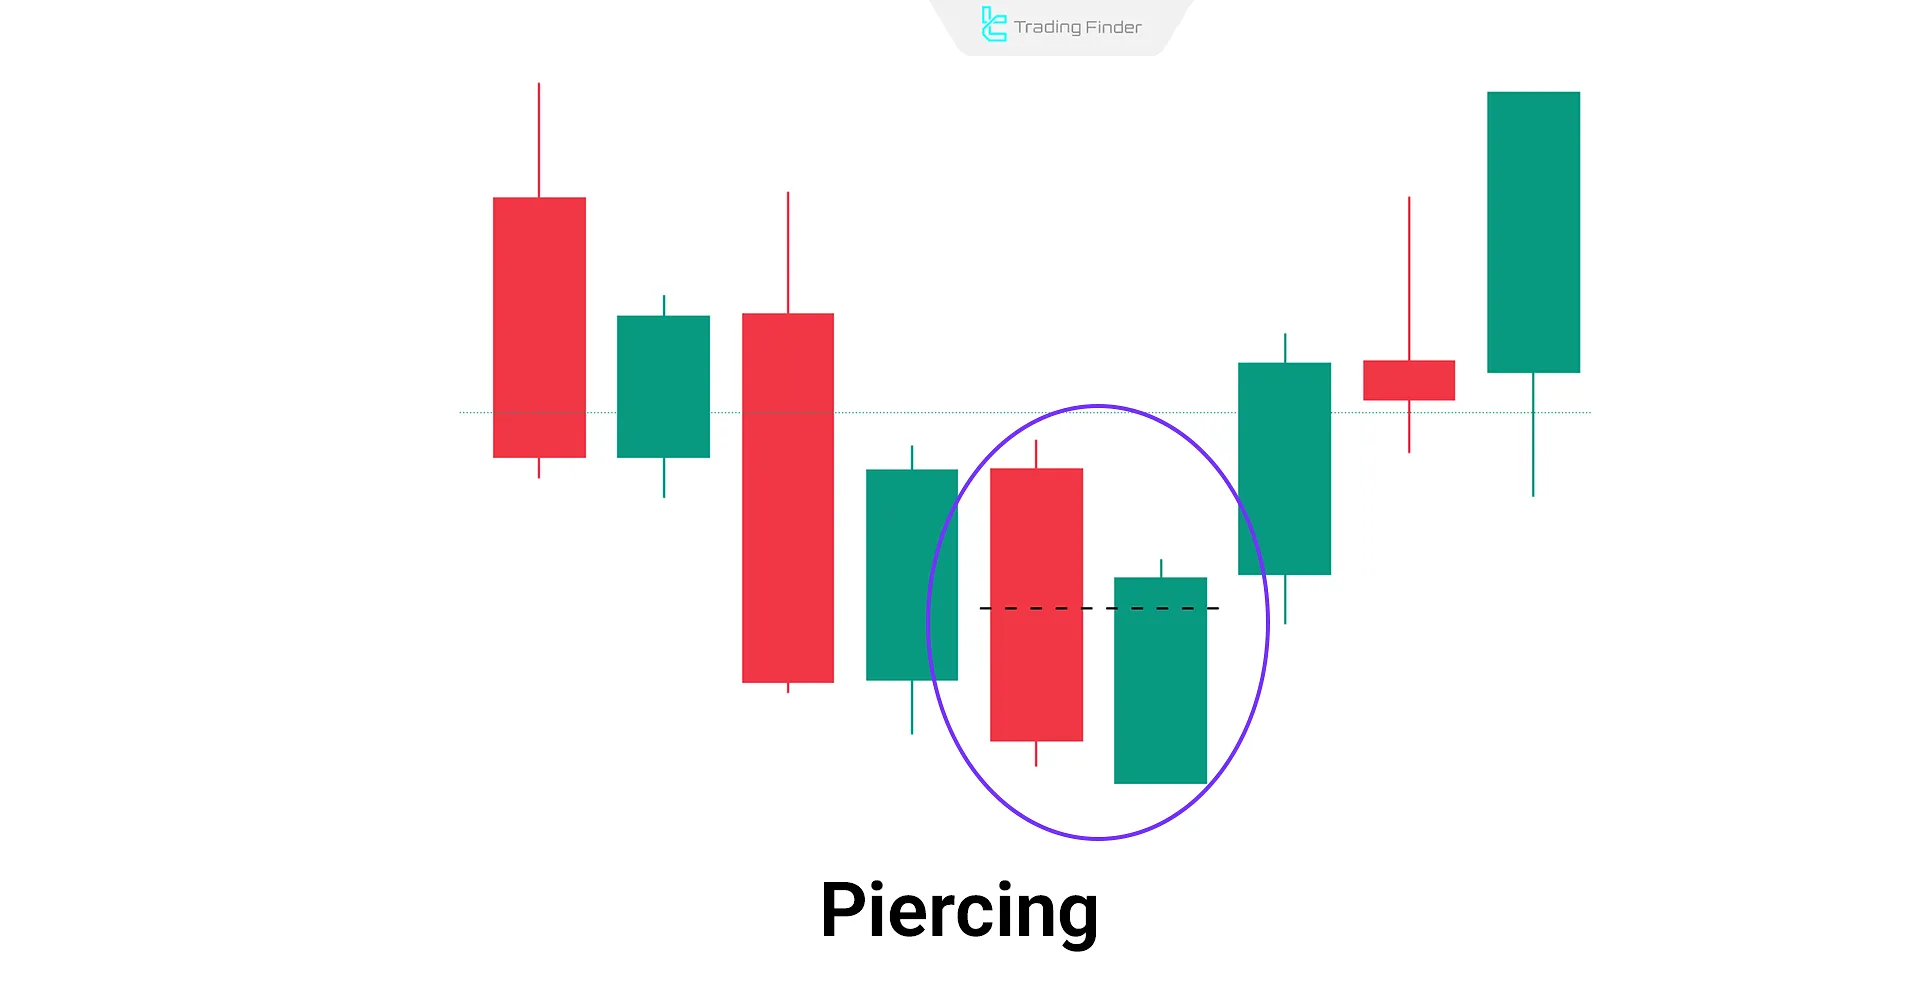
Piercing Pattern
The Piercing pattern signals a bullish reversal and usually appears at the end of a downtrend.
Characteristics of Piercing
The first candle is bearish. The second opens below the first’s close but closes above the midpoint of the first candle.
- Second candle open: Below the first candle’s close
- Second candle close: Above the midpoint of the first candle
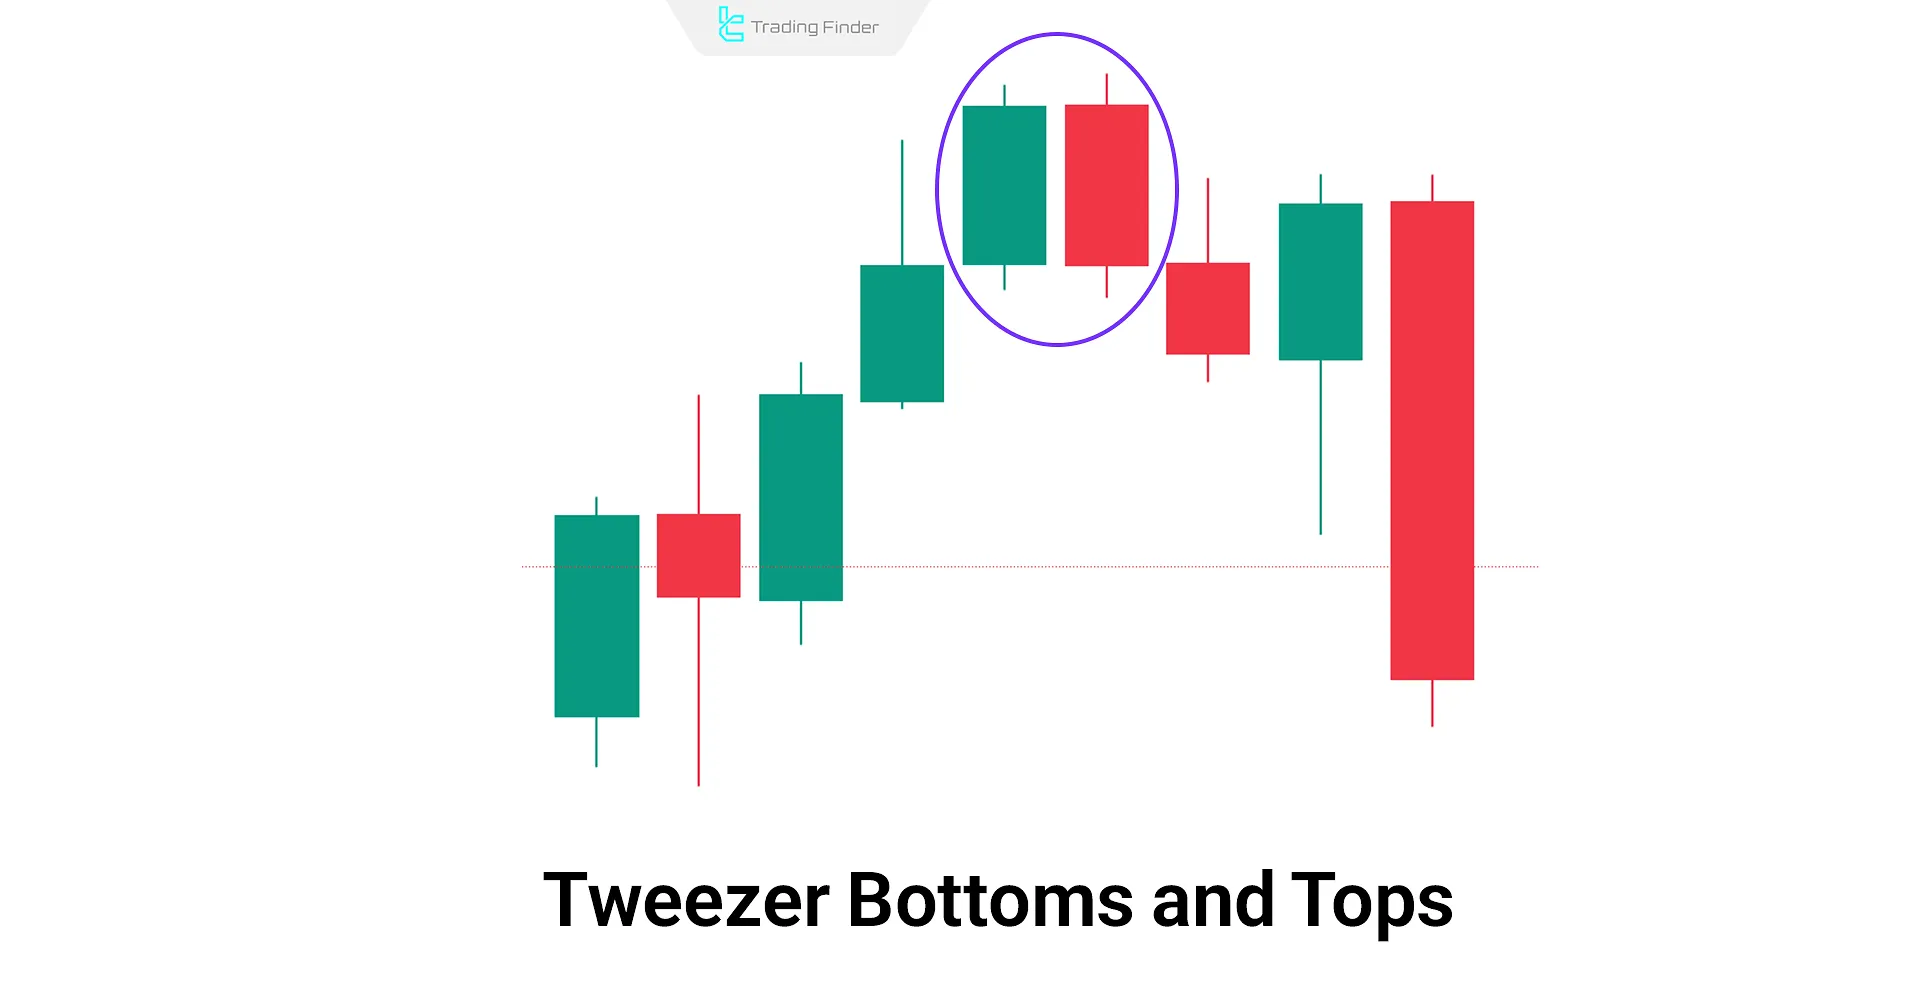
Tweezer Bottoms and Tops Pattern
Tweezer patterns typically appear at the top or bottom of trends. At the tops, they indicate weakening buyers, while at the bottoms, they reflect growing buyer strength.
Characteristics of Tweezer Bottoms and Tops
The highs or lows of both candles are nearly identical, although the candle types differ; at the tops, it is bullish and then bearish. At the bottom, it is bearish and then bullish.
Pros and Cons of Dual Candlestick Patterns
Proper use of Dual Candlestick Patterns requires awareness of their strengths and weaknesses, such as lower prediction accuracy.
Pros | Cons |
Identify potential trend reversals | Lower accuracy in predicting future movement |
Improve market analysis and forecasting | Possible misinterpretation |
Confirm entry opportunities | Require experience and knowledge |
Validating Dual Candlestick Patterns with Other Tools
To achieve more accurate analysis, dual candlestick patterns should be examined alongside supporting tools such as support and resistance lines, the RSI indicator, and moving averages.
When a bullish engulfing pattern appears near a support level along with a positive divergence on RSI, the probability of a trend reversal increases significantly.
In contrast, when such patterns form in neutral zones, their signal reliability decreases and they often have limited analytical value.
Traders who wish to gain a deeper understanding of dual candlestick patterns can also refer to the educational video on the Anas Ali YouTube channel.
Application of Dual Candlestick Patterns in Different Markets (Forex, Stock, Crypto)
In stock, forex, and cryptocurrency markets, dual candlestick patterns serve as tools for identifying optimal entry and exit points.
These patterns are most reliable when they form near key support or resistance levels and are confirmed by trading volume or aligned indicators.
- Forex: They perform more accurately in high-volume currency pairs such as EUR/USD and GBP/USD, offering more reliable signals on the 4-hour timeframe;
- Stock Market: These patterns often appear at medium-term reversal points following corrective phases and indicate the likely direction of the next trend;
- Cryptocurrency Market: Due to high volatility, using volume confirmation and divergence analysis simultaneously is essential to reduce the likelihood of false signals.
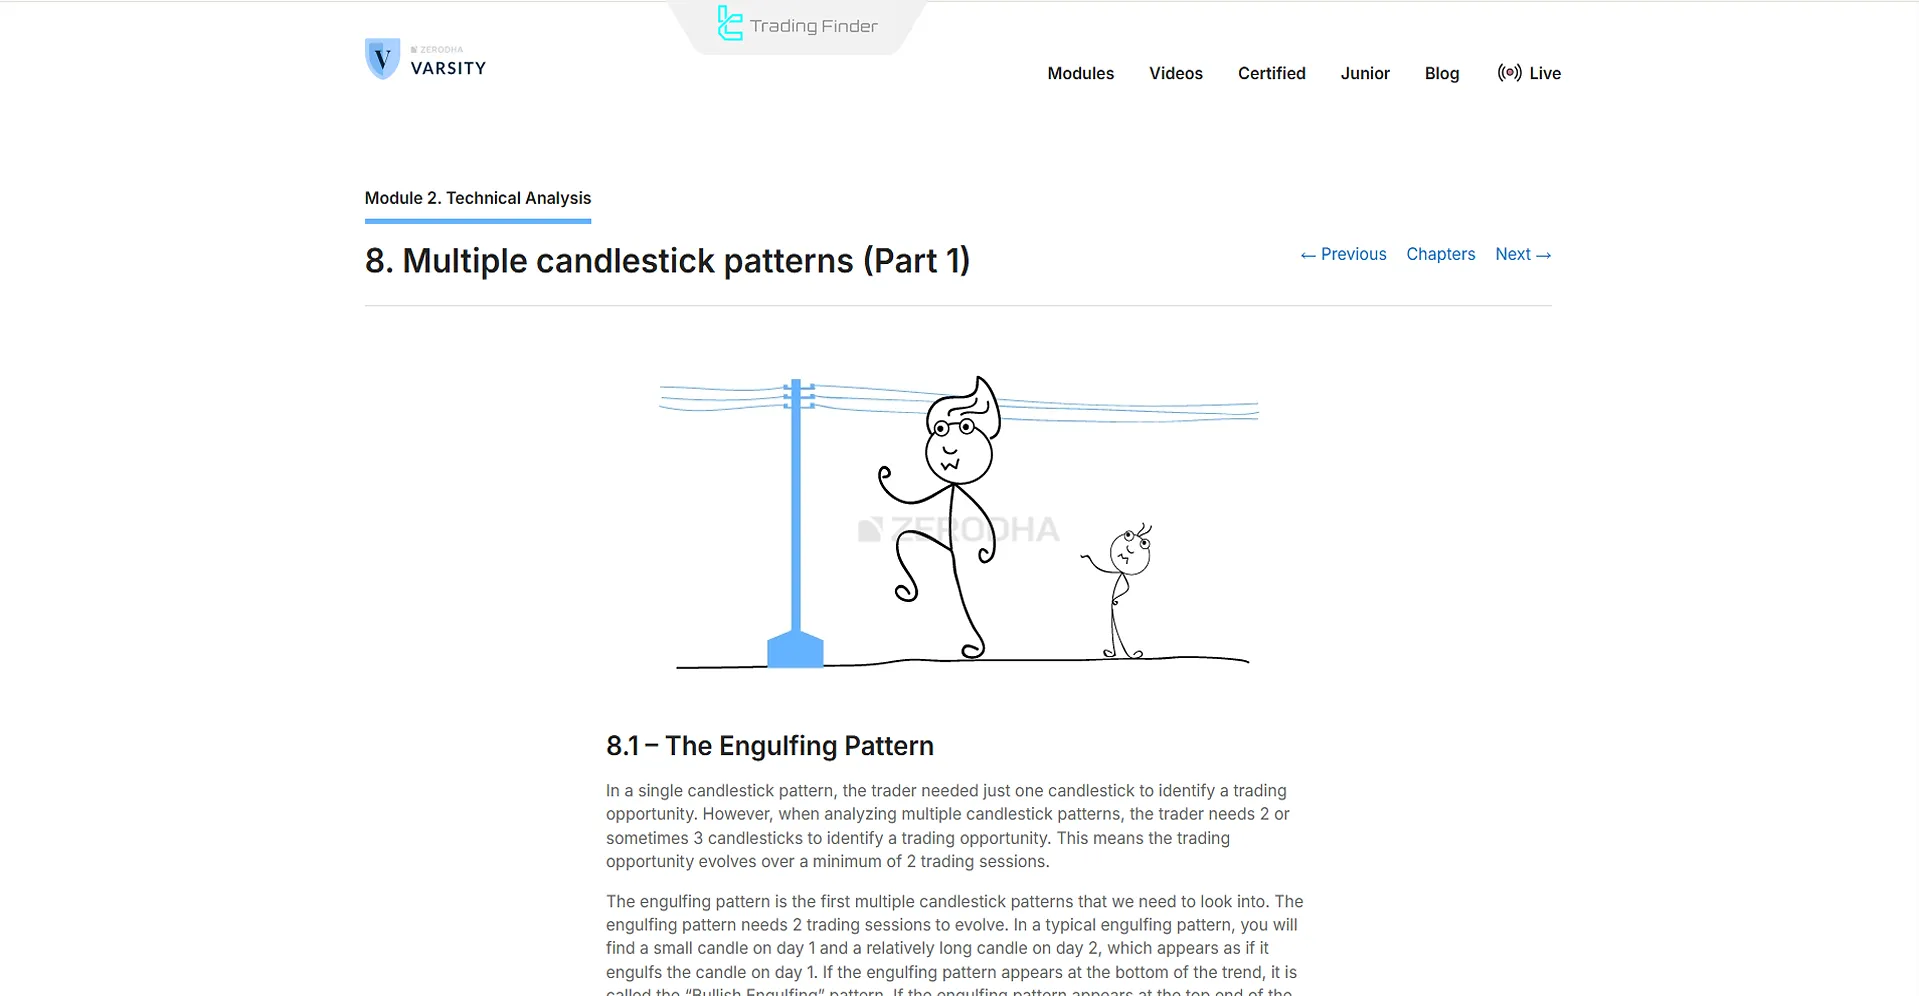
The article multi candlestick pattern tutorial on zerodha.com provides a professional explanation of the practical applications of these patterns, and interested readers can refer to it for more information.
Difference Between Reversal and Continuation Dual Candlestick Patterns
Most dual candlestick patterns are of a reversal nature, such as the bullish engulfing and bearish engulfing patterns; however, some of them can also act as trend continuation patterns.
The location where the pattern forms relative to the overall market trend is highly important because the same pattern may convey completely different meanings when it appears near resistance or support levels.
Therefore, analyzing these patterns should always be accompanied by trend analysis, trading volume, and other technical tools to obtain more reliable signals.
The table below compares reversal and continuation dual candlestick patterns:
Reversal Dual Candlestick Patterns | Continuation Dual Candlestick Patterns |
Indicate a change in trend direction after formation | Indicate continuation of the existing trend after formation |
Examples include bullish and bearish engulfing | Examples show continued price movement in the main trend direction |
Form near key support or resistance areas | Form in the middle of an uptrend or downtrend |
Signal a market reversal from significant price levels | Signal confirmation of continued movement in the prevailing trend |
Require confirmation from volume and indicators | Require confirmation from breakouts or supportive trend volume |
More significant at the end of trends | More significant during consolidation or correction phases |
Higher risk of misinterpretation if trend context is ignored | More reliable when aligned with the overall trend structure |
Used to identify potential reversal entry or exit points | Used to identify opportunities to continue trading in the trend direction |
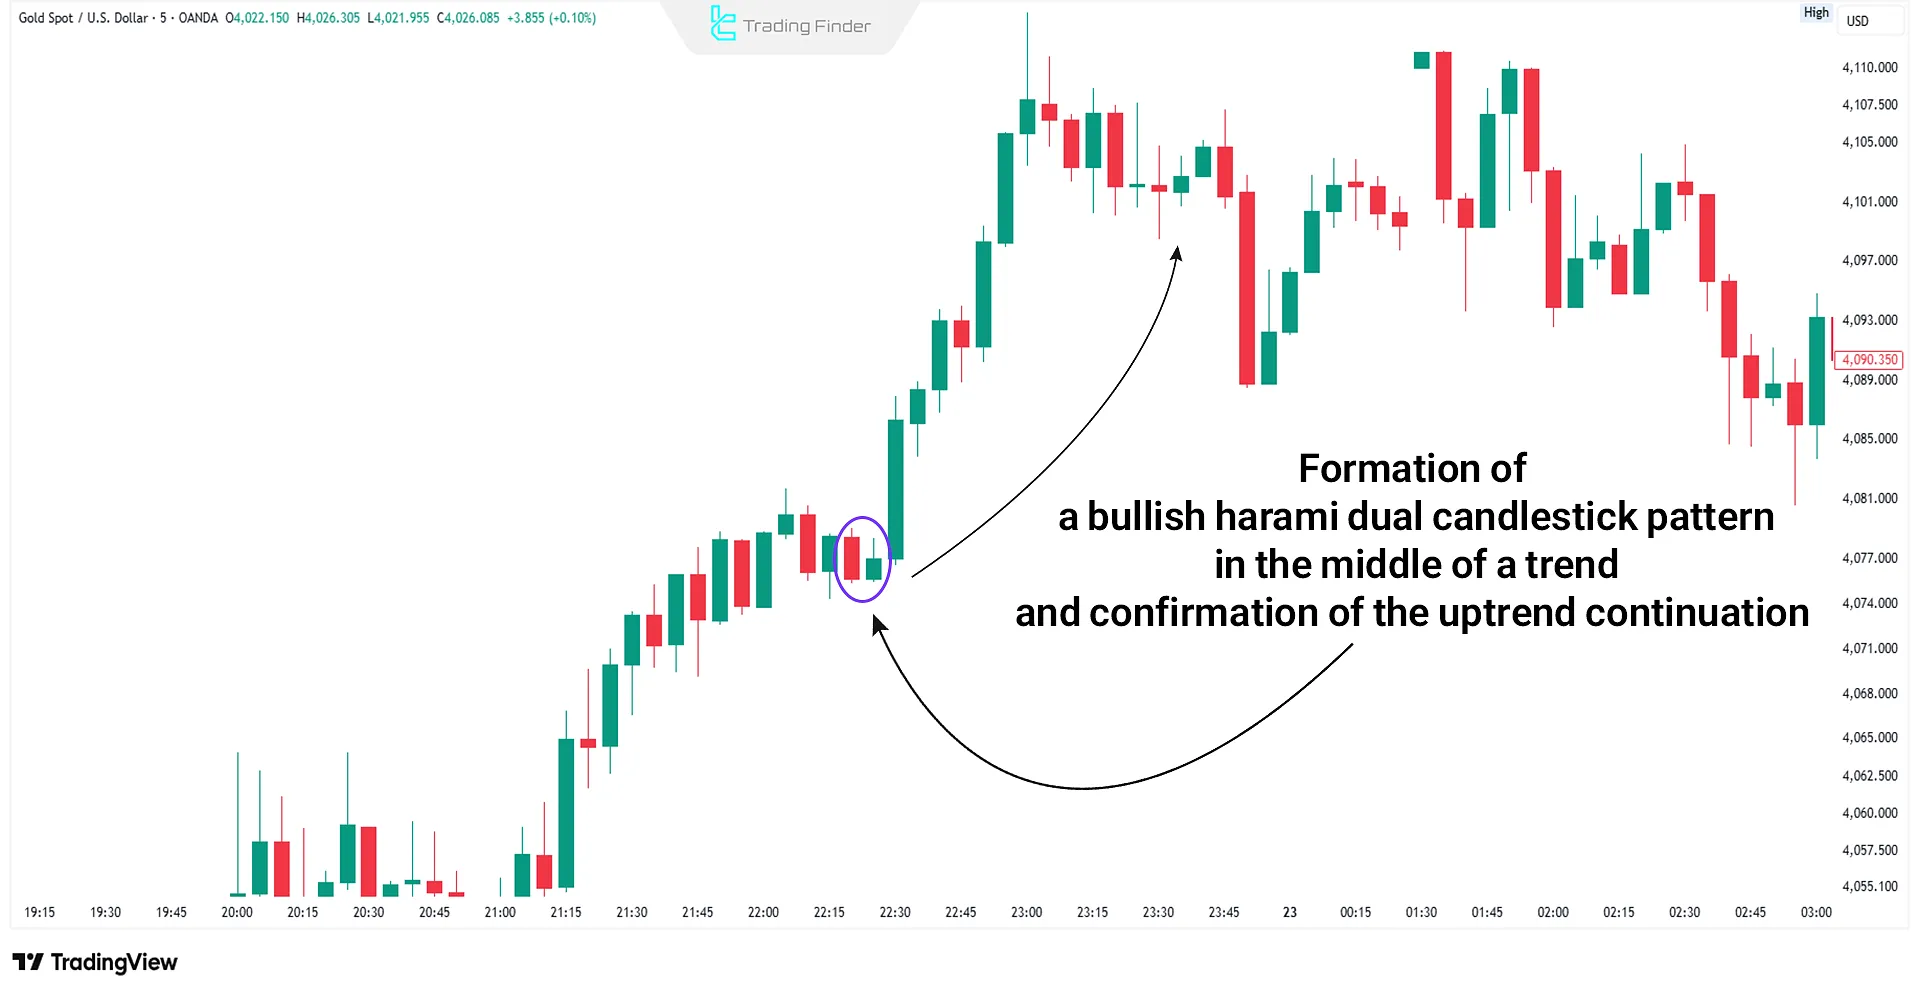
Example of the Difference Between Reversal and Continuation Dual Candlestick Patterns
At the end of a downtrend, a bullish engulfing pattern usually indicates a change in direction and the beginning of an upward movement.
However, if a bullish harami appears in the middle of an uptrend and the following candles confirm the upward move, it signals consolidation and continuation of the trend.
Comparison of Single, Dual, and Triple Candlestick Patterns
Candlestick patterns vary based on the number of candles involved, the information they convey, and their market application.
Comparison of Single-Candlestick, Double-Candlestick, and Triple-Candlestick Patterns:
Parameter | Single Candle | Dual Candlestick | Triple Candlestick |
Number of Candles | One | Two | Three |
Market Application | Quick trend reversal detection | Trend confirmation and entry points | Identifying potential tops/bottoms |
Analysis Speed | High | Medium | Low |
Predictive Power | Low | Medium | High |
Key Points in Identifying Dual Candlestick Patterns
Dual candlestick patterns only have significance under specific market conditions. The table below outlines the proper conditions for accurately identifying dual candlestick patterns based on different criteria:
Criteria | Key Points |
Location | Patterns are valid only in key price action zones (support, resistance, supply/demand, wave ends) and have low reliability in the middle of a trend |
Body & Shadows | In an Engulfing pattern, the second candle’s body must completely cover the first; shadows should align, and the second candle must be long and high-volume. Small bodies or doji formations indicate weak momentum |
Body Ratio | In a Bullish Engulfing pattern, the second body should be 1.3 to 2 times larger than the first; in a Bearish Engulfing pattern, 1.5 times or more |
Volume | The volume of the second candle should exceed the average of the last 5 to 10 candles |
Close Validation | In a bullish pattern, the closing price should be above the high of the first candle; in a bearish pattern, below the low |
Multi-timeframe | Observing the pattern on a lower timeframe and confirming it on a higher timeframe increases accuracy |
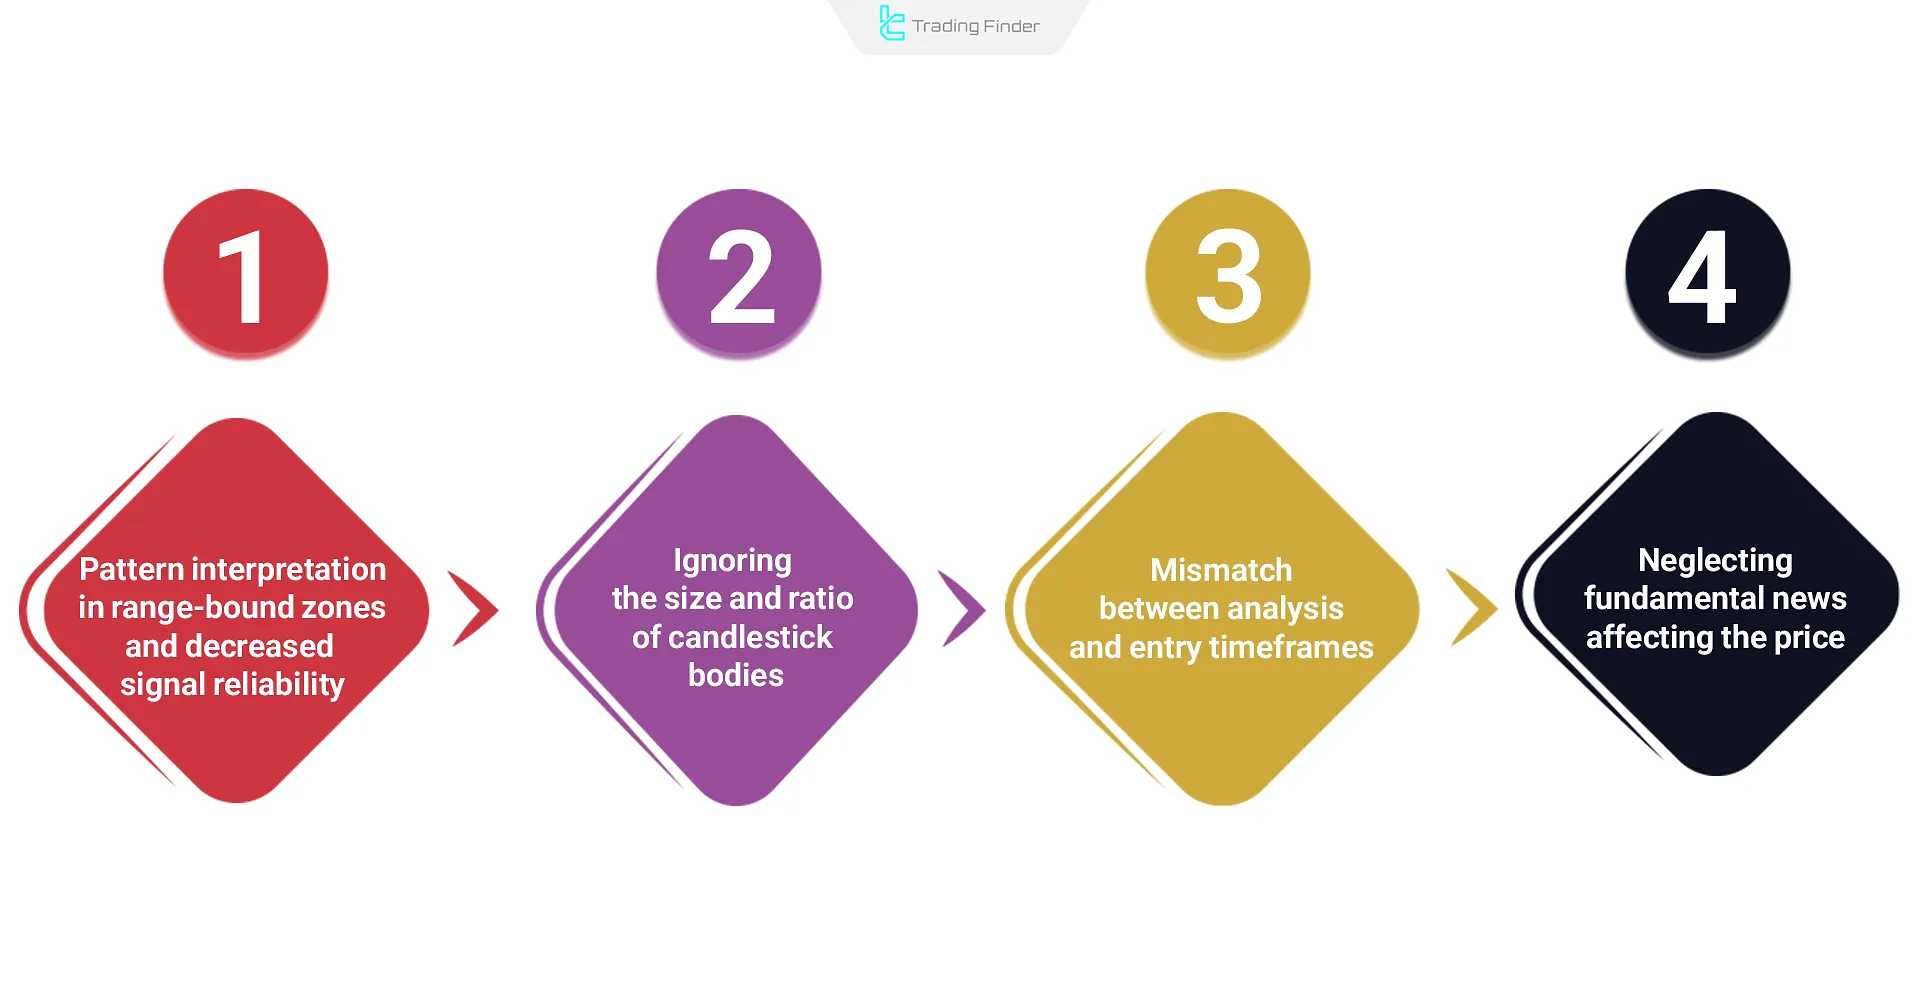
Common Mistakes in Analyzing Dual Candlestick Patterns
Many beginner traders make decisions based on dual candlestick patterns without considering the overall trend or confirmation signals. Common analytical mistakes in this area include:
Candle Time Indicator for MetaTrader
The Candle Time indicator on the MetaTrader platform is one of the most accurate and practical tools for traders, displaying the remaining time until the current candle closes directly on the price chart.
This feature helps traders stay aware of candle closing times without manual calculation, allowing them to adjust their entry and exit decisions at optimal trading points.
This indicator is especially valuable for those operating in short timeframes such as 1 minute, 5 minutes, or 30 minutes, since knowing exactly when a candle ends can have a direct impact on timing in scalping or day trading strategies.
However, it is also highly effective for technical analysts working with longer timeframes, as it enhances the temporal structure of chart analysis.
Categorically, Candle Time belongs to the MetaTrader groups of price action indicators, trading tools, and classical chart patterns.
The indicator is easy to install on MetaTrader and suitable even for beginner users. In addition to the Forex market, it is also useful in cryptocurrency and stock trading.
In the settings section, users can customize details such as text color, font size, font name, display mode, and shift points to ensure the timer display matches their chart style and preferences.
This tool helps traders maintain better time awareness, enabling faster reactions to price changes at critical moments.
For example, as the candle nears its close, traders can identify stronger entry or exit signals and capitalize more effectively on short-term market fluctuations.
The Candle Time indicator can be considered one of the simplest yet most effective MetaTrader tools, improving trade management across all financial markets by displaying the precise time remaining until candle closure.
Conclusion
Dual Candlestick Patterns offer valuable insights based on the positioning of two adjacent candles. Traders use them to detect trend reversals at highs and lows.
Bearish reversal patterns within a downtrend are often disregarded. Overall, these patterns suggest shifts in power between buyers and sellers.


