


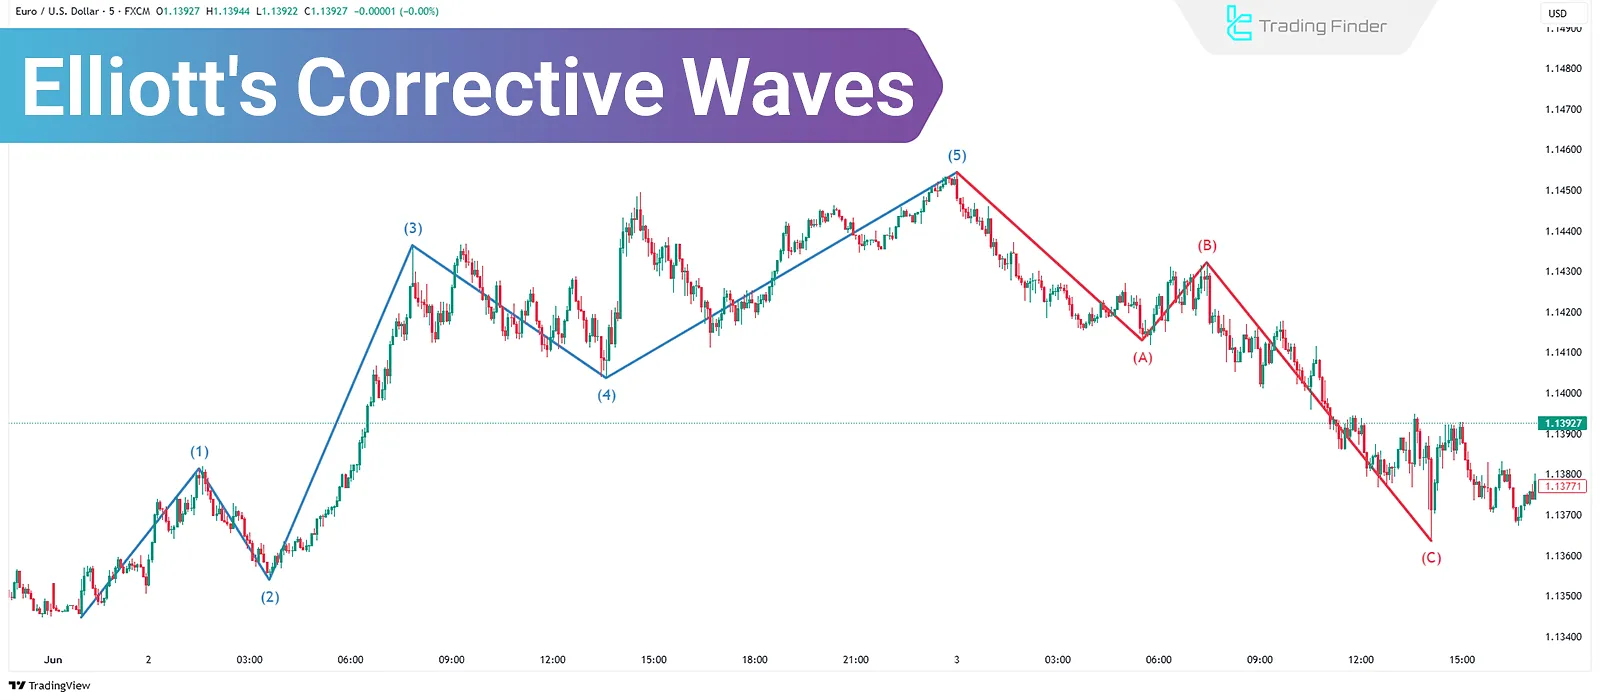
Corrective Waves in Elliott Wave Theory are composed of three sub-waves and move against the prevailing trend. Unlike motive waves that follow a clear structure, Corrective Waves are more challenging to identify due to their complexity and pattern variations.
Correctly identifying these patterns allows traders to anticipate the next potential price trend and identify entry points aligned with the main trend.
By understanding the different types of corrective waves, traders can manage their trade timing and estimate the approximate depth of a retracement.
What Are Elliott's Corrective Waves?
In Elliott Wave Theory, Corrective Waves are patterns that form against the direction of the main trend. These waves tend to retrace a portion of the price movement aligned with the primary trend.
In other words, they reverse part of the main trend but are not strong enough to change it entirely.
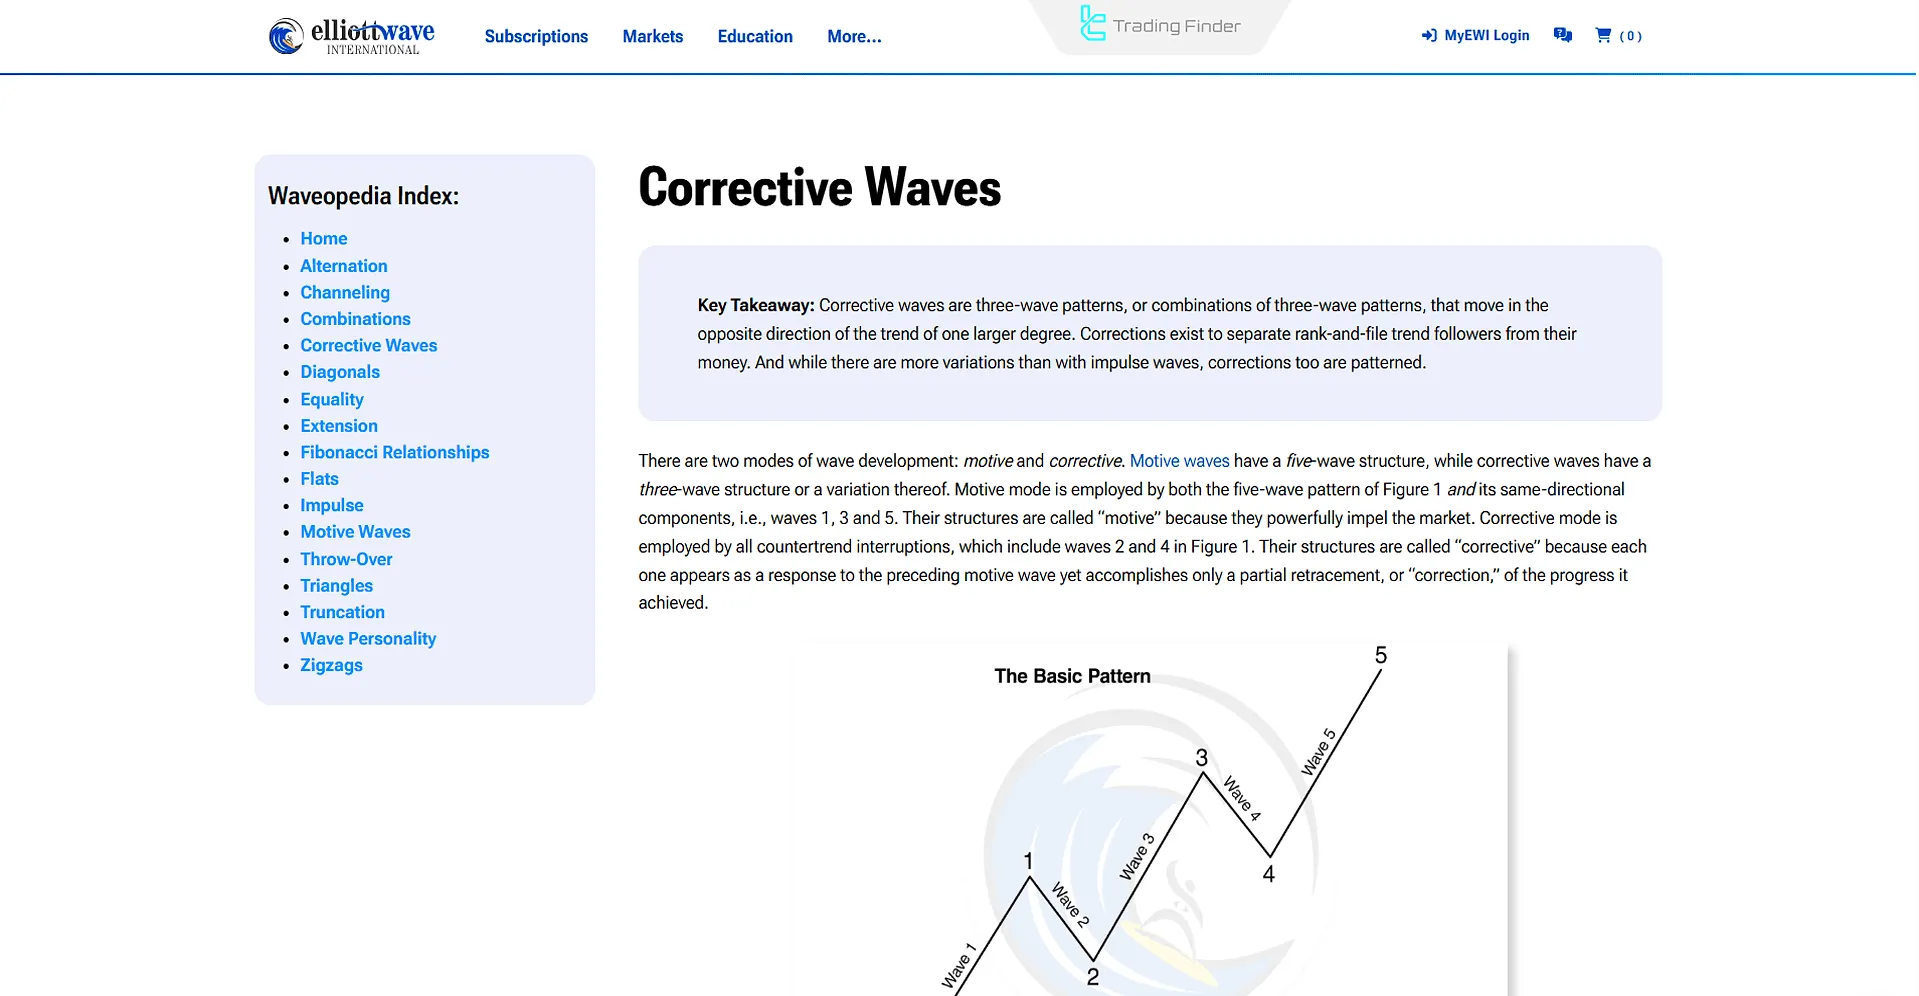
In the article elliott corrective waves training published on the elliottwave.com website, various aspects of these structures have been examined in greater detail.
Advantages and Disadvantages of Elliott Corrective Waves
Corrective waves present both opportunities and challenges. Below are the main pros and cons:
Advantages | Disadvantages |
Optimal entry opportunities | Complexity in identification and analysis |
Trend forecasting | Uncertainty in retracement depth |
Trend health assessment | Potential for misleading signals |
- | Requires advanced tools and knowledge |
Types of Elliott's Corrective Waves
Corrective Wave Patterns fall into two main categories, each representing different structures on the price chart. These structures help forecast future price movements:
Type of Correction | Main Focus | Chart Characteristic | Analytical Note |
Price Correction | Deep retracement in price | Fast and steep movement, wide range, high volume | Indicates short-term correction strength; analyze using price Fibonacci levels (38.2%–61.8%) |
Time Correction | More time spent with little price change | Horizontal fluctuation, narrow range, low volume | Market consolidation before trend continuation; analyze using time-based tools |
Time Corrections
Time-based Corrective Waves differ in nature. The duration of the correction affects the width of the retracement on the chart. Corrections that take longer timeframes tend to have wider chart ranges.
Conversely, Price Corrections occur faster, within shorter time intervals, and are often sharper in nature.
Price Corrections
Price Corrections in Elliott Theory are divided into various Corrective Wave Patterns, each comprising multiple sub-patterns across timeframes. These include:
- Zigzag
- Flat
- Triangle
- Combined
Zigzag Corrective Wave
The Elliott Zigzag corrective pattern is an advanced three-wave Elliott Wave formation in which the price moves against the main trend. This pattern usually indicates deep market corrections and highlights strong reversal points.
This pattern consists of three sub-waves; waves A and C each appear as a five-wave impulsive pattern, while wave B represents a three-wave corrective structure.
Types of Flats in Zigzag Corrective Waves (Zigzag)
The Zigzag pattern is one of the most widely used corrective structures in the Elliott Wave Theory and possesses a dynamic and directional nature.
This pattern is formed through a specific combination of impulsive and retracing waves and usually represents a strong corrective phase within the market trend.
Its structure is defined as 5-3-5; in this formation, waves A and C have an impulsive (Impulse) structure with five sub-waves, while wave B forms a corrective (Corrective) structure with three sub-waves.
This arrangement emphasizes the sharp and decisive nature of the corrective movement.
Fibonacci Ratios play a key role in this pattern:
- Wave B usually retraces between 50% and 75% of wave A;
- Wave C often extends within the range of 100% to 123.6% of the length of wave A.
Zigzags are more commonly observed in markets characterized by rapid corrections and high momentum; in contrast, they appear less frequently during time-based or sideways corrections.
When multiple consecutive patterns occur, the structure can evolve into a Double Zigzag or a Triple Zigzag, thereby increasing the complexity of price movements.
Flat Corrective Wave
In the Flat Corrective Wave Pattern, price moves horizontally within a defined range. The appearance of this pattern in a trend indicates a pause in price action within a specific section of the chart.
This type of Corrective Wave Pattern forms as a three-wave corrective structure:
- Waves A and C may consist of either 3 or 5 smaller waves;
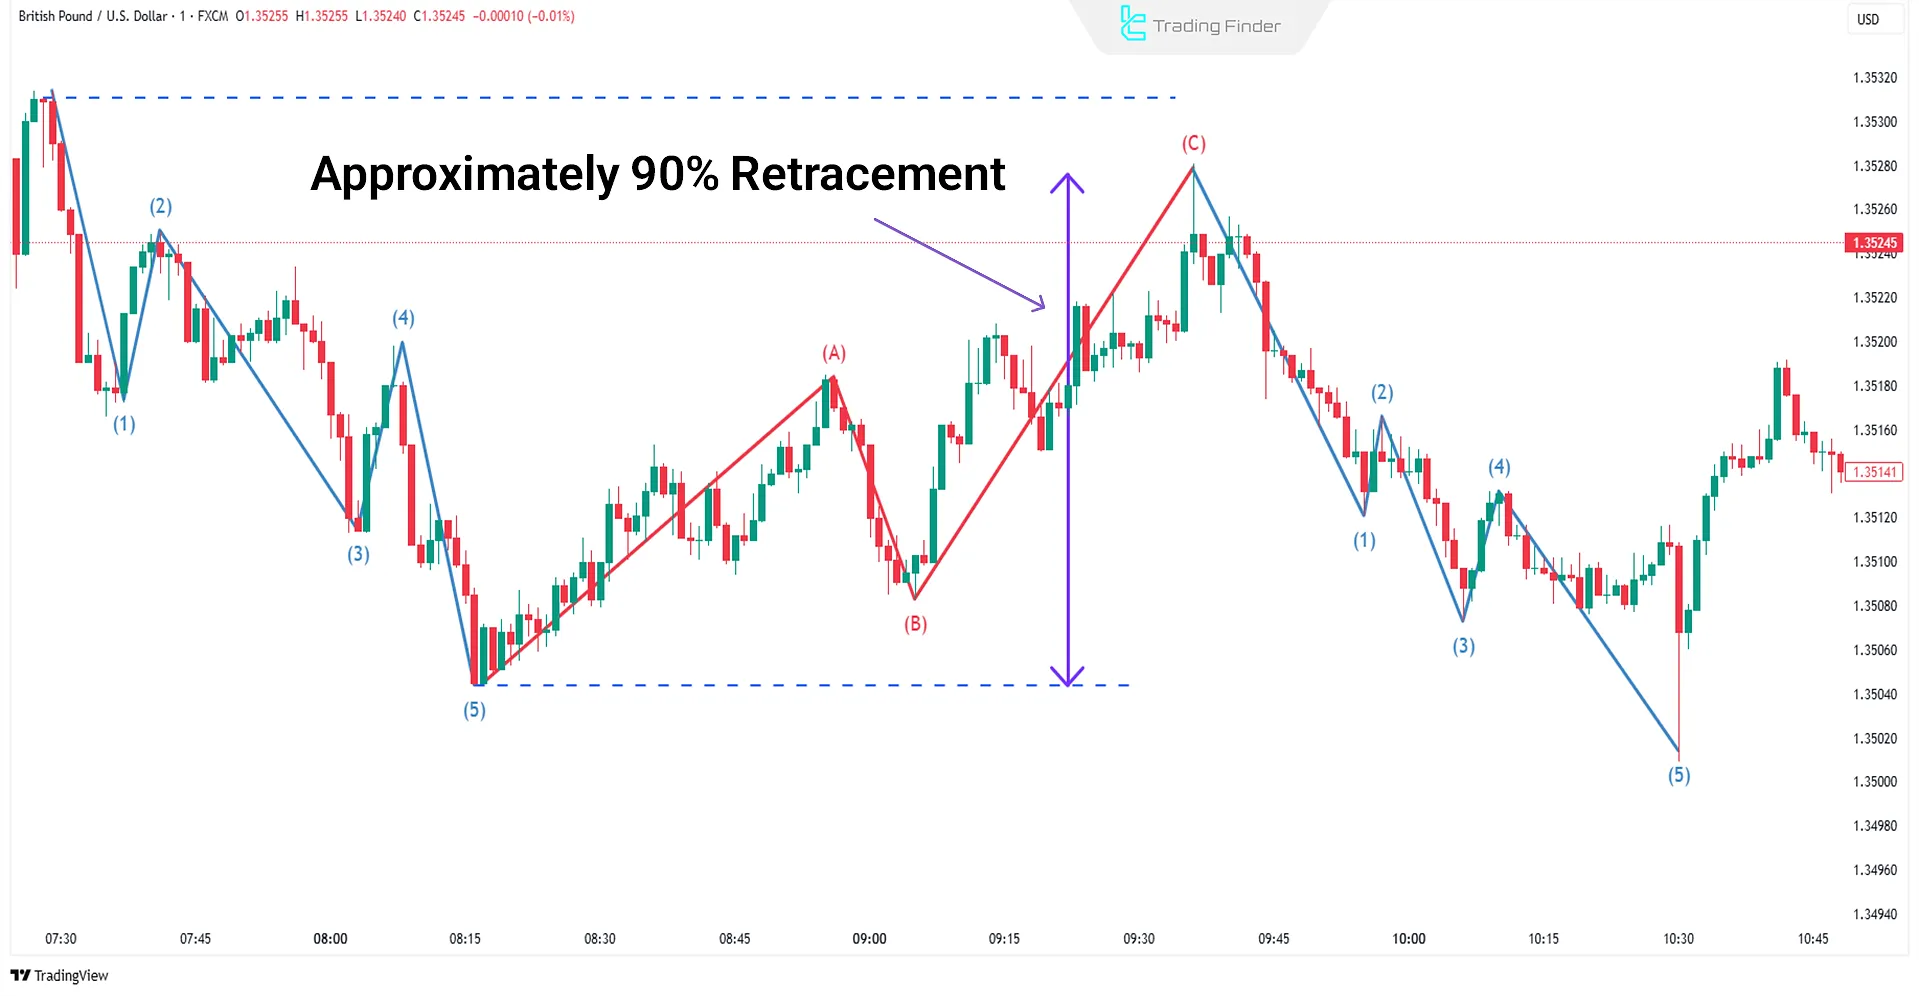
- Wave B is a three-wave corrective move that typically retraces about 90% of wave A.
Types of Flats in Corrective Flat Waves (Flat Patterns)
The Flat pattern is one of the common corrective structures in the Elliott Wave Theory. This pattern consists of three consecutive waves—A, B, and C—and its structure is defined as 3-3-5. Waves A and B have a corrective nature, while wave C follows an impulsive structure.
Based on the extent and penetration of wave B, three types of Flats are identified:
- Regular Flat: In this case, wave B retraces about 90% of wave A, and wave C slightly surpasses the end of wave A;
- Expanded Flat: Wave B extends beyond the starting point of wave A (more than 100%), and wave C usually reaches around 123% of wave A;
- Running Flat: Wave B moves past the beginning of wave A, but wave C fails to reach the end of wave A; this type typically forms in markets with strong trending power.
Although Flat patterns may appear similar, they differ significantly in market psychology. Accurate identification of these variations plays a decisive role in forecasting the continuation of trends within corrective wave analysis.
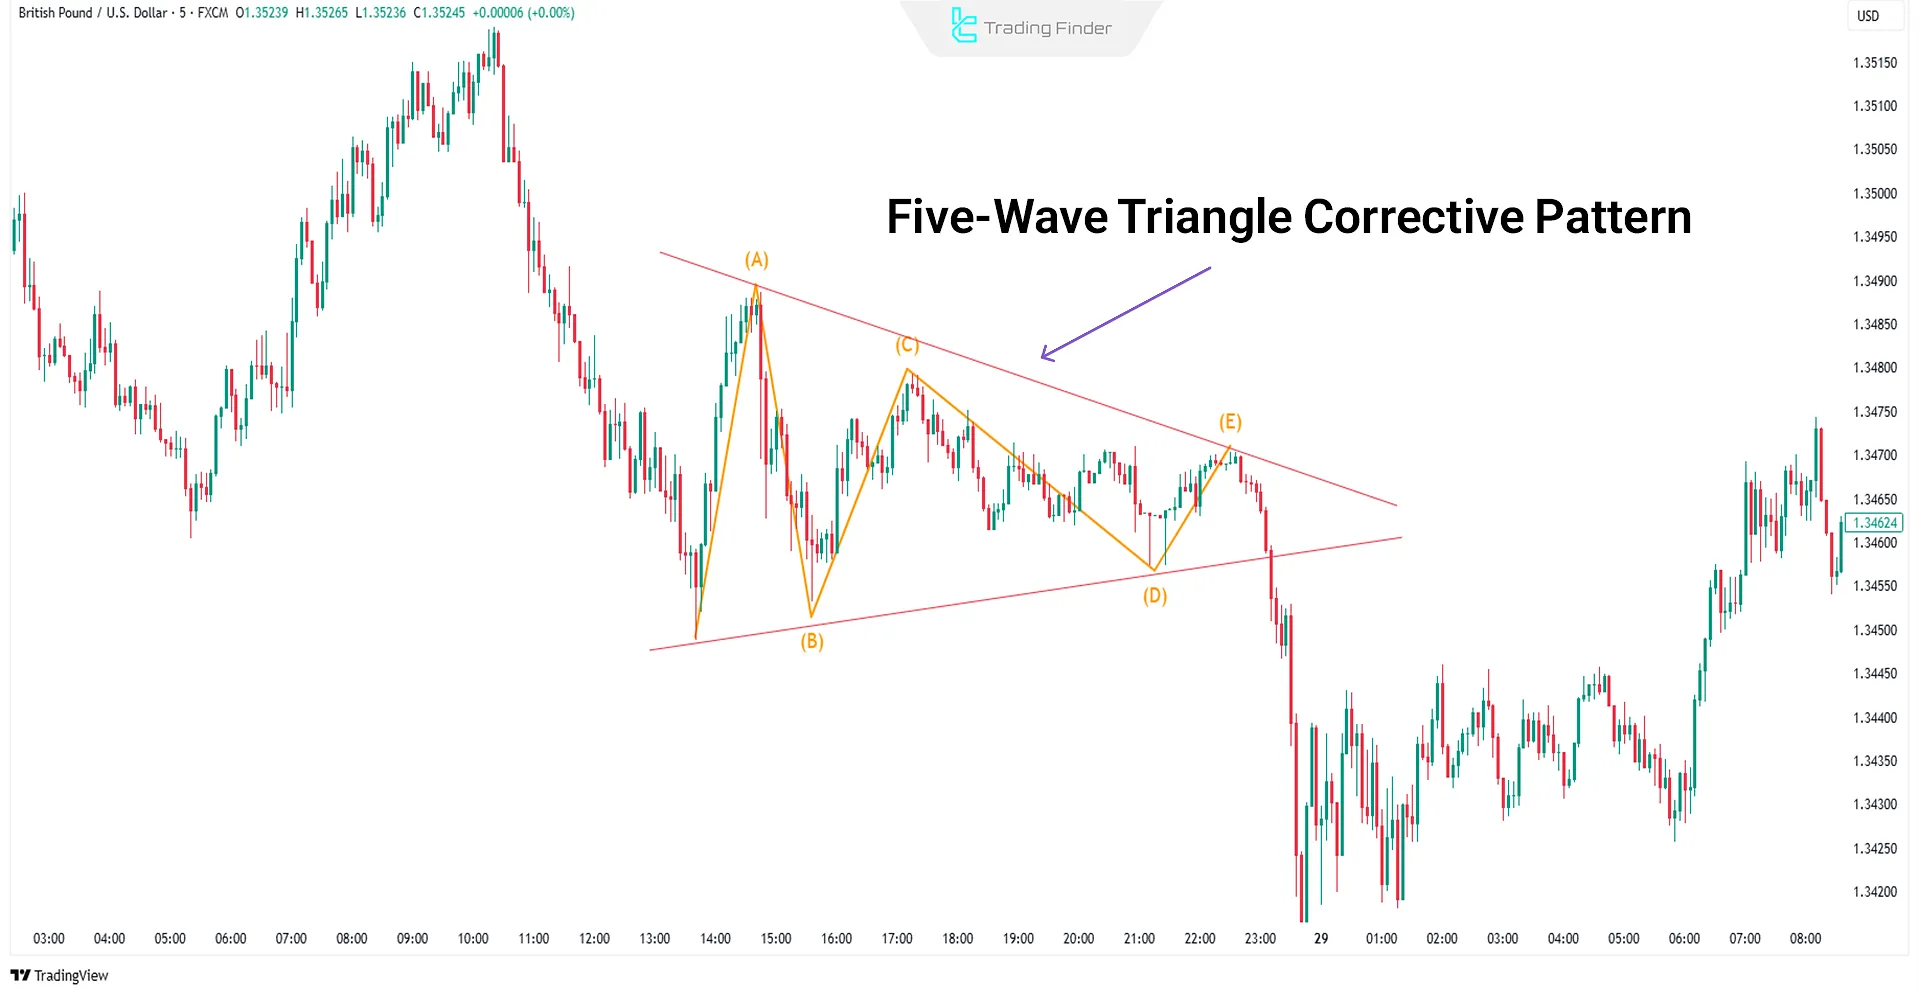
Triangle Corrective Wave
Triangle Corrective Waves typically form during price consolidation phases and are commonly observed in corrective stages of the market. This pattern usually acts as a trend continuation formation and is composed of five smaller corrective waves.
The five Corrective Waves (A-B-C-D-E) in a triangle pattern connect support and resistance lines drawn from the highs and lows of price, forming a triangle-shaped structure. Once the price breaks out of the triangle, the main trend may resume.
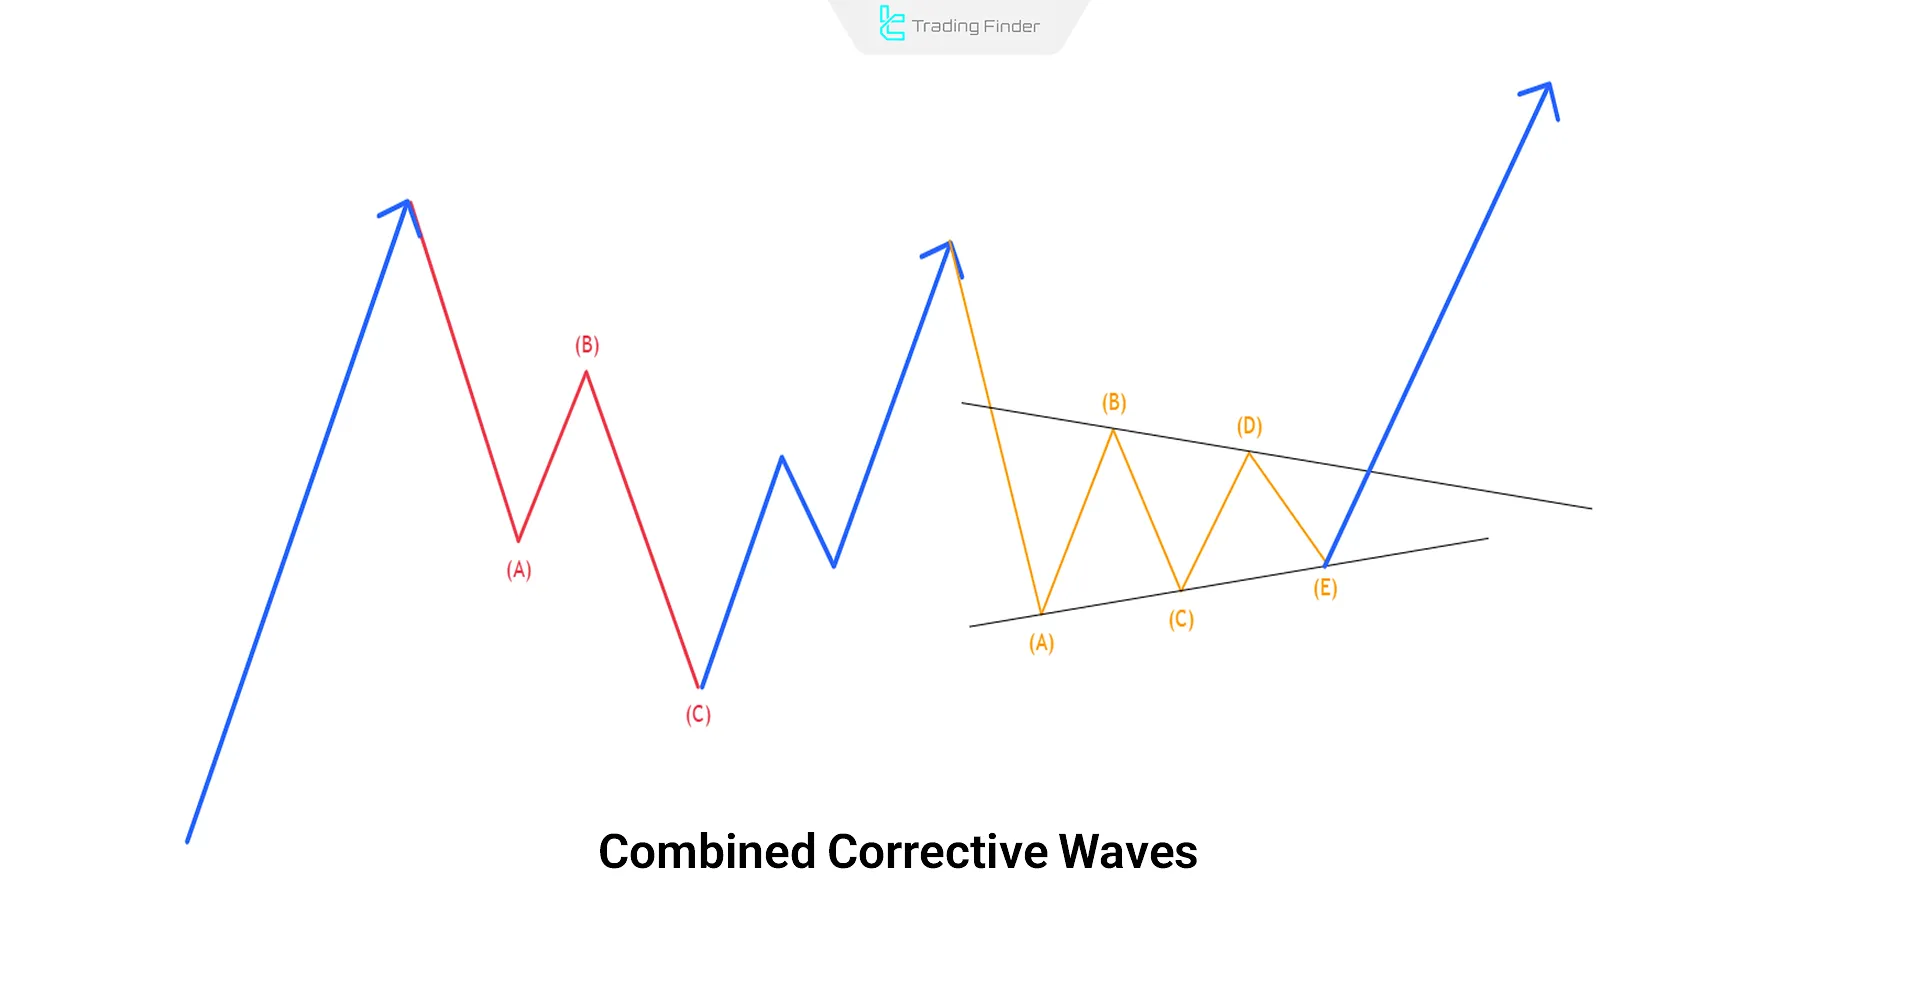
Combined Corrective Waves
When time and price corrections occur simultaneously, multiple patterns may form in combination.
In such cases, two or even three different corrective structures are linked by connecting waves (X), creating complex combinations.
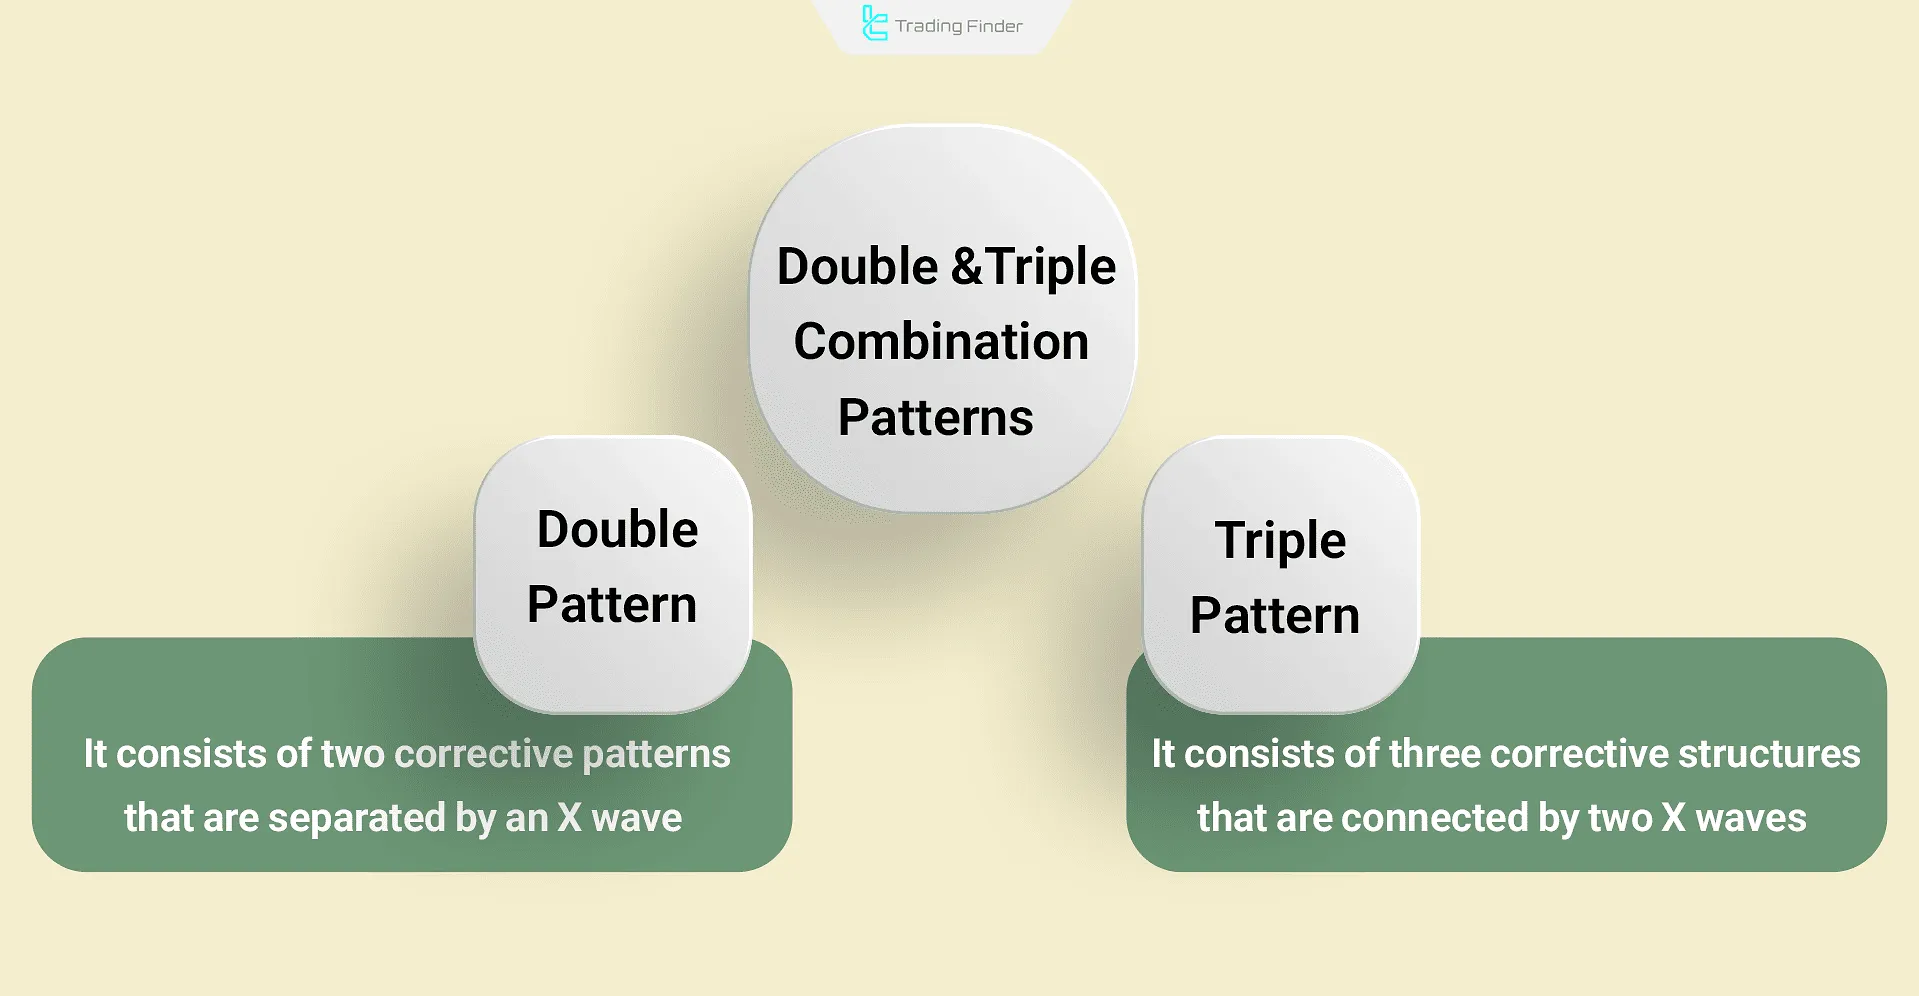
Double & Triple Three Patterns
The Double and Triple Three combination patterns are among the most complex corrective structures in the Elliott Wave Theory.
These patterns form when the market is in a consolidation or sideways correction phase and a time extension within the corrective phase is required.
In these structures, several simple corrective patterns such as Zigzag, Flat, or Triangle are connected by linking waves known as X waves.
- Double Three (WXY): Consists of two separate corrective patterns connected by one X wave;
- Triple Three (WXYXZ): Comprises three consecutive corrective structures connected by two X waves.
These patterns are often seen in sideways or neutral corrections and result in an extended corrective phase over time.
The common Fibonacci Ratios are as follows: wave X is approximately 50% to 85% of wave W, while wave Y typically ranges from 61.8% to 123.6% of wave W.
Despite their complexity, combination patterns possess a precise geometric order, and correctly identifying them provides professional wave analysts with a deeper understanding of the market’s corrective cycles.
Rules of Elliott Corrective Waves
Elliott Corrective Waves in technical analysis are often complex and difficult to identify. To recognize and analyze these waves, there are fixed rules that are applied for their identification and interpretation.
For more information and a better understanding of Elliott Corrective Waves, you can also refer to the educational video on the Simple Scalping YouTube channel.
Rules of Corrective Waves in Elliott:
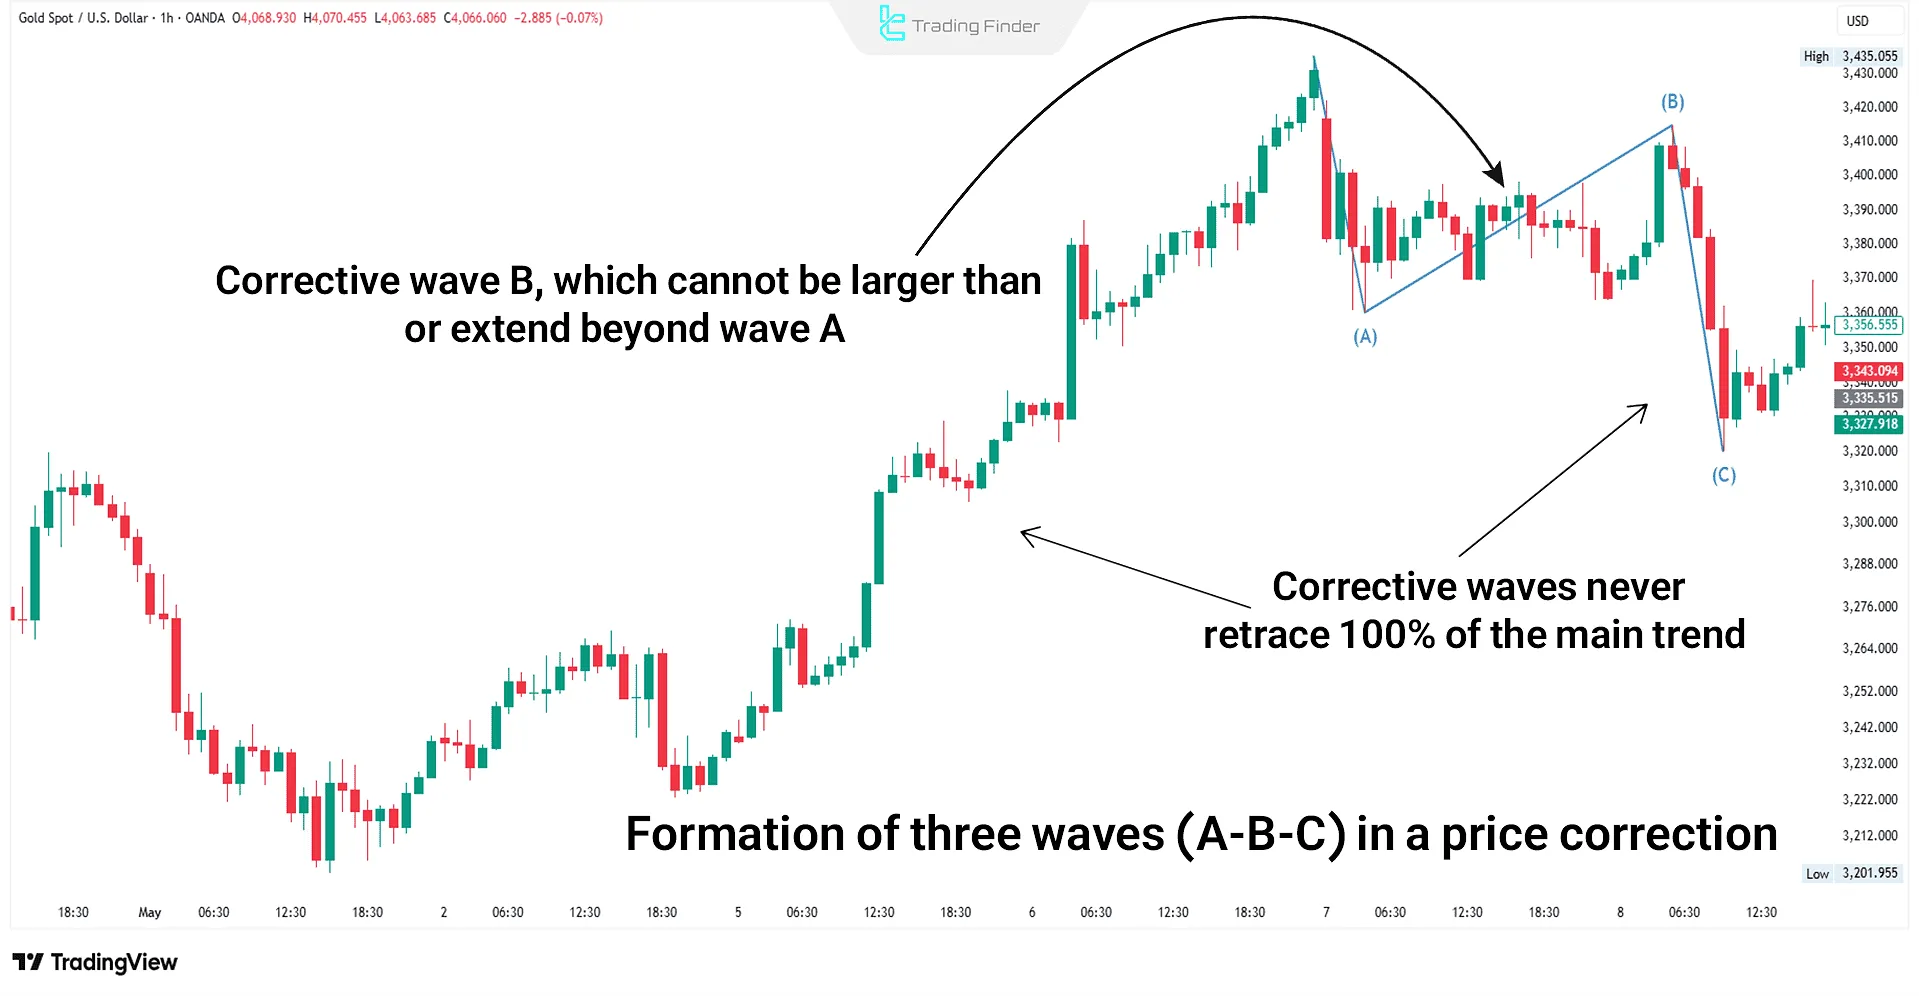
- Corrective waves never retrace 100% of the main trend;
- In most cases, corrective waves form a three-wave structure (A-B-C);
- Wave B cannot be larger than wave A;
- Wave B does not exceed wave A, as its nature is corrective.
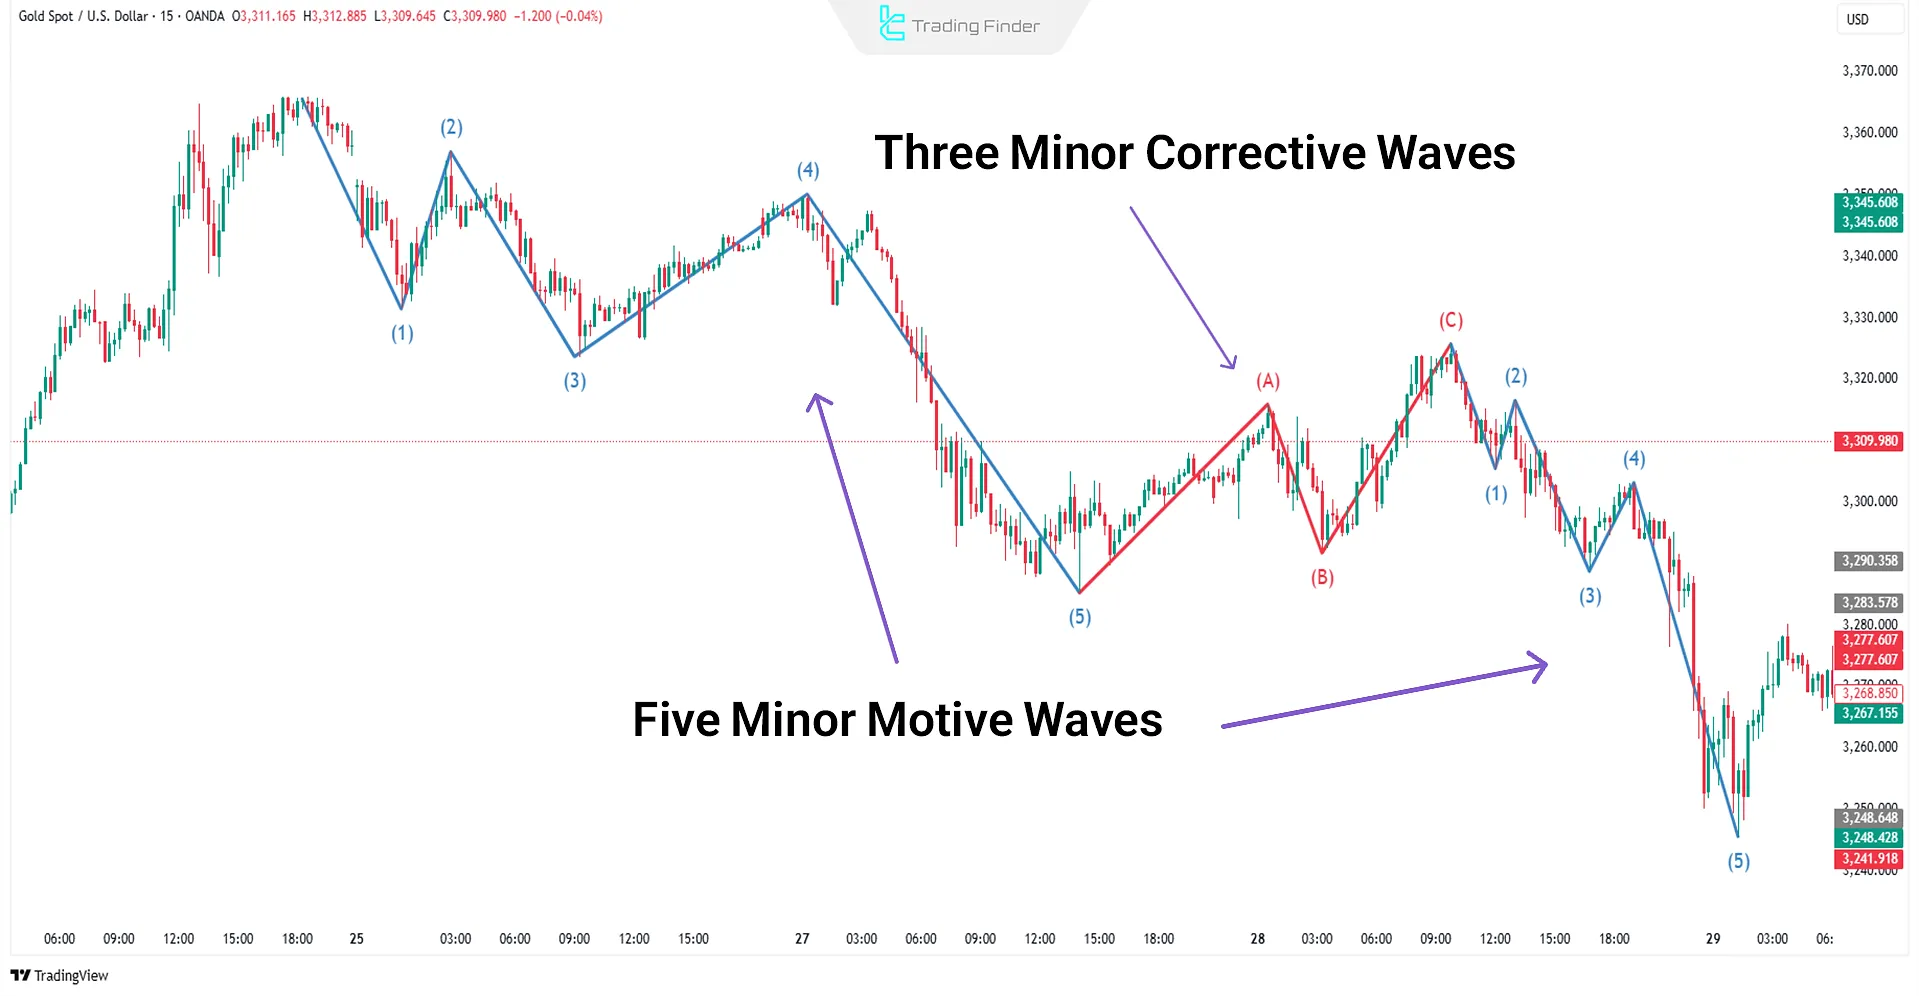
Real Example of Elliott Corrective Waves on a Chart
In the chart below, the gold price in the 1-hour timeframe shows a corrective move in which all the Corrective Wave Rules are properly observed.
This orderly structure is an accurate example of a classic correction within the Elliott Wave Theory framework and clearly illustrates the balance of movement among the waves.
Fibonacci Relationships in Corrective Waves
Fibonacci Ratios play a key role in identifying retracement levels and the end of the corrective phase within the structure of Elliott Wave Theory.
These ratios, by analyzing the proportional relationships among waves A, B, and C, provide a precise framework for forecasting price reversal points.
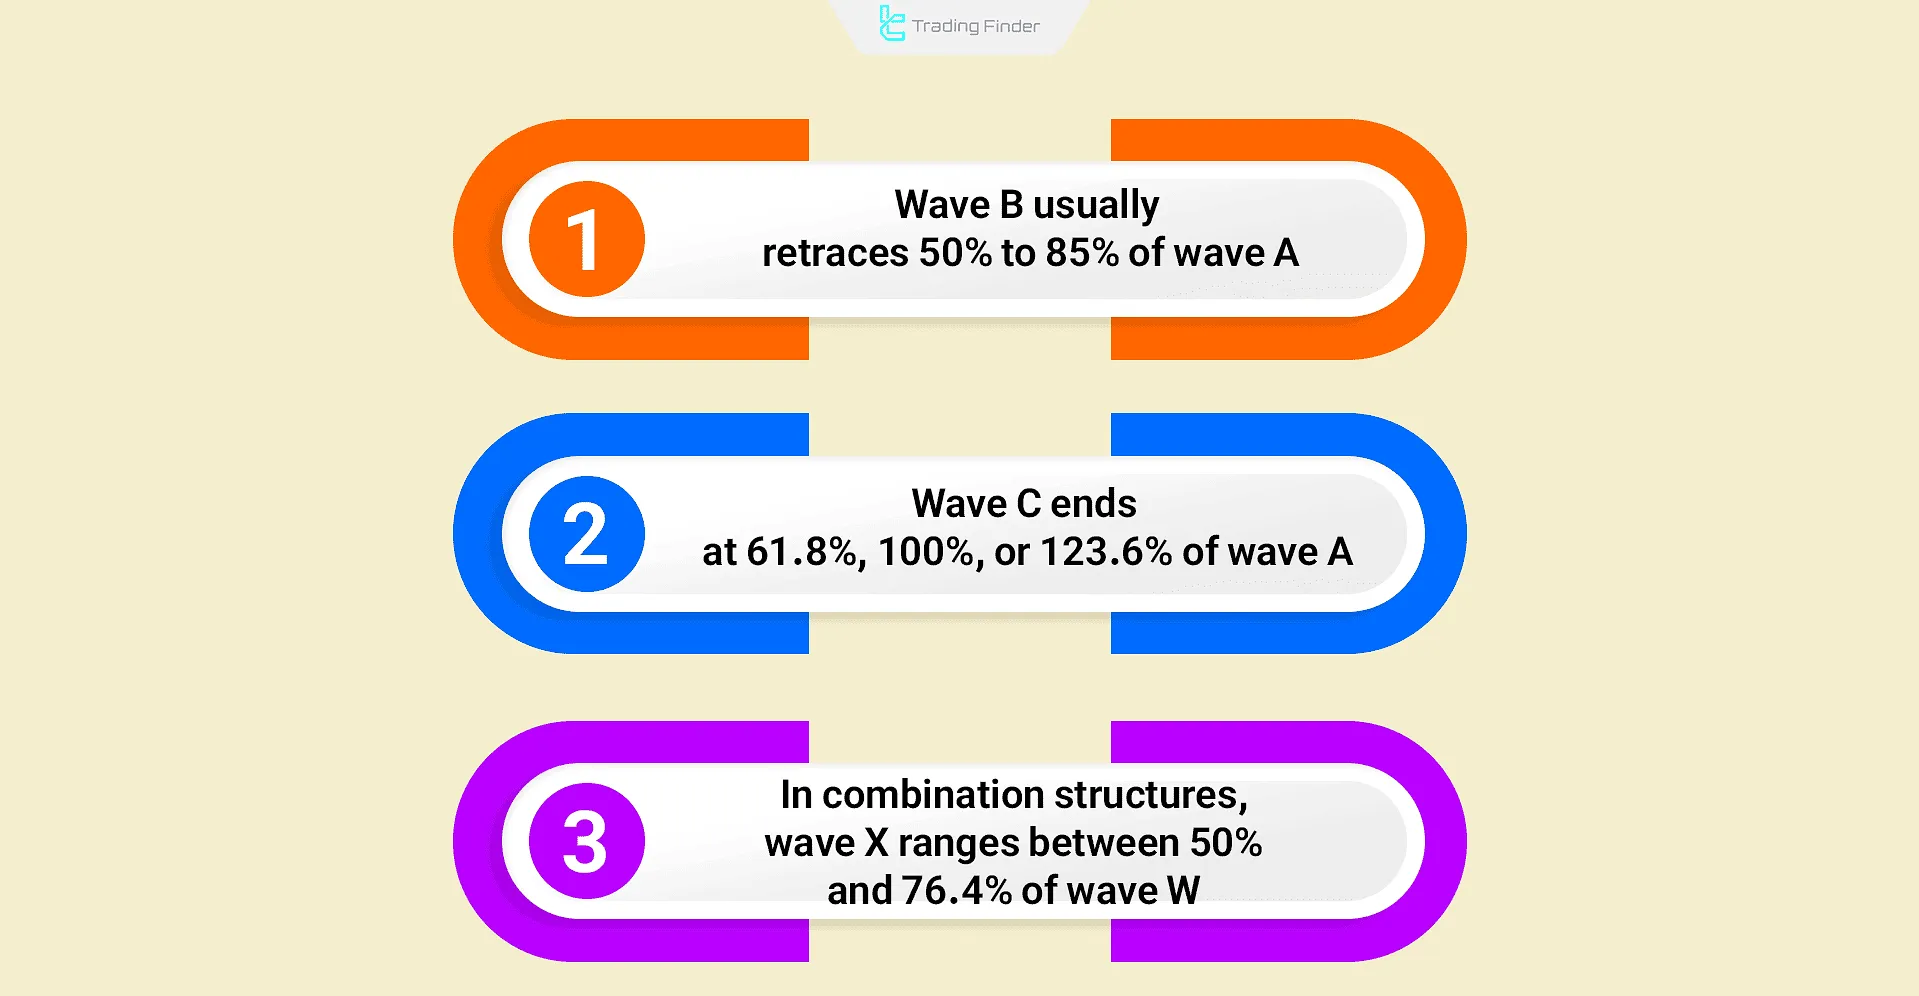
- Wave B usually retraces between 50% and 85.4% of the length of wave A;
- Wave C often ends at one of the 61.8%, 100%, or 123.6% levels of wave A;
- In combination structures, wave X is typically found within the 50% to 76.4% range of wave W.
The coordinated application of these ratios, along with price patterns and support & resistance zones, enhances analytical accuracy and enables a more precise determination of the correction’s endpoint and the start of a new movement.
Difference Between Corrective and Motive Waves
Each of the Corrective Waves and Motive Waves has its own distinct characteristics, and there are several key differences between them. Below is a comparison of Corrective and Motive Waves in Elliott Theory:
Aspect | Corrective Waves | Motive Waves |
Movement Direction | Opposite to the main trend | In line with the main trend |
Wave Structure | Consists of 3 waves | Consists of 5 waves |
Strength and Momentum | Weak | Strong |
Formation Duration | Long-lasting | Forms quickly |
Role in Market Trend | Acts as a pause for trend continuation | Indicates the core move of the trend |
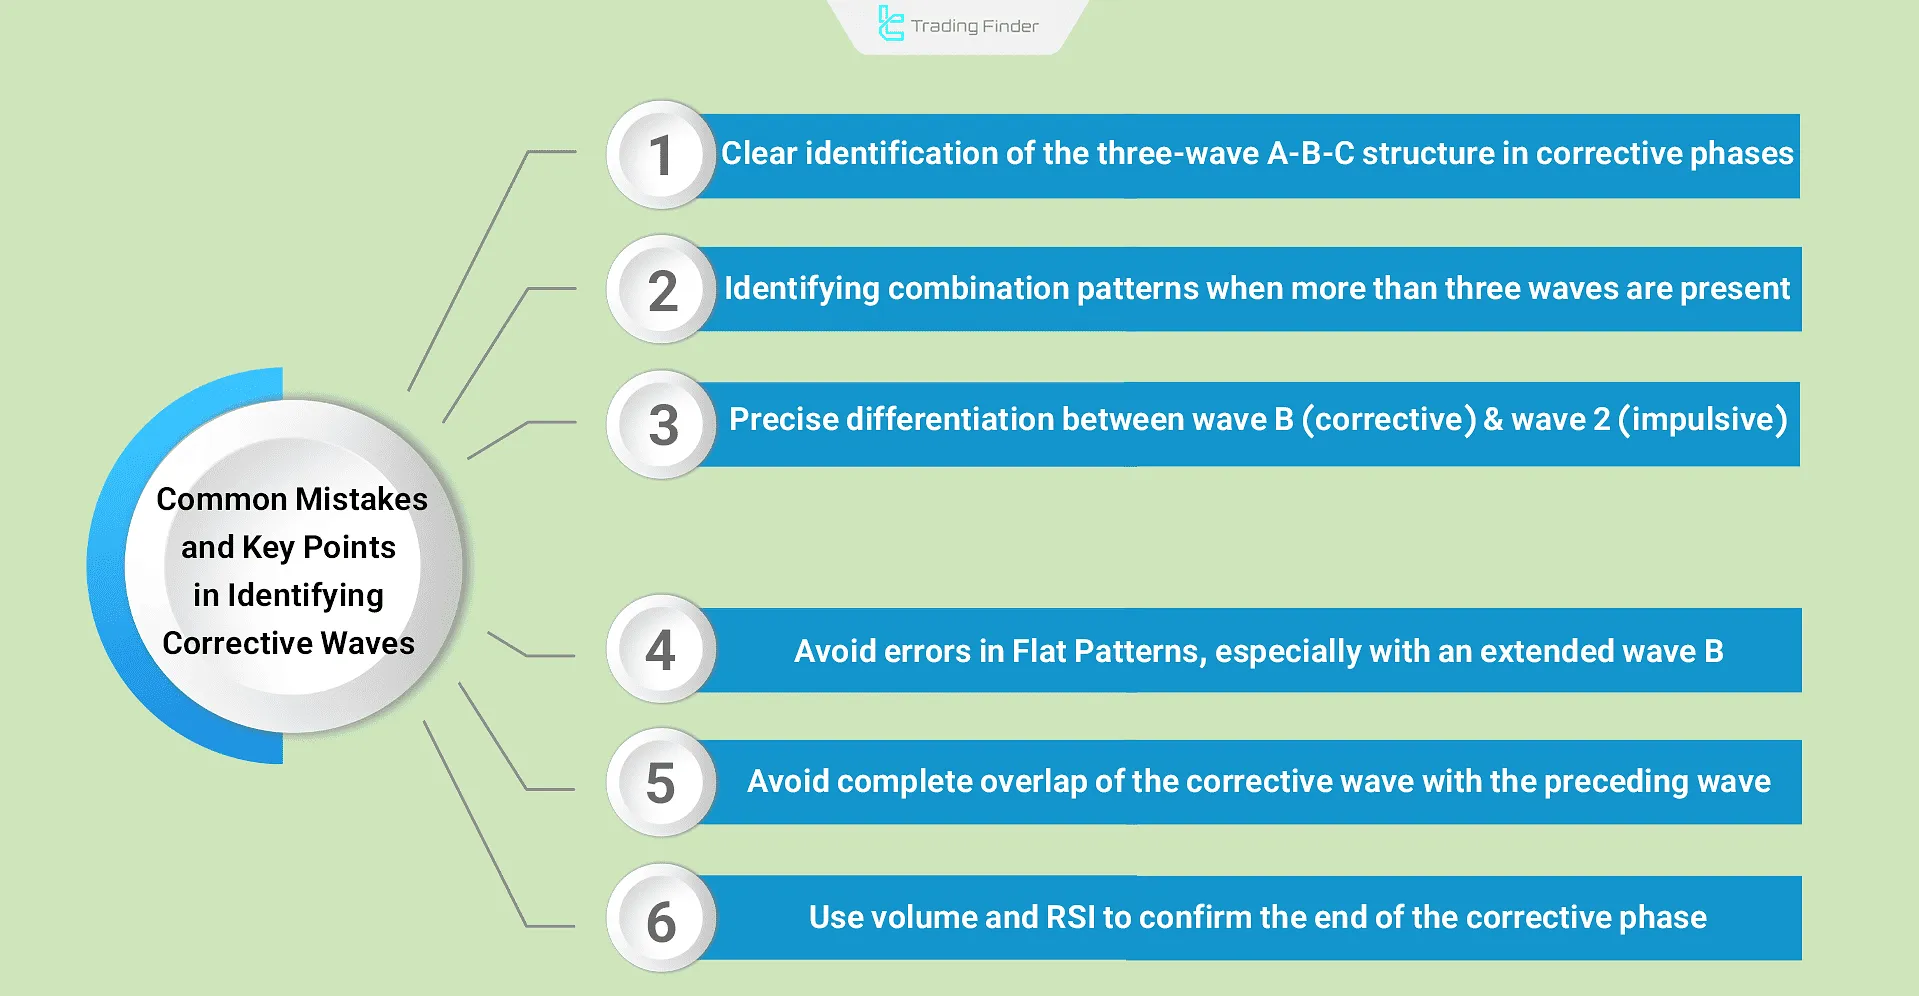
Common Mistakes and Key Points in Identifying Corrective Waves
In Elliott Wave Analysis, accurately identifying corrective structures is crucial for maintaining analytical consistency and precision, as even the smallest error in interpretation can alter the overall market trend.
Adhering to structural principles and paying close attention to details form the foundation of professional analysis.
- Clearly identifying the three-wave structure (A-B-C) within corrective phases;
- Recognizing the presence of a Combination Pattern when more than three waves are observed;
- Distinguishing wave B from wave 2 based on their corrective versus impulsive characteristics;
- Avoiding misinterpretation within Flat Patterns, especially when wave B extends excessively;
- Preventing complete overlap of the corrective wave with the preceding wave to preserve structural integrity;
- Using Volume Analysis and the RSI indicator to confirm the end of the corrective phase.
Following these principles establishes a solid foundation for accurately identifying different types of corrections and allows for a more targeted evaluation of the market’s next potential movement.
Elliott Wave Indicator for MetaTrader
The Elliott Wave Indicator is one of the most powerful analytical tools available on the MetaTrader platform, designed based on the classical Elliott Wave Theory.
This indicator’s purpose is to identify the structure of price movements through precise wave counting within impulsive and corrective waves, helping traders determine which phase of the market cycle they are currently in.
Using this tool, impulsive patterns (1 to 5) and corrective or combined patterns (ABC or ABCDE) are automatically drawn on the chart.
For this reason, the Elliott Wave Indicator helps traders accurately identify the starting and ending points of trends, retracement levels, and continuation zones. This feature has made it one of the most popular indicators among professional technical analysts.
The Elliott Wave Indicator belongs to the MetaTrader categories of price action, reversal, and leading indicators, and is designed for traders operating at an advanced skill level.
This tool can be applied across multiple timeframes and supports multi-timeframe analysis, making it highly practical for various strategies such as day trading, scalping, and short-term trading.
For example, on a 30-minute currency pair chart, the indicator identifies an ABCDE pattern following a downtrend, signaling a potential shift to an uptrend. After the completion of wave E, the trader can enter a buy position.
Similarly, on a 15-minute chart of another currency pair, after detecting an ABC corrective pattern, the indicator marks the end of wave C as an ideal point for a sell entry.
In the settings section, options such as “Long and Short Depth” for adjusting wave sensitivity, “Show Lines” for displaying wave connectors, and color customization for labels (12345, ABC, and ABCDE) are available.
Overall, the Elliott Wave Indicator is a comprehensive tool for analyzing price structures, identifying market phases, and making precise trading decisions.
Conclusion
Elliott's Corrective Waves come in different forms, all moving opposite to the main trend. These waves do not reverse the primary trend and usually appear as a three-wave pattern (A-B-C).
Corrective waves in Elliott Theory prepare the market for the continuation of the trend and adhere to the established rules of corrective wave structures.
When combined corrective patterns form in the market, they are connected by linking waves (X), resulting in complex corrective structures. These zones often serve as areas of price consolidation and liquidity accumulation.


