


The Exponential Moving Average (EMA) indicator is a lagging indicator that responds quickly to price movements in financial markets. This responsiveness makes it highly effective for scalping andday trading strategies.
Therefore, the Exponential Moving Average indicator can be integrated into strategies that combine Moving averages with Price action and Fibonacci levels.
By customizing settings and using multiple Exponential Moving Averages, traders can also develop new trading strategies.
What Is the Exponential Moving Average (EMA)?
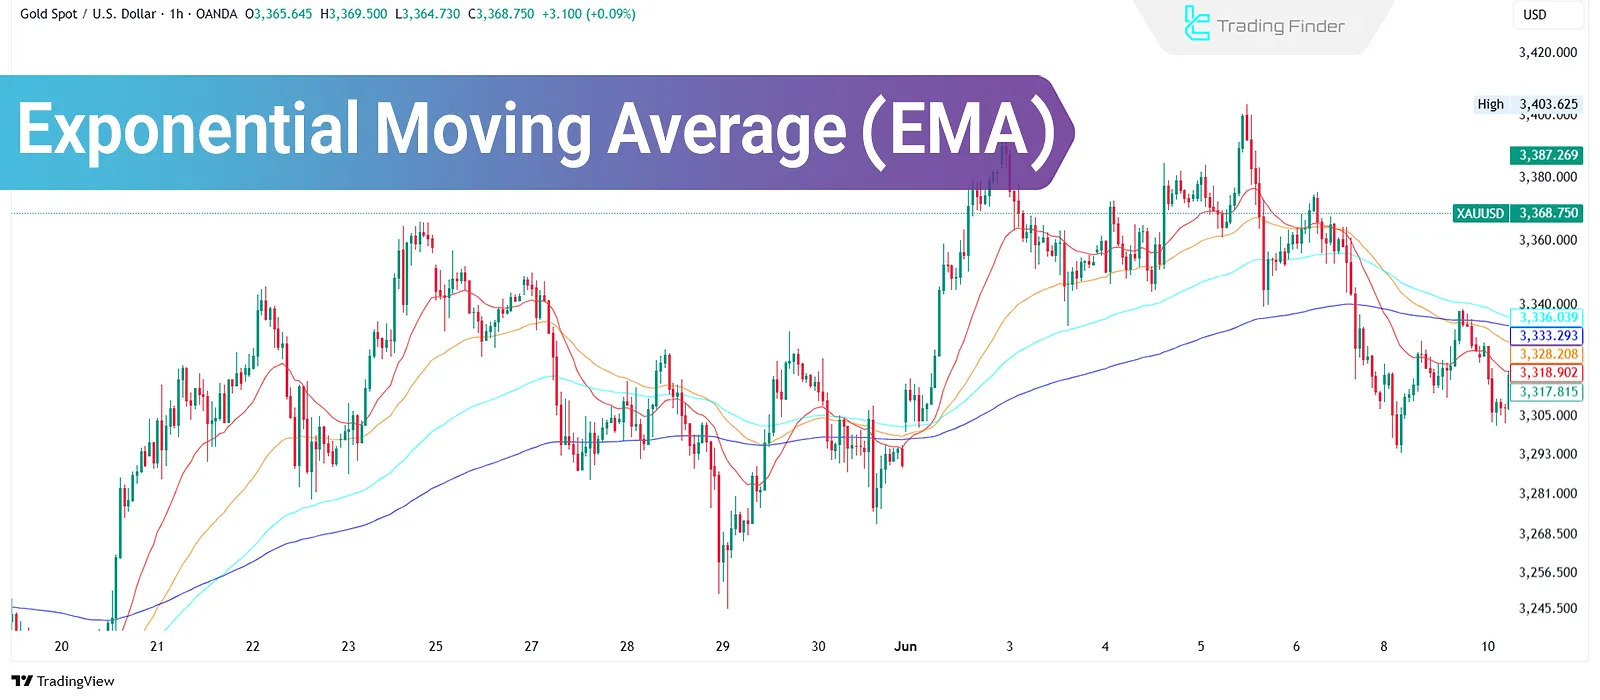
The Exponential Moving Average (EMA) calculates the average of price data over a specified period and displays it as a continuous line on the chart.
This indicator gives more weight to recent price data, which makes it highly responsive to quick and emotional market reactions making it suitable for volatile and fast-paced markets.
Pros and Cons of the Exponential Moving Average
Most traders use this type of moving average due to its effectiveness in swing trading strategies. Therefore, it's important to be aware of the pros and cons of the Exponential Moving Average (EMA):
Pros | Cons |
Quick reaction to sudden market changes | More complex for traders to interpret |
Suitable for scalpers and intraday traders | Higher chance of false signals in weak trends |
Useful in crossover strategies with moving averages | Requires precise settings to be effective across different tools/strategies |
Filtering Noise in Lower Timeframes | High Sensitivity and Possibility of Error |
Ability to Adjust for Different Market Conditions | Lagging Behind the Price (Delayed) |
Providing Fast Signals for Scalping | Poor Performance in a Ranging Market |
Formula for Calculating the Exponential Moving Average (EMA)
The Exponential Moving Average (EMA) uses a fixed but more complex formula than the Simple Moving Average (SMA). Exponential Moving Average indicator formula:
Application of Exponential Moving Average (EMA) in Technical Analysis
The main application of the Exponential Moving Average is to identify trends and dynamic support/resistance zones. This indicator generates buy and sell signals when it crosses the price chart.
Note: It is not recommended to rely solely on this indicator, as it carries significant risk and potential for error.
For more information and guidance on how to use the EMA, you can also refer to the exponential moving average (EMA) tutorial article on investopedia.com.
How to Use the Exponential Moving Average?
It is best to use the Exponential Moving Average in short-term and volatile timeframes. Its sensitivity to price changes offers numerous signals in lower timeframes, making it highly useful for scalpers and day traders.
Combining the Exponential Moving Average with other indicators and technical analysis tools enhances its performance, especially when used to confirm signals in a trading strategy.
Typically, traders use multiple EMAs simultaneously, where EMA crossovers generate entry and exit signals.
Trading Example with the Exponential Moving Average (EMA)
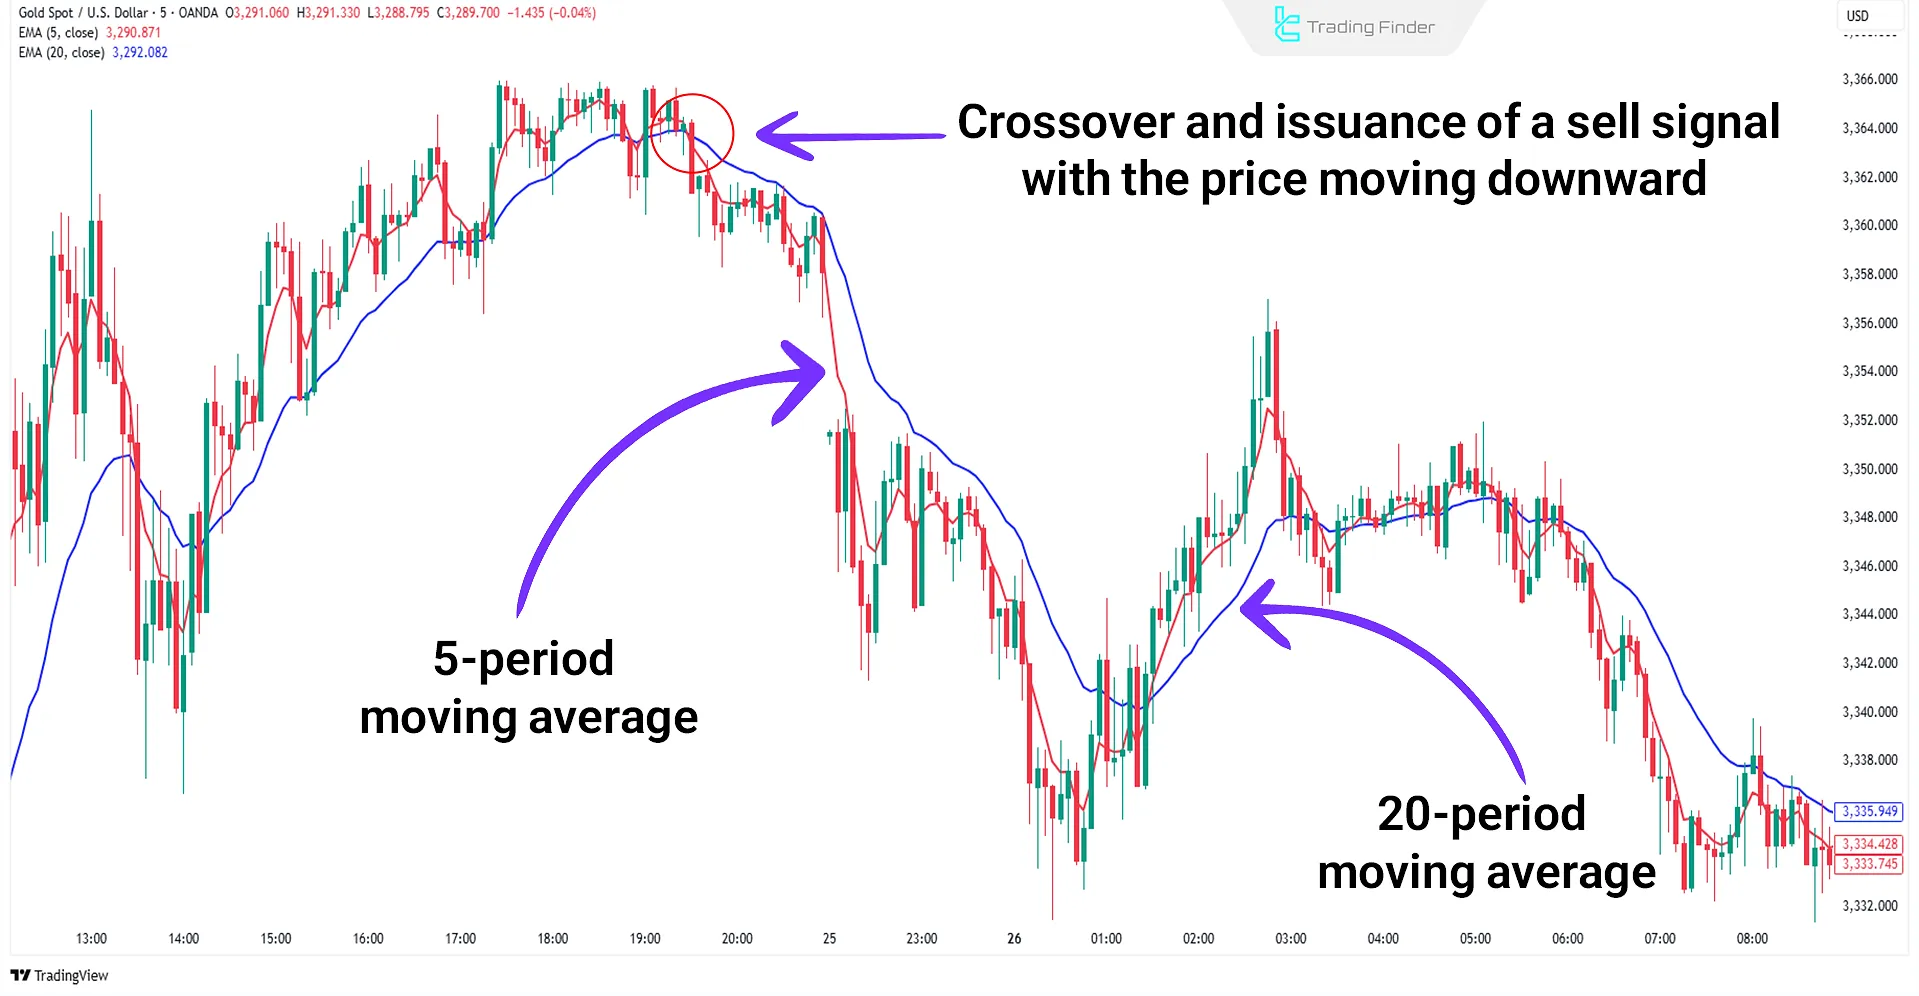
In the example below, two Exponential Moving Averages 5-period and 20-period are used to generate signals in a short-term timeframe.
When both EMAs are above the price and the 5-period EMA crosses below the 20-period EMA, a sell signal is generated:
Trading Strategies with the Exponential Moving Average Indicator
There are several strategies for using the Exponential Moving Average indicator, most of which are suitable for short-term and scalping trading styles. These include:
- Combining EMA with other indicators
- Using multiple EMAs simultaneously
- Integrating EMA with price action
- Using EMA with Fibonacci levels
- Golden Cross strategy
- Customized Crossover strategy
- Guppy Multiple Moving Average (GMMA) strategy
Note: The Exponential Moving Average can also be used in long-term timeframes. Often, long-term settings reduce signal errors in this indicator.
Combining EMA with Other Indicators
To enhance analytical accuracy and filter out false signals, combining EMA with other indicators produces powerful results:
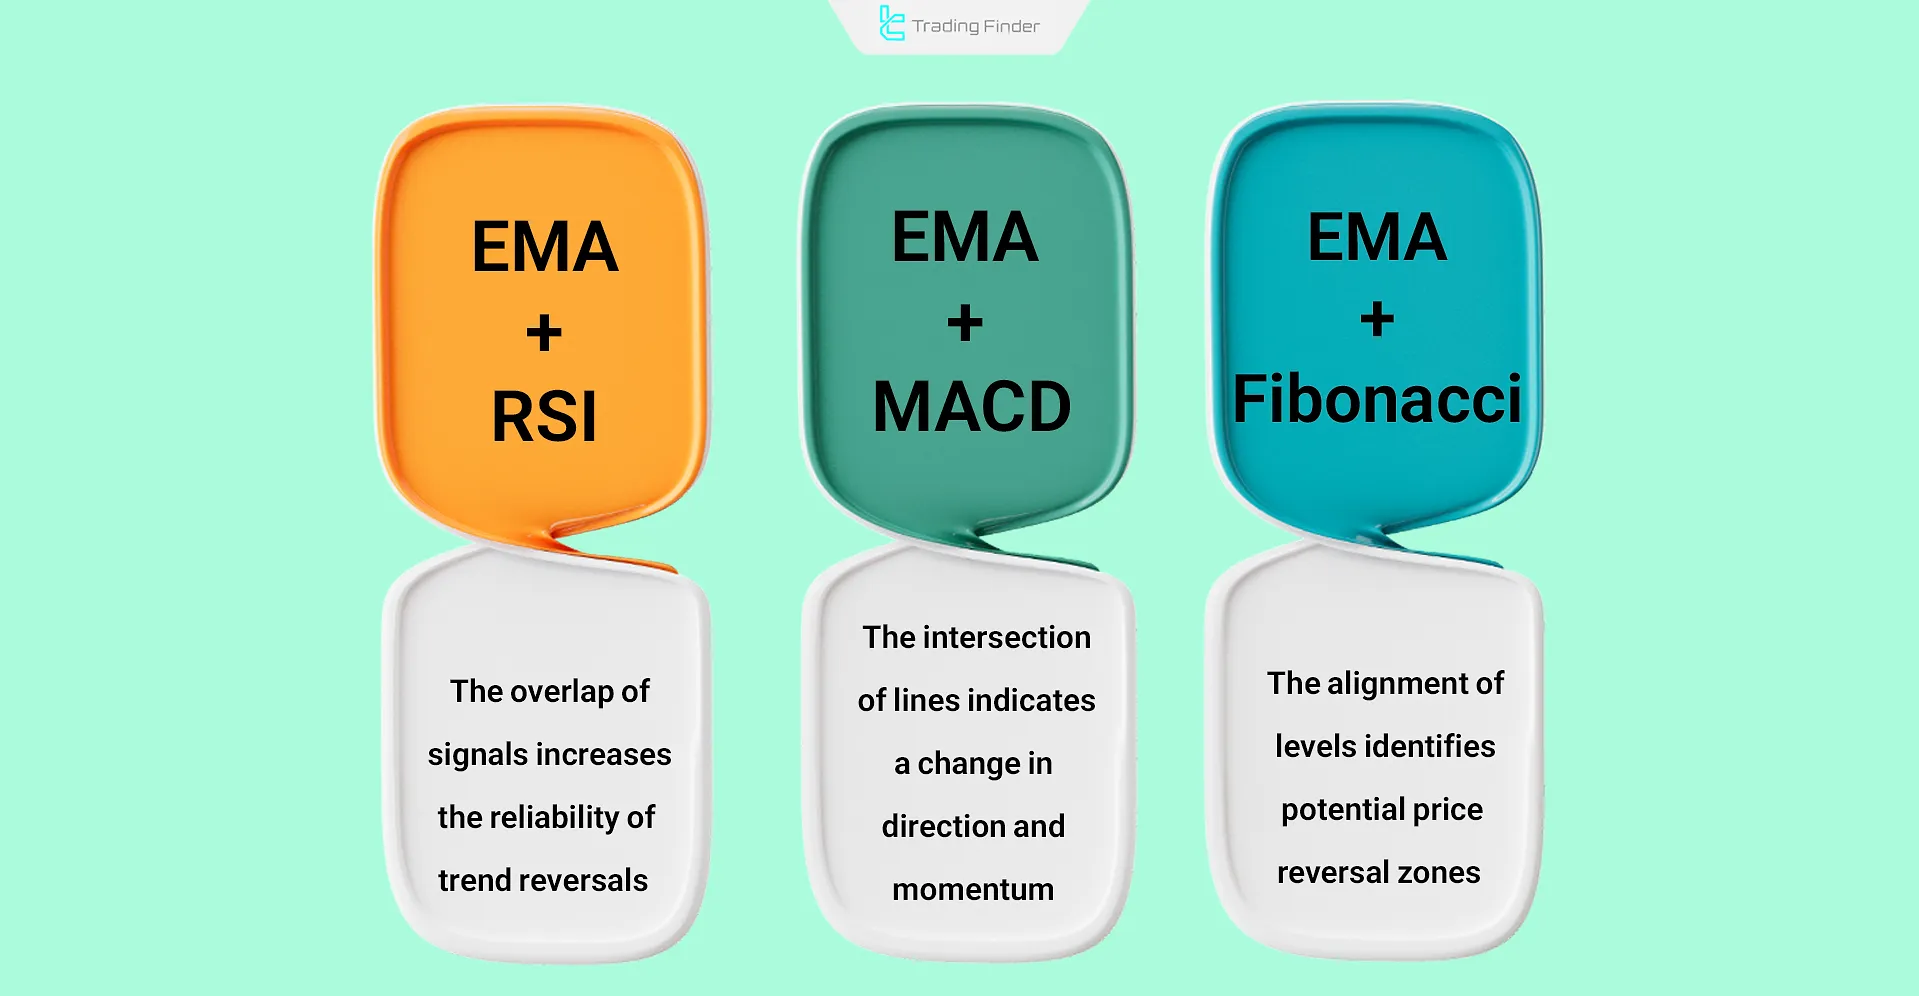
- EMA + RSI: Overlapping signals in overbought or oversold zones increase the reliability of reversal points;
- EMA + MACD: The intersection of EMA lines within the MACD structure indicates a shift in market trend and momentum;
- EMA + Fibonacci: Alignment of EMA levels with Fibonacci retracement zones identifies potential price reversal areas.
Example of a Trading Strategy Using EMA 9 and EMA 21
In this strategy, two Exponential Moving Averages (EMAs) with periods of 9 and 21 are used to identify short-term trend reversals.
- Buy Signal: When EMA 9 crosses above EMA 21 from below, market momentum turns bullish, generating a buy entry signal;
- Sell Signal: When EMA 9 crosses below EMA 21 from above, momentum shifts bearish, producing a sell or exit signal.
To improve accuracy and eliminate false signals, trades should only be executed in the direction of the dominant trend.
For instance, if the price is above the EMA 200, only buy signals are valid, while if the price is below EMA 200, only sell signals should be considered.
This strategy performs effectively on short-term timeframes ranging from 15 minutes to 1 hour and is suitable for day trading and scalping styles.
Difference Between Exponential (EMA) and Simple (SMA) Moving Averages
The Exponential Moving Average (EMA) is highly sensitive and responsive, which is why traders often customize its settings for their strategies. It's mostly used in short-term, volatile markets.
In contrast, the Simple Moving Average (SMA) is less reactive, making it more suitable for long-term timeframes. The SMA is typically used to identify the overall market trend in higher timeframes.
Comparison Table of Simple and Exponential Moving Averages:
Feature | Simple Moving Average (SMA) | Exponential Moving Average (EMA) |
Weighting of Data | Evenly distributes weight across all historical data | Focuses weight on recent data with gradually decreasing importance of older data |
Reaction to Price Changes | Slow reaction with a lagging nature when facing price fluctuations | Fast and sensitive reaction to real-time changes and market movements |
Price Noise | Smooth chart with low noise level and effective filtering of sudden movements | More volatile curve with high sensitivity to short-term changes |
Trend Stability | Greater stability in medium- and long-term trends with minimal fluctuations | High adaptability in short-term trends and changing market conditions |
Trading Application | Tool for identifying overall market direction and determining general trend structure | Tool for detecting price reversals and providing fast entry/exit signals |
Signal Delay | High delay in reflecting price reversals | Minimal delay and rapid response to market direction changes |
Effectiveness in Short Timeframes | Less suitable for fast trades and scalping strategies | Highly compatible with short-term trading and reactive algorithms |
Signal Reliability | Stable and reliable signals with low error probability | Fast and dynamic signals with higher likelihood of temporary error |
Behavior in High Volatility Markets | High stability against intense volatility and consistent trend maintenance | Immediate reaction to price movements with potential for false signals |
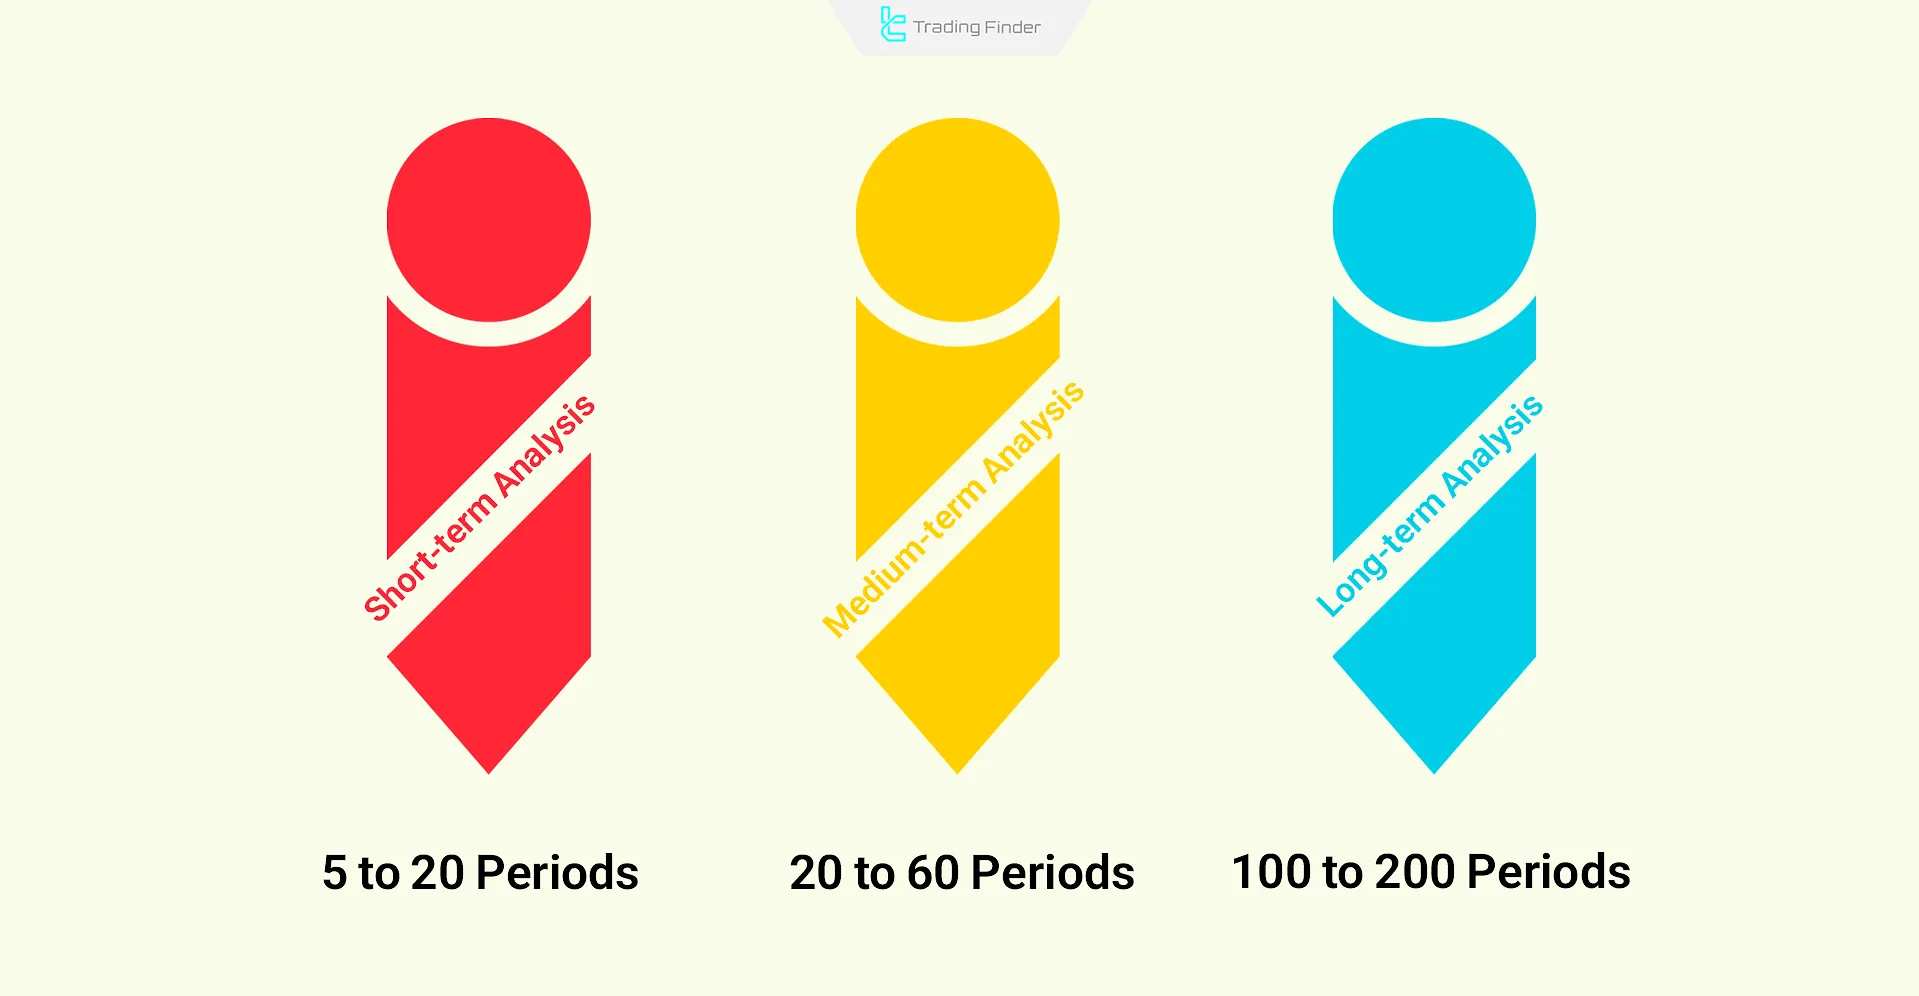
Best EMA Settings
To use the Exponential Moving Average indicator, specific settings can be applied for different timeframes:
- Short-term analysis: 5 to 20 periods
- Medium-term analysis: 20 to 60 periods
- Long-term analysis: 100 to 200 periods
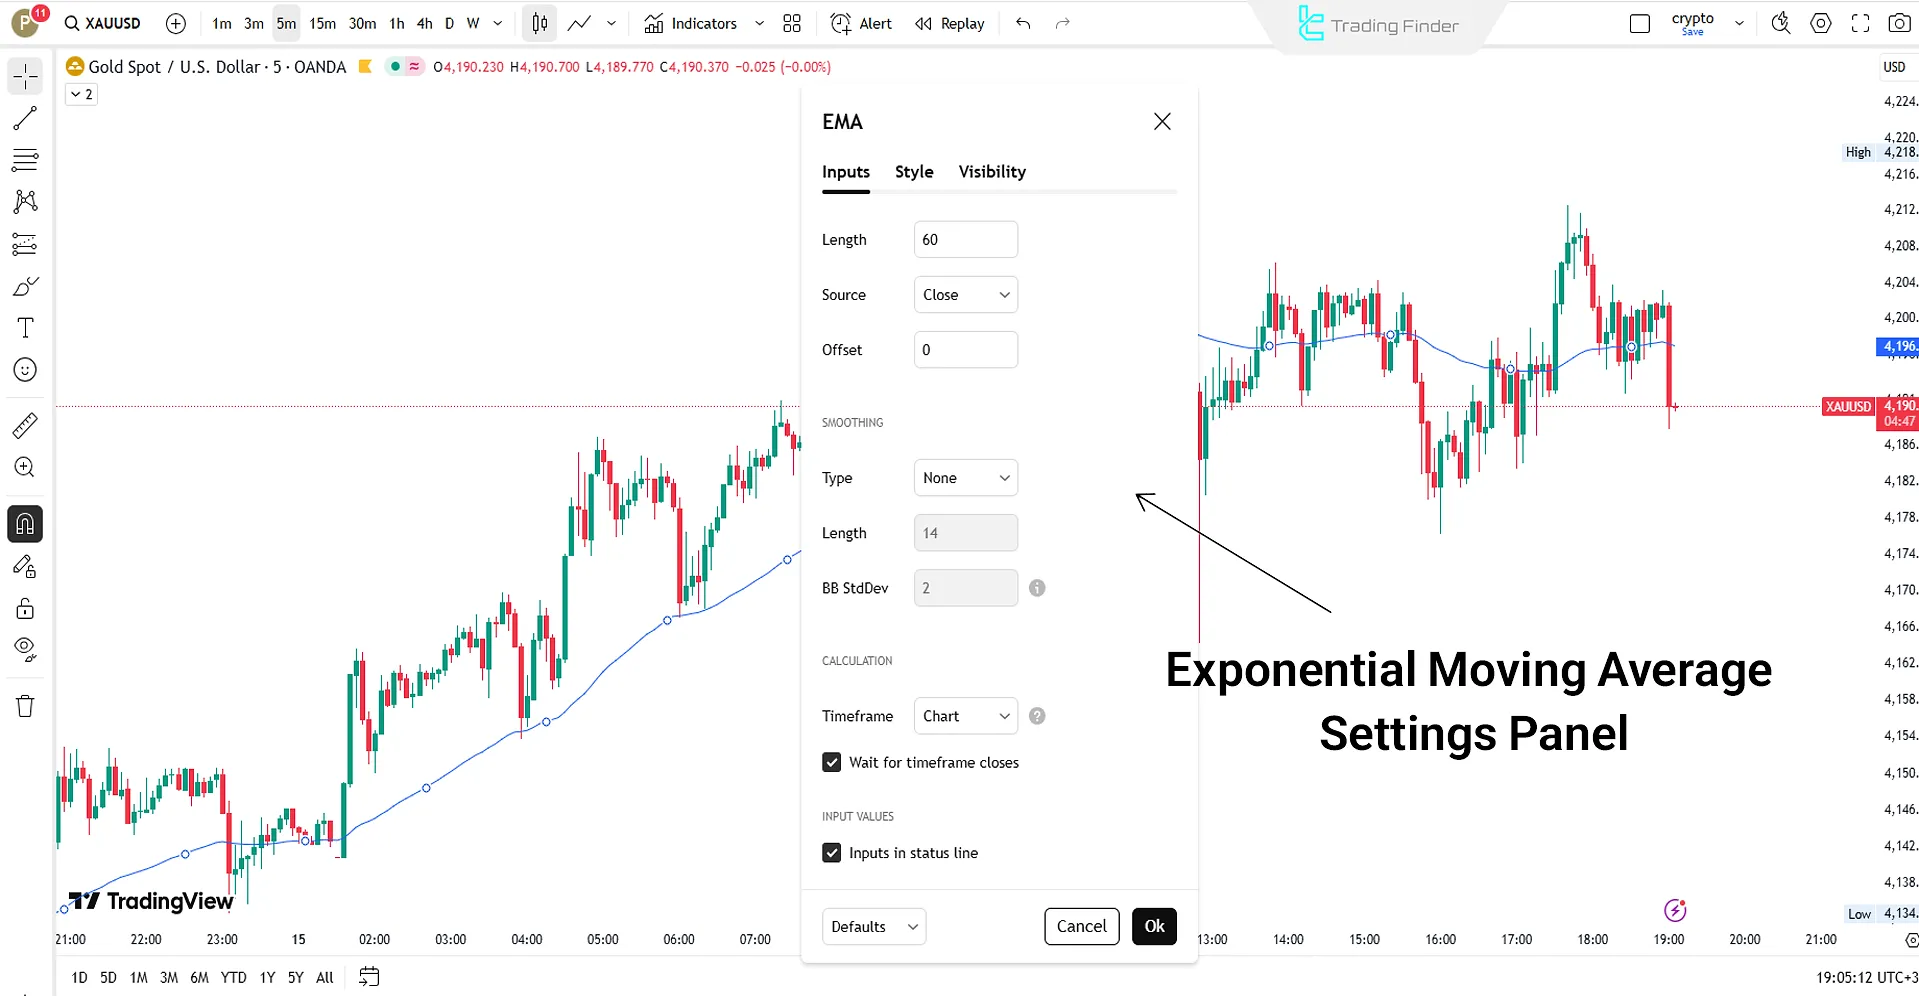
EMA Indicator Settings in Analytical Platforms
To add and configure the EMA indicator in platforms like TradingView or MetaTrader, follow these steps:
- From the Indicators menu, select Exponential Moving Average;
- Enter the desired period value (such as 12, 26, or 52);
- Adjust the line color and thickness in the Style section;
- For multi-timeframe analysis, add several EMAs with different settings to the chart.
More details on selecting the best EMA settings are provided in the educational video on the NetPicks Smart Trading Made Simple YouTube channel.
How to Use the Exponential Moving Average in Technical Analysis
The Exponential Moving Average (EMA) is one of the key tools in technical analysis for identifying trends, determining dynamic support and resistance levels, and confirming market direction.
The applications of EMA are as follows:
- When EMA is below the price, it indicates an uptrend;
- When EMA is above the price, it indicates a downtrend;
- The slope and angle of EMA show the market’s speed and momentum;
- It acts as a dynamic support or resistance and identifies price reaction zones.
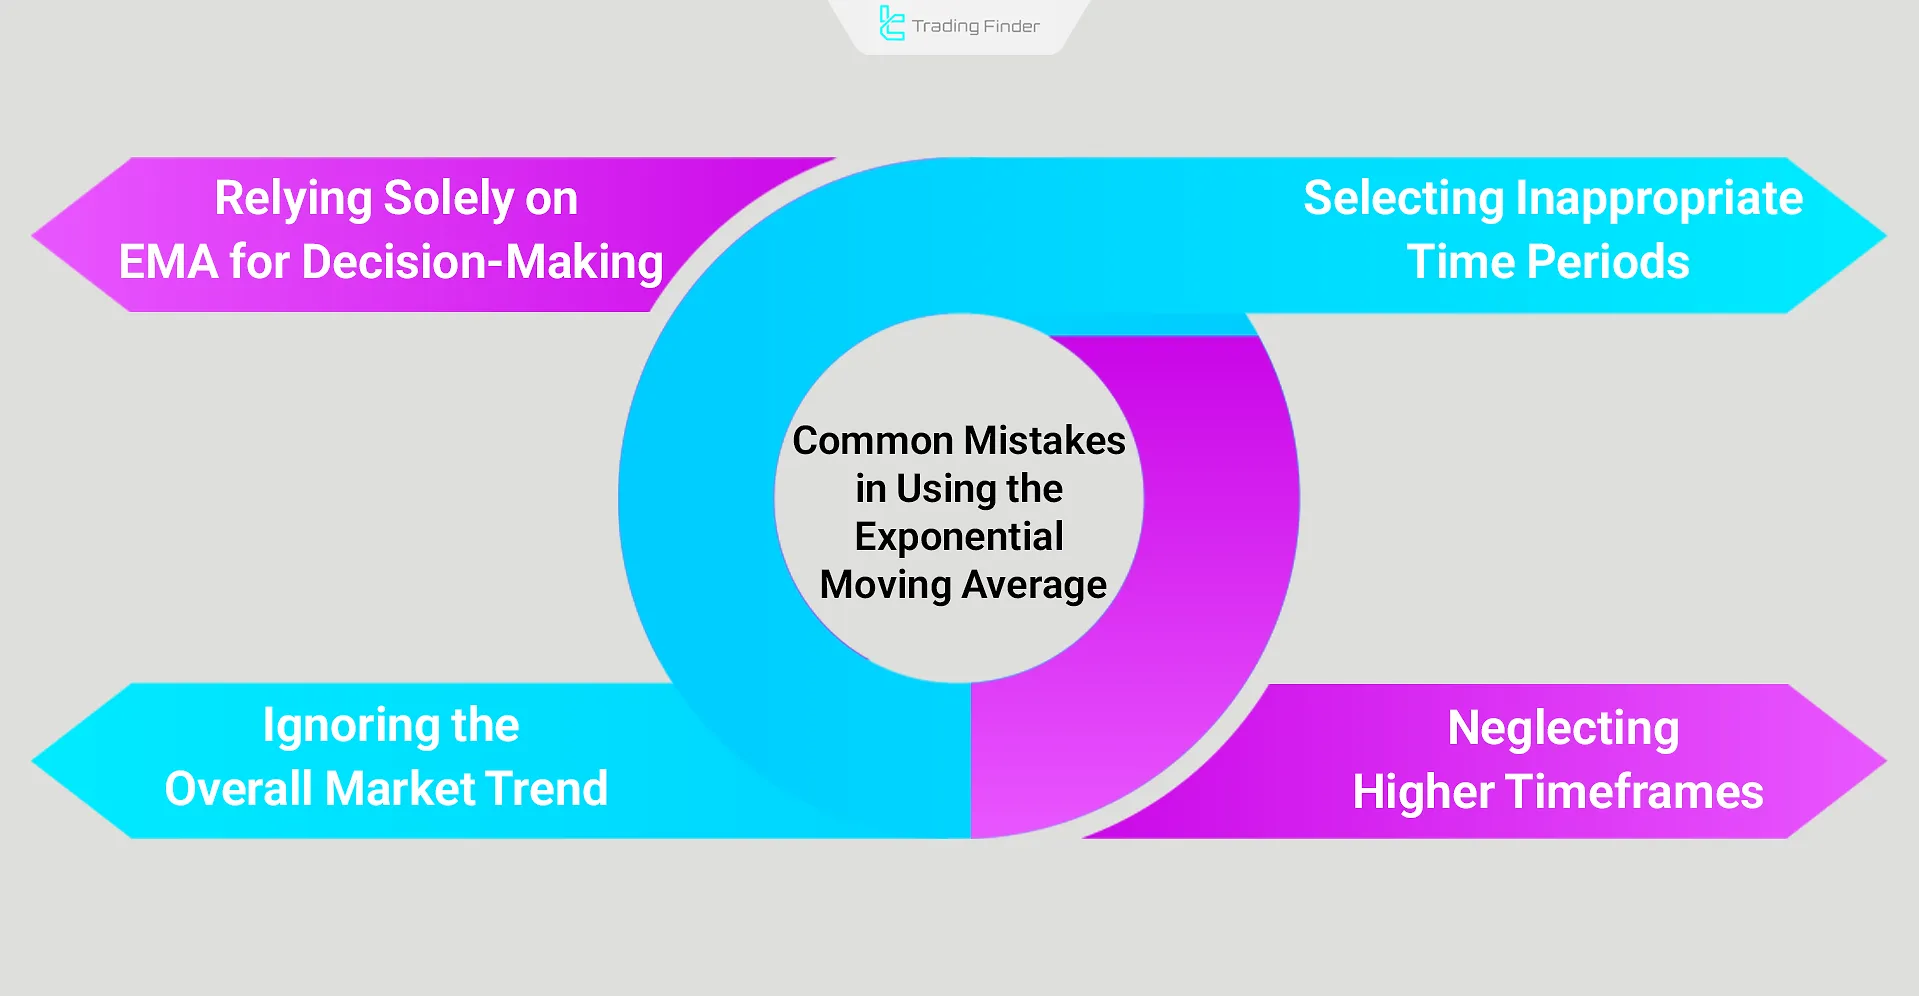
Common Mistakes in Using the Exponential Moving Average
EMA can be a powerful tool for trend analysis and identifying entry and exit points; however, incorrect use may lead to wrong trading decisions. Some of the most common mistakes include:
- Relying solely on EMA for decisions: Using EMA alone without considering price action, trading volume, or other confirming indicators can lead to false signals;
- Selecting inappropriate time periods: Improper EMA period settings can cause delayed or overly volatile signals, reducing analytical accuracy;
- Ignoring the overall market trend: Trading against the main trend is usually unprofitable; EMA should always be interpreted in the direction of the dominant trend;
- Neglecting higher timeframes: Analyzing EMA on only one timeframe provides limited insight; simultaneous analysis across multiple timeframes enhances signal reliability.
Triple Exponential Moving Average (TEMA) Indicator for MetaTrader
The Triple Exponential Moving Average (TEMA) indicator is one of the most advanced technical analysis tools in the MetaTrader platform, designed to reduce signal lag and improve accuracy in identifying market trends.
Developed by Patrick Mulloy, this indicator was created to address the weaknesses of Simple Moving Averages (SMA) and Exponential Moving Averages (EMA). Its calculation is based on a three-stage smoothing process, making it respond to price changes faster and more precisely than traditional models.
- Triple Exponential Moving Average (TEMA) Indicator for MT5
- Triple Exponential Moving Average (TEMA) Indicator for MT4
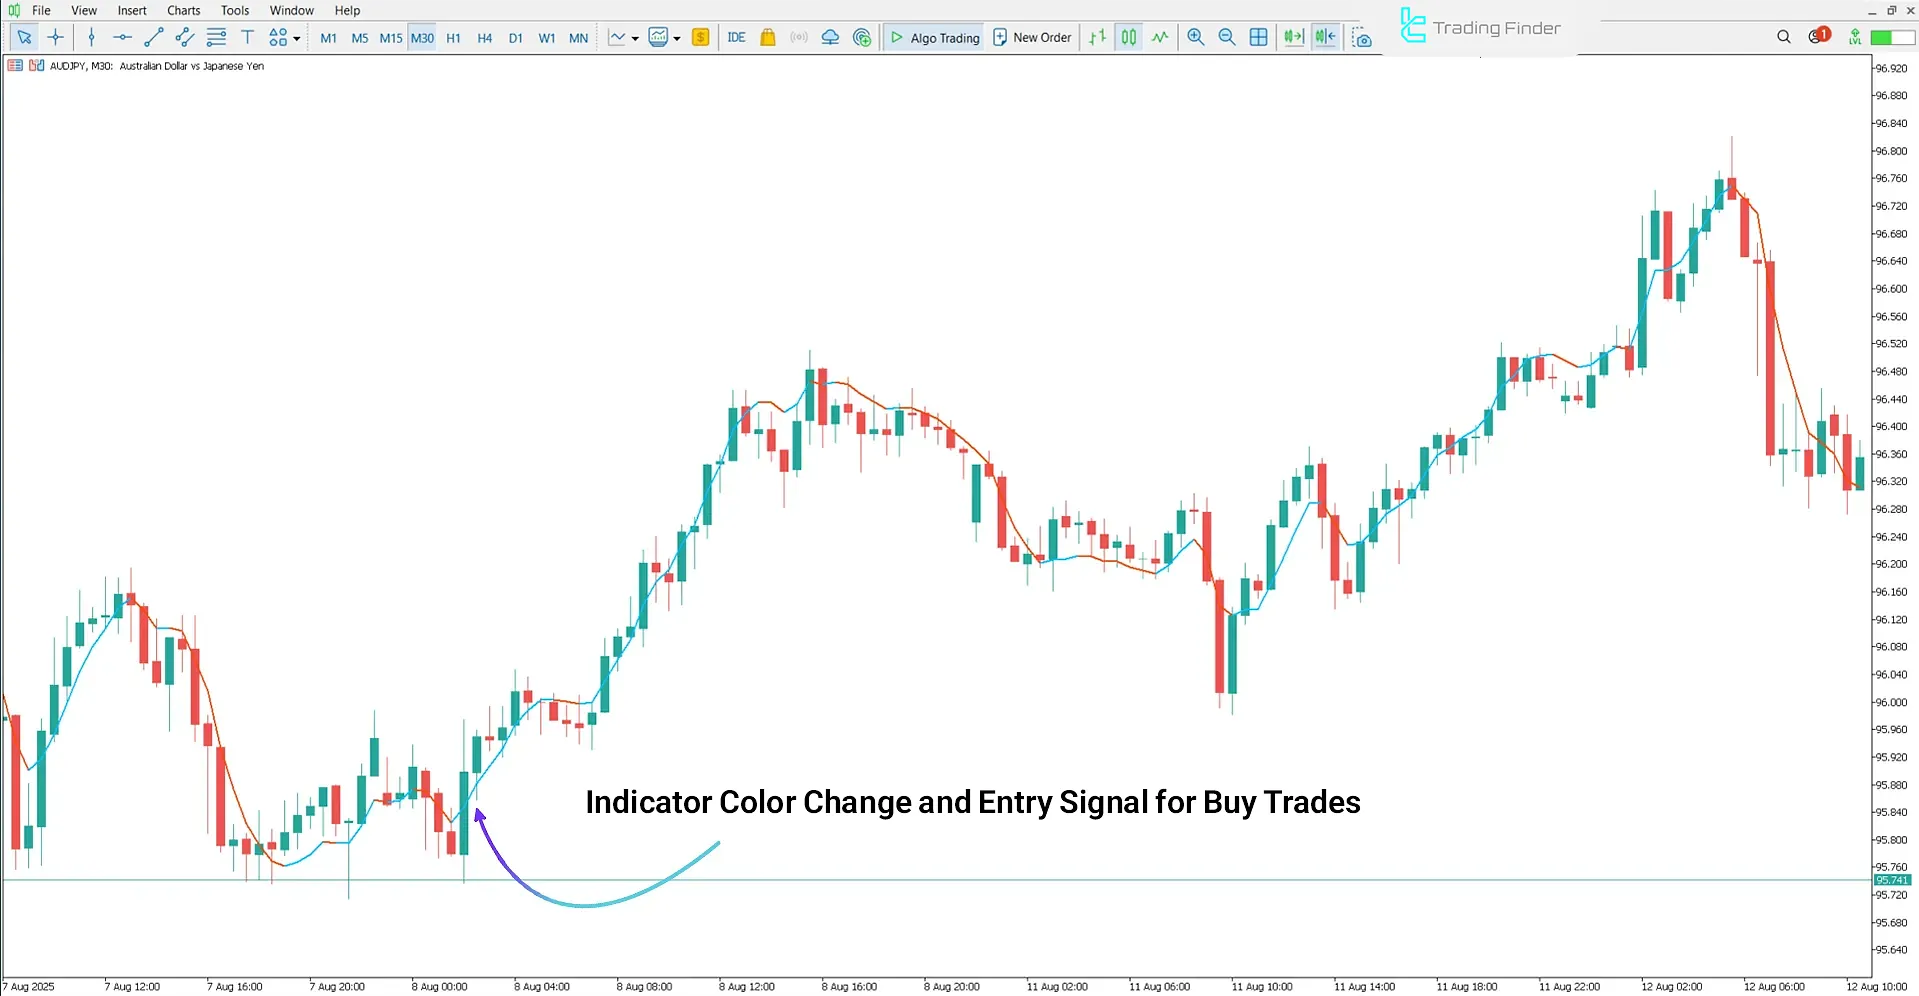
In the TEMA indicator, the main line is usually color-coded according to the market direction: blue indicates a bullish phase, while red represents a bearish trend.
This color scheme allows traders to recognize the prevailing market condition at a glance. When the line’s slope turns positive and the color changes to blue, a Buy Signal is generated; conversely, a shift to red with a negative slope signals a Sell Signal.
For example, on a 30-minute chart of a currency pair, a change in color to blue indicates the return of buyer strength and a potential buy opportunity. On an hourly chart of an index, a negative slope and a red color typically reflect increasing selling pressure and a continuation of the bearish movement.
In the settings section, the user can configure parameters such as Period, Shift, Apply To, Show In Color, and management options like Alert, Email, and Notification. Enabling automatic alerts or notifications ensures that no important signal is missed.
The TEMA indicator is suitable for a wide range of markets including Forex, stocks, commodities, indices, and cryptocurrencies.
Because it gives more weight to recent data, it is an effective tool for momentum analysts and price action traders.
Combining fast responsiveness, calculation precision, and interpretive simplicity, TEMA has become one of the most widely used technical indicators in MetaTrader.
Golden Tips to Improve EMA Signal Accuracy
To increase precision when using EMA, the following points are essential:
- Confirm with Trading Volume: Consider any crossover valid only when accompanied by rising volume;
- Combine with Simple Moving Average (SMA): Using EMA and SMA together can help reduce market noise;
- Avoid Constantly Changing Settings: Excessive parameter adjustments can invalidate backtesting results;
- Perform Multi-Timeframe Analysis: First determine the overall trend on the daily timeframe, then analyze shorter EMAs on lower timeframes.
Conclusion
The Exponential Moving Average (EMA) is a tool for trend-following trades, providing faster reactions compared to the SMA. Due to its responsiveness to price changes, this indicator generates multiple signals in short-term periods.
Traders often use the EMA in their strategies to capture more trading opportunities, as it can be combined with various strategies such as the Crossover strategy and price action integration across different markets.


