


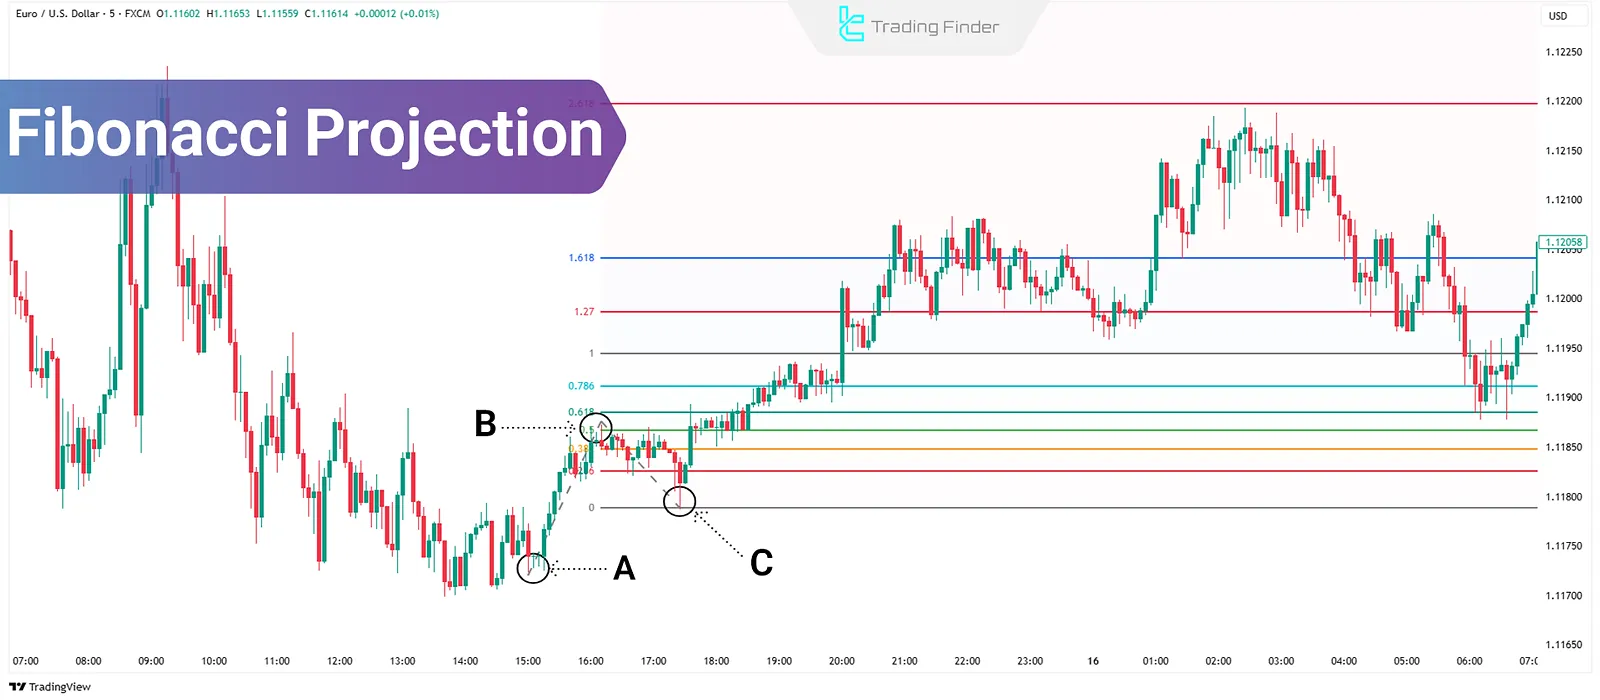
Fibonacci Projection in technical analysis is a tool used to calculate price targets in the direction of a trend. By selecting threepoints on a chart (A-B-C), levels are computed where the price is likely to react.
These levels are based on ratios such as 1.27, 1.618, and 2.618 and are commonly used to set targets after corrective moves. The accuracy of this tool depends on correctly identifying the points and understanding the structure of pricemovement.
What Is Fibonacci Projection?
Fibonacci Projection is used to forecast price targets along the continuation of a trend.
Unlike Fibonacci Retracement, which focuses on reversal zones during corrections, this tool identifies levels that the price may reach as the trend continues.
How to Draw Fibonacci Projection?
How to activate and use the Fibonacci Projection:
- Go to the left toolbar in TradingView;
- Click the icon for Fibonacci tools (third option from the top);
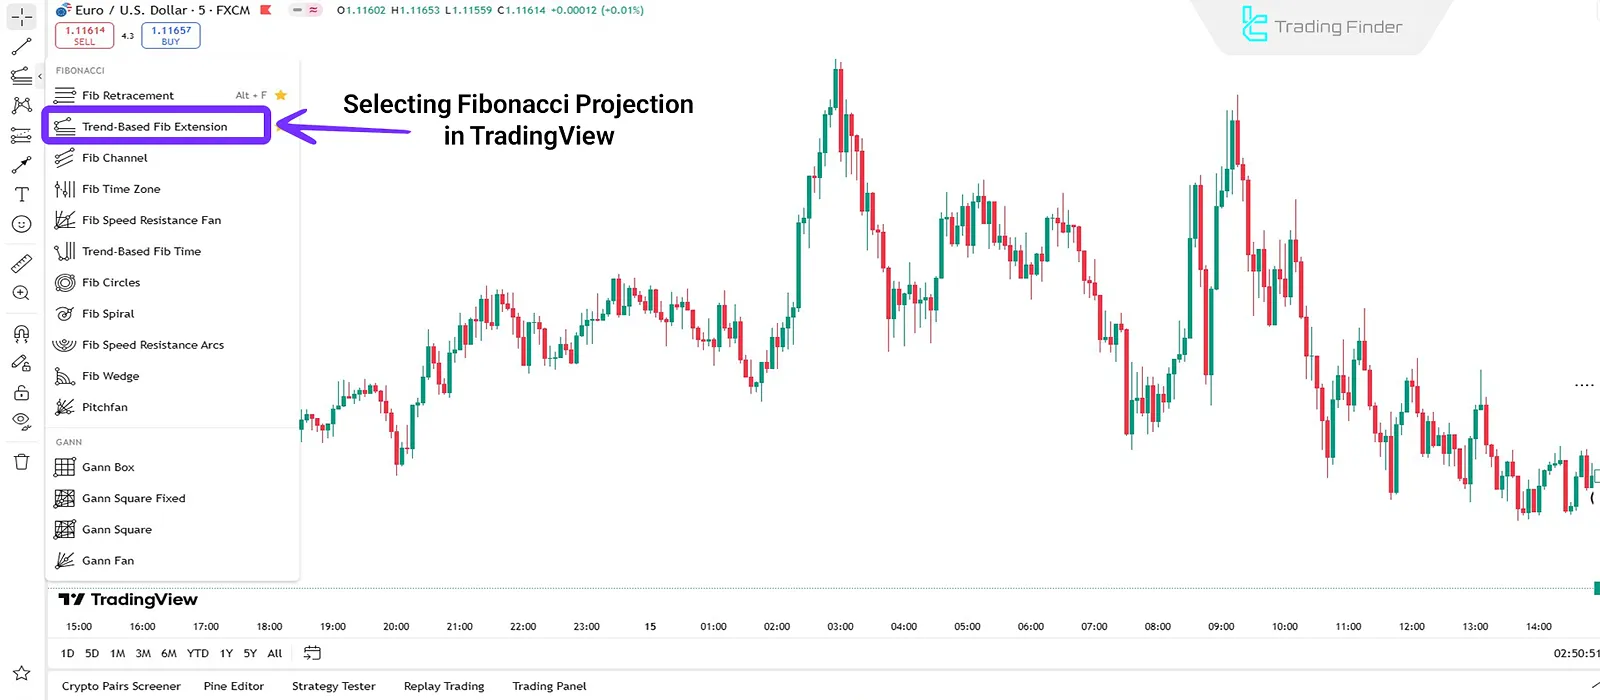
- From the dropdown list, select "Trend-Based Fib Extension";
- Click to mark the start of the trend (point A);
- Click again to mark the end of the trend (point B);
- Finally, click the retracement point (point C) to complete the projection.
Drawing Fibonacci Projection Using Three Points:
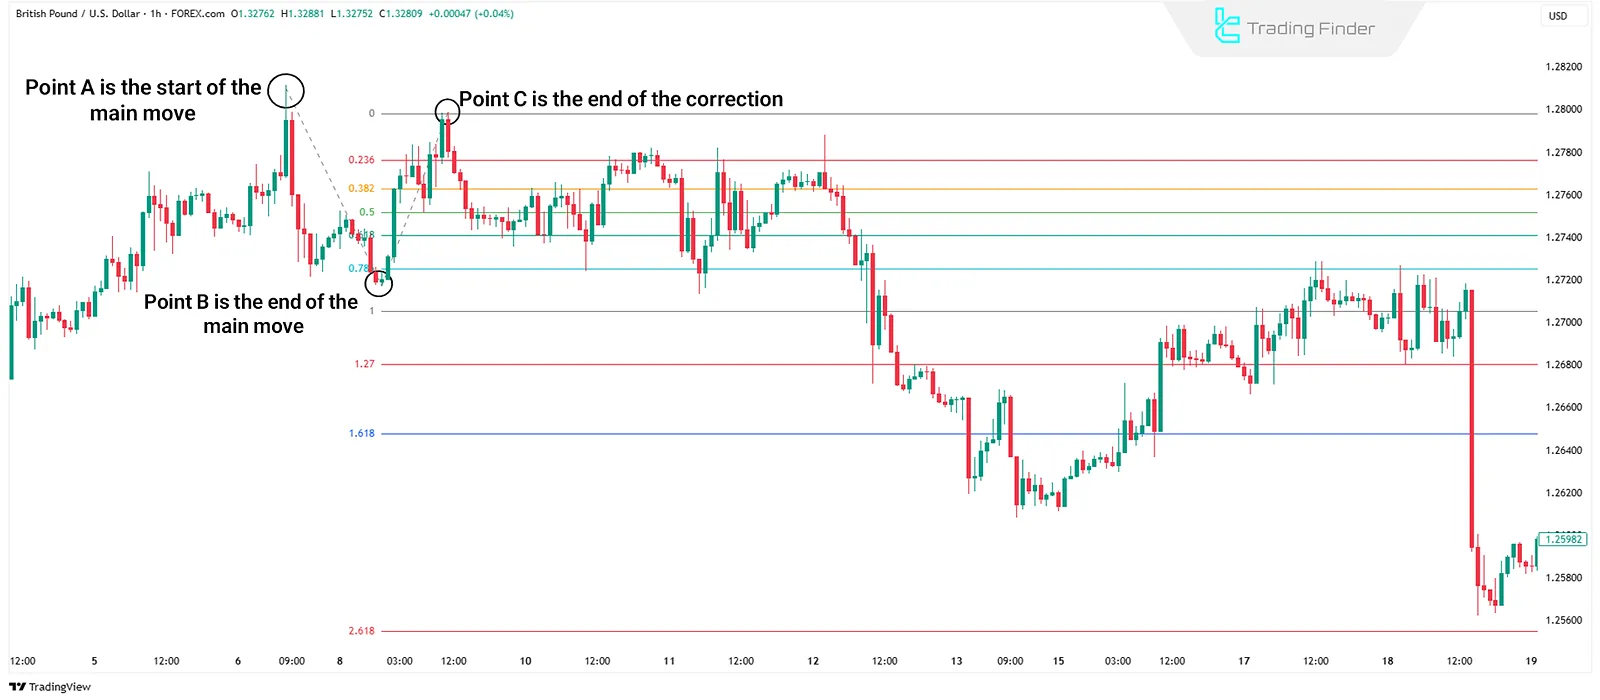
- Point A: Start of the main move (trend origin)
- Point B: End of the main move (top or bottom of wave 1)
- Point C: End of the correction (start of the next wave)
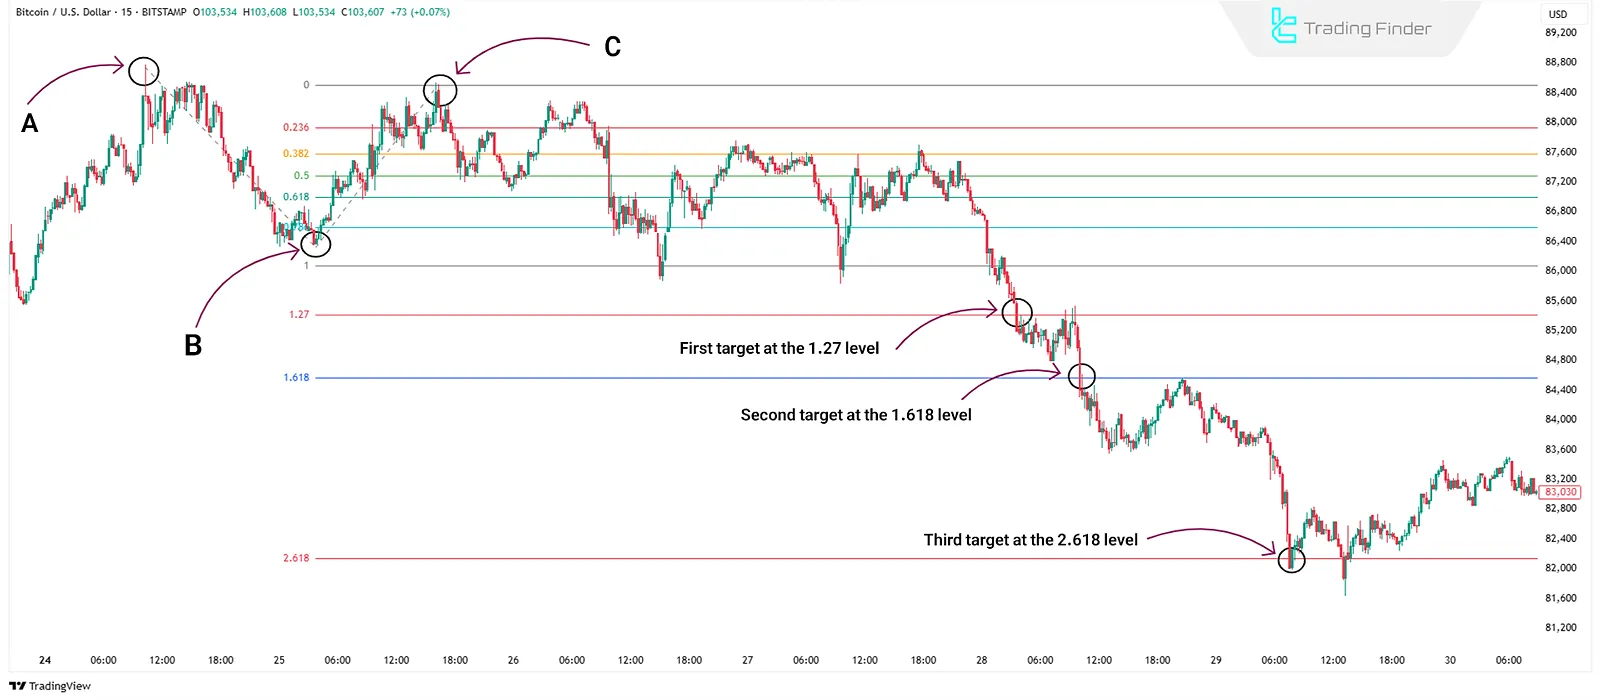
After selecting these three points, the tool measures the A to B distance and projects it from point C, creating various price targets based on Fibonacci ratios such as 1.00, 1.27, 1.618, 2.618, and more.
Difference from Other Fibonacci Tools
Unlike retracement and expansion tools, Fibonacci Projection uses three points and is employed for projecting price targets along a trend. Different types of Fibonacci tools and their distinction from Fibonacci Projection include:
- Fibonacci Retracement: Requires only two points and is used to identify the end of a correction, whereas Fibonacci Projection uses three points and is used for target setting;
- Fibonacci Expansion: Similar to projection, it uses a different wave logic to extend prices and is less common in public platforms.
Using Fibonacci Projection in Three Steps
To use the Fibonacci Projection, the analyst needs three points from price movement. After marking these points, the tool displays levels that serve as price targets during trend continuation. Steps for using Fibonacci Projection in trading:
#1 Select the Points
Fibonacci Projection requires three points:
- Start of the move
- End of the move
- End of the next correction
These typically form a wave, a correction, and the beginningof a newwave.
#2 Draw the Tool
Select the "Trend-Based Fib Extension" tool on the charting platform. The analyst marks the three points in order to plot the relevant levels.
#3 Interpret the Levels
Levels 1.00, 1.27, 1.618, and 2.618 are among the most common targets. Price may react to these zones during continuation moves; The credibility of these levels increases when combined with other tools.
Combining Fibonacci Projection with Complementary Tools
Fibonacci Projection can independently identify target levels, but for enhanced analytical accuracy, it must be combined with other tools. Key complementary tools include:
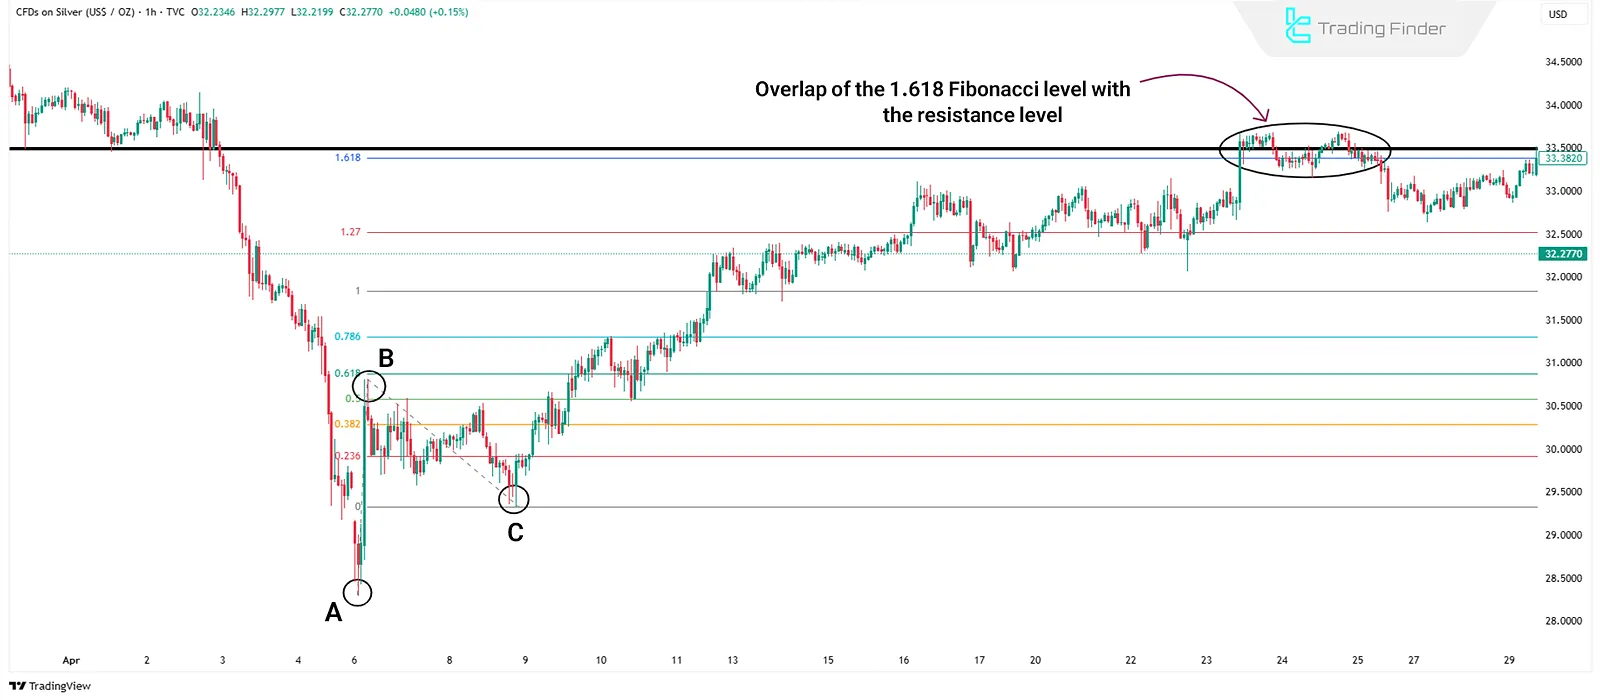
Support and Resistance
If a Fibonacci Projection level overlaps with a key support or resistance zone, the likelihood of the price reacting at that point increases.
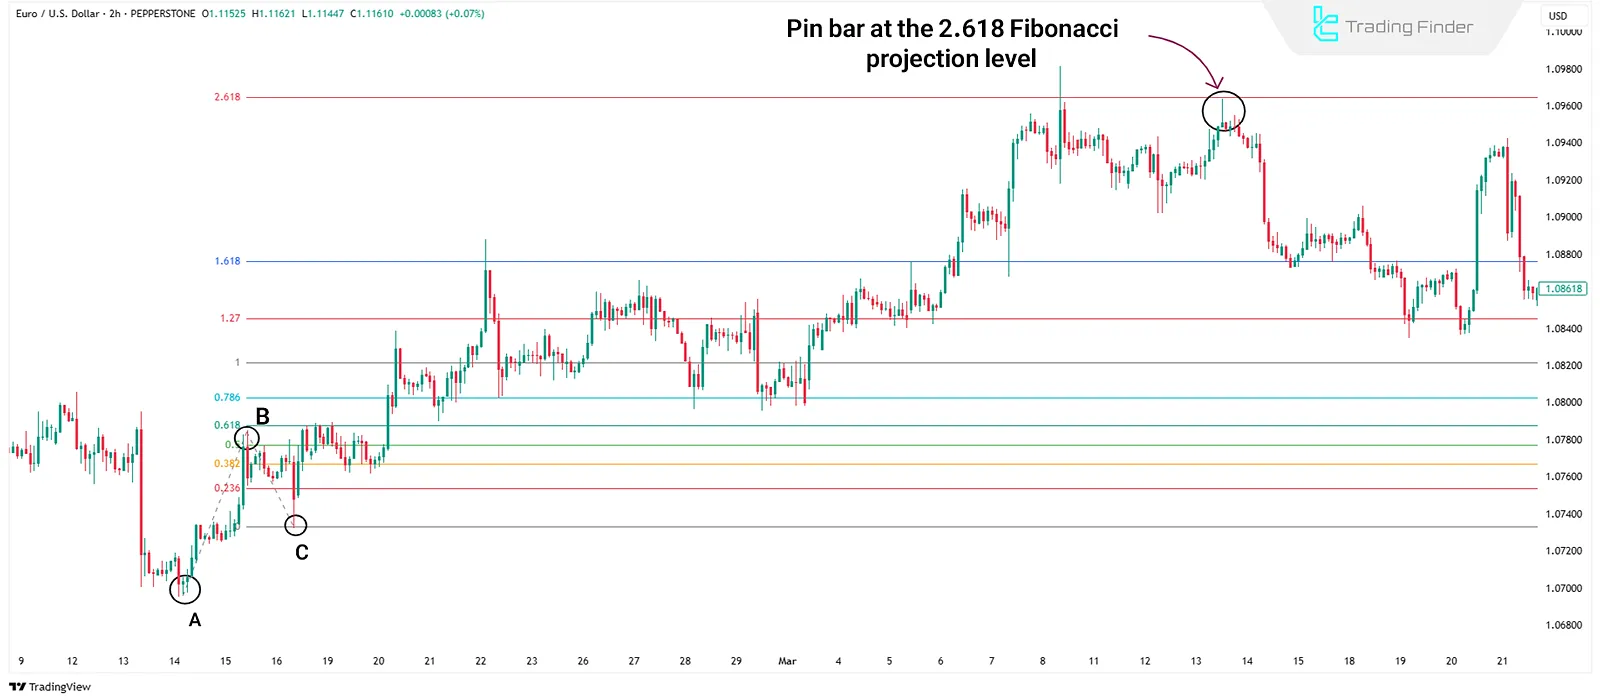
Candlestick Patterns
When patterns such as pin bars, engulfing patterns, or dojis appear near projection levels, those levels gain added significance.
This combination is particularly useful for deciding on exits or potentialreversals.
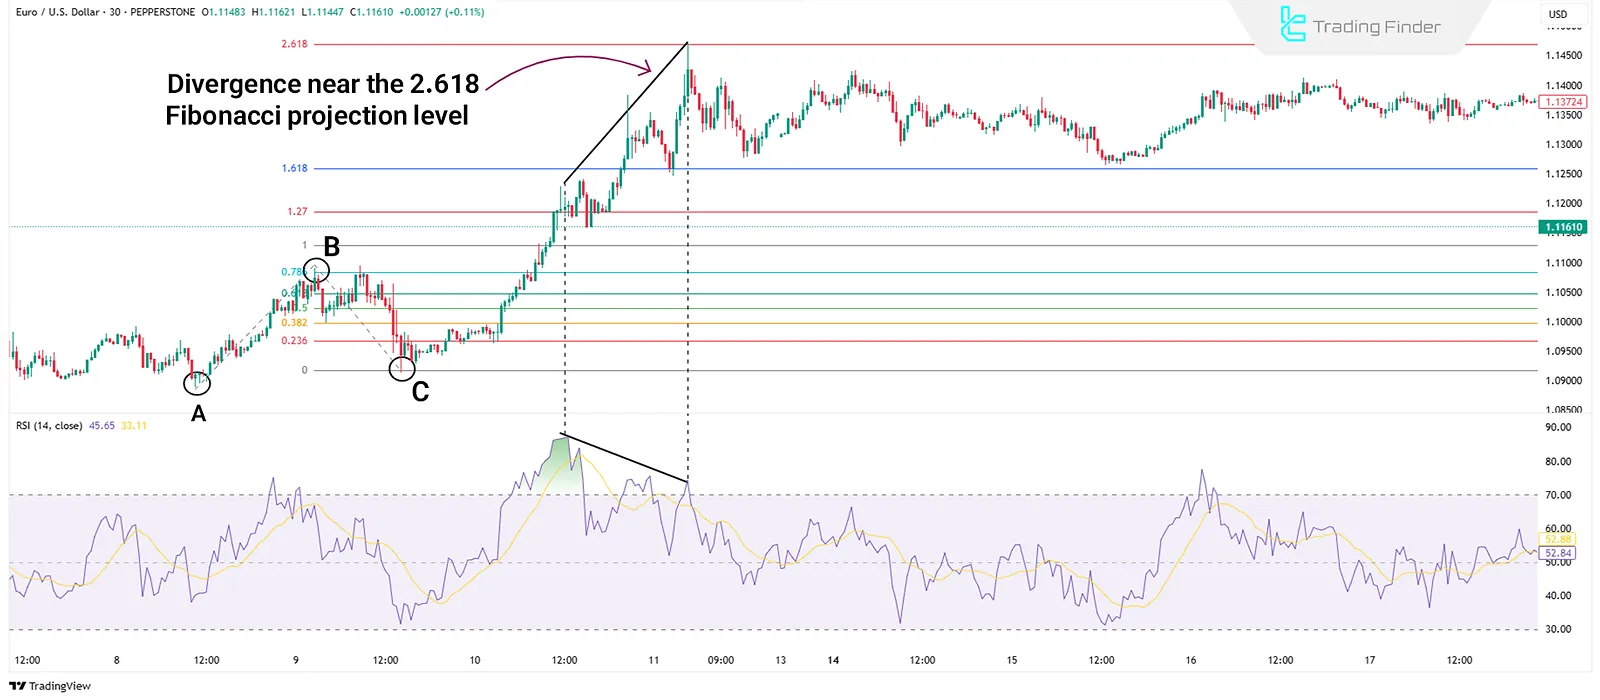
Indicator Divergence
Price divergence in RSI or MACD around levels like 1.27, 1.618, or 2.618 can signal trend weakness and possible correction or reversal.
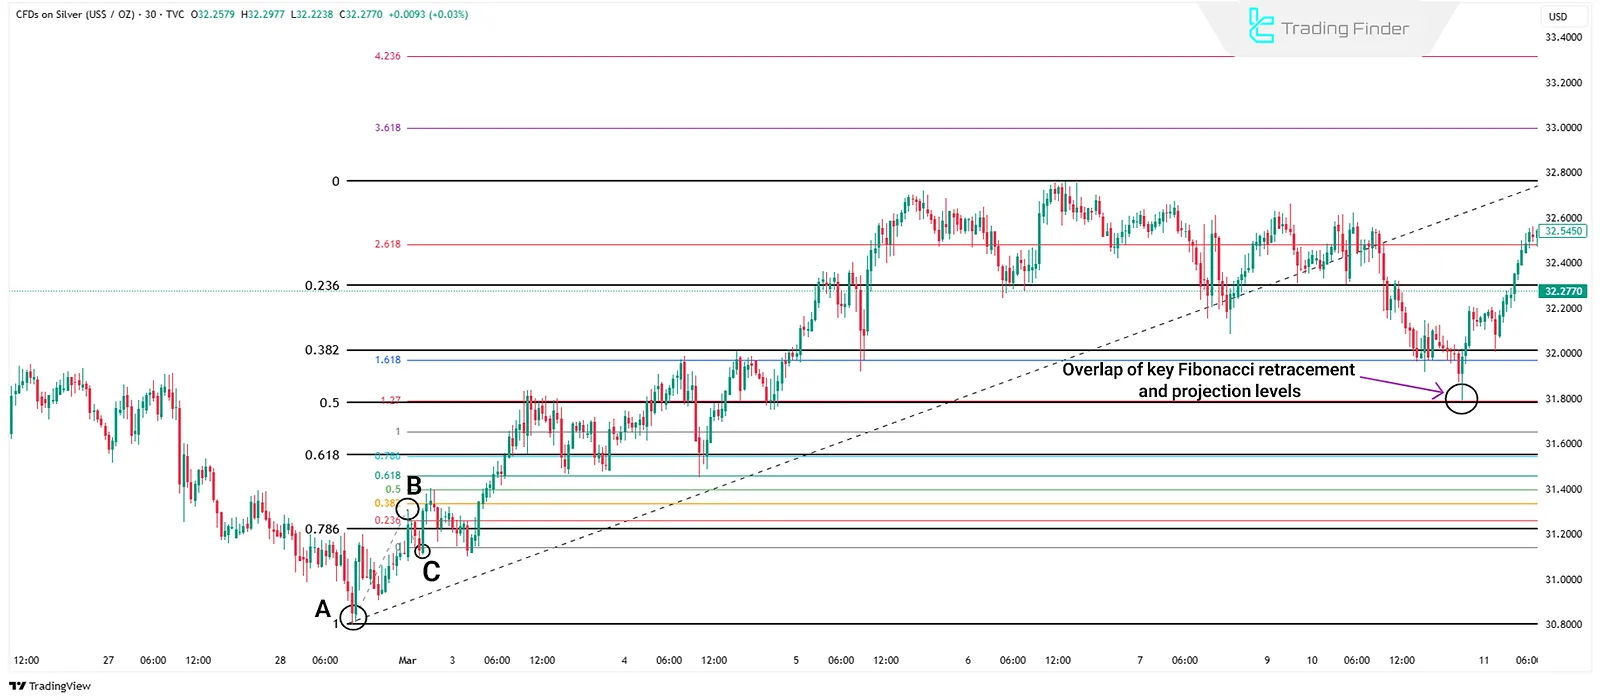
Combination with Fibonacci Retracement
When projection and retracement levels overlap, they form a PRZ (Potential Reversal Zone)—among the best areas to consider entry or exit from trades.
Common Mistakes in Using Fibonacci Projection
Using the Fibonacci Projection requires precision in point selection and an understanding of market structure. Both beginners and experienced traders may fall into traps that reduce the reliability of their analysis. Key mistakes include:
Incorrect Selection of Points A-B-C
Since Fibonacci Projection relies on three main points, any error—such as selecting an incomplete correction instead of a valid one at point C—renders the levels unreliable.
Ignoring Confirmations
Relying solely on projection levels without confirmation from candles, volume, or divergences can lead to false signals.
Overdependence on the Tool
Solely relying on the Fibonacci Projection without understanding overall market trends, wave structure, or price behavior results in weak analysis. This tool is only one part of a decision-making system.
Using It in Unfit Market Conditions
In sideways or trendless markets, the Fibonacci Projection is mostly ineffective. It's designed for clear trends with identifiable corrections.
Overdrawing on Every Move
Some traders apply the Fibonacci Projection on every minor wave, cluttering their analysis with irrelevant levels. The tool must be used with wave logic and filtering.
Conclusion
Projection levels act as majorsupport or resistance on highertimeframes (e.g., daily); if confirmed by a pattern or candle on lower timeframes, they generate stronger signals.
Also, combining projection with Retracement may form overlapping zones called PRZ (Potential Reversal Zones). These areas, especially near 1.27 and 1.618, are crucial for trade exits or trend reversals.


