


Hidden divergence is a concept in technical analysis defined based on indicators. Traders use it to identify trend continuation.
Unlike regular divergence, this type of divergence indicates the continuation of the current price direction.
What is Hidden Divergence in Technical Analysis?
Hidden divergence in technical analysis occurs when the price continues the trend, but the indicator shows signs of apparent changes in movement.
Unlike regular divergence, which refers to trend reversal, hidden divergence typically indicates trend continuation and confirms the market's direction.
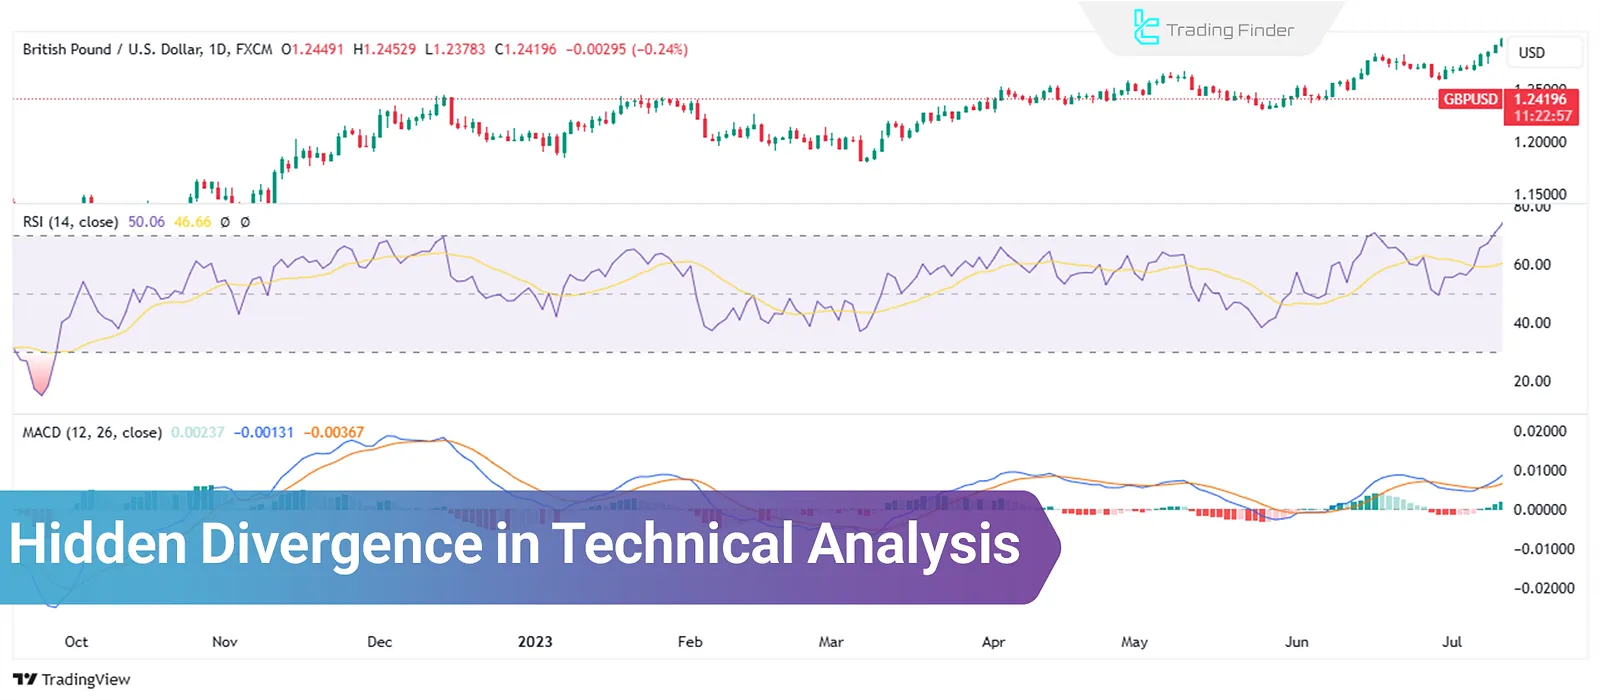
This concept applies to various financial markets, including stocks, cryptocurrencies, and the forex market. Hidden divergence in forex is considered one of the key methods for identifying trend continuation opportunities.
Types of Hidden Divergence in Technical Analysis
In general, hidden divergences occur in two forms:
- Bullish
- Bearish
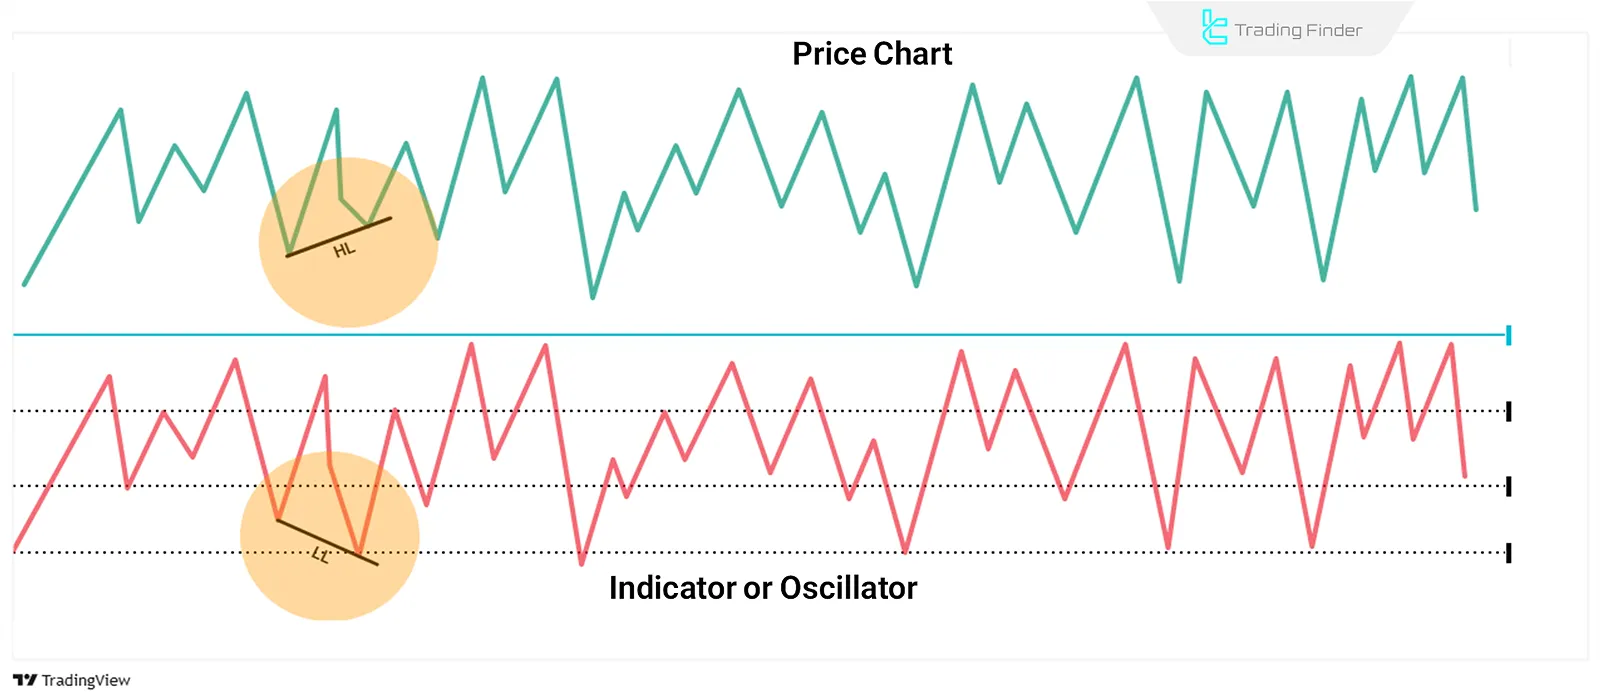
Bullish Hidden Divergence
Bullish hidden divergence occurs when the price forms a higher low, but the indicator shows a lower low.
This situation typically appears in an uptrend and can signal the continuation of the price increase.
In the image below, an example of a bullish hidden divergence is visible:
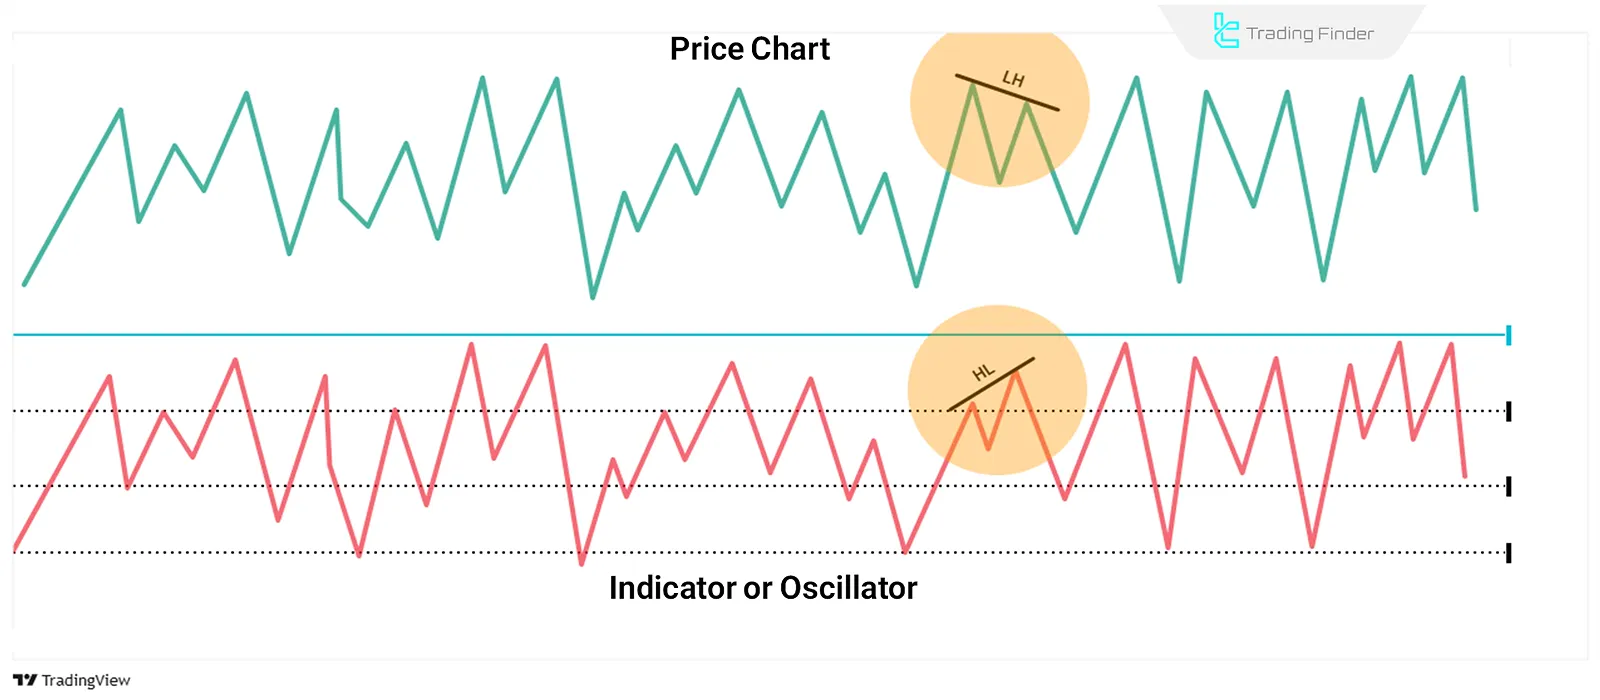
Bearish Hidden Divergence
Bearish hidden divergence occurs when the price forms a lower high, but the indicator shows a higher high. This situation is usually observed in downtrends and acts as a signal for the continuation of price decline.
Trading with hidden divergence in these conditions can be useful for trading opportunities in the market's bearish direction.
In the image below, an example of bearish hidden divergence is visible:
Trading with Hidden Divergence in Technical Analysis
Trading with hidden divergence in technical analysis requires high precision and the use of confirmation tools. Steps to trade with hidden divergence:
#1 Identifying Hidden Divergence
First, you should check for hidden divergence between the price and the indicator. To do this, use indicators like RSI, MACD, and Stochastic.
#2 Confirming the Signals
To ensure the accuracy of the hidden divergence signal in technical analysis, it's better to use other tools like candlestick patterns, trendlines, and Fibonacci levels.
#3 Entering the Trade
Once the divergence is confirmed, you can enter the trade. In the case of bullish hidden divergence, you can enter a buy position, and in the case of bearish hidden divergence, you can enter a sell position.
#4 Risk Management
Set stop loss and take profit levels to prevent significant losses in case of market changes.
Comparison of Hidden Divergence with Regular Divergence
Regular divergence occurs when the price and the indicator move in opposite directions and is usually considered a sign of weakening the current trend and the potential for its reversal.
In contrast, hidden divergence happens when the price moves in the direction of the dominant trend, contrary to the indicator, and this situation typically confirms the continuation of the trend.
Simply put, regular divergence points to a market direction change, while hidden divergence strengthens the likelihood of trend continuation.
Is Hidden Divergence Usable in Forex?
Hidden divergence in forex is one of the popular analytical methods for identifying trend continuation points in currency pair price charts.
Using this concept, traders can stay in the dominant trend direction and use short-term corrections for lower-risk entries.
Conclusion
Hidden divergence in technical analysis is a tool for identifying trend continuations in financial markets. Hidden divergence is recognized by comparing the behavior of price and oscillators (indicators).
Trading with this method is particularly useful in forex, stocks, and cryptocurrencies and helps improve trading strategies, including trading with support or resistance breakouts, swing trading, and price action patterns.


