


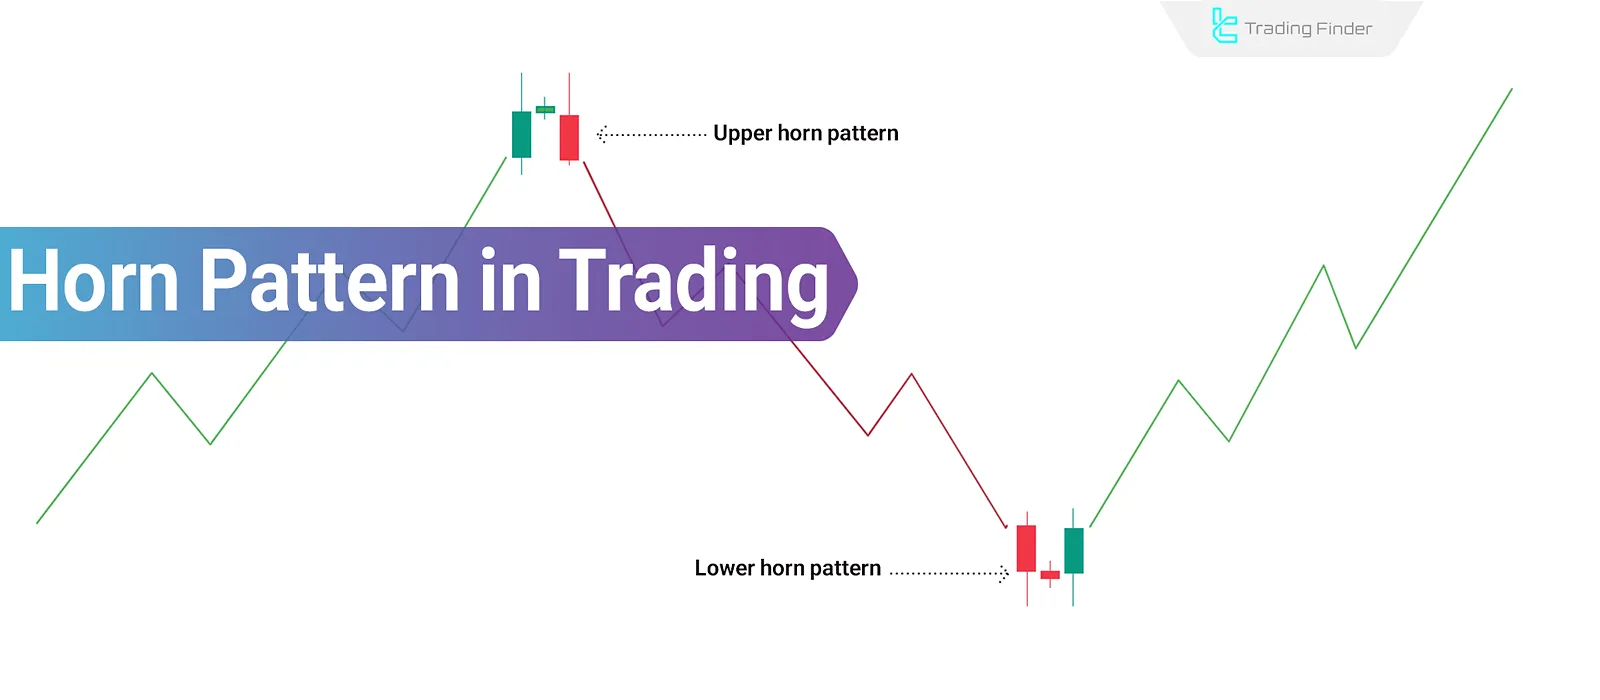
The Horn Pattern in technical analysis is one of the lesser-known reversal patterns that, unlike classical patterns, is based on the behavior of three consecutive candlesticks. Two large volatile candlesticks on either side and a small candlestick in between, form the core structure of this pattern.
This pattern appears in bullish (Horn Bottom) and bearish (Horn Top), forms and signals a short-term imbalance in the market trend, where, after two consecutive surges, the price undergoes a swift and strong reversal.
What is the Horn Pattern?
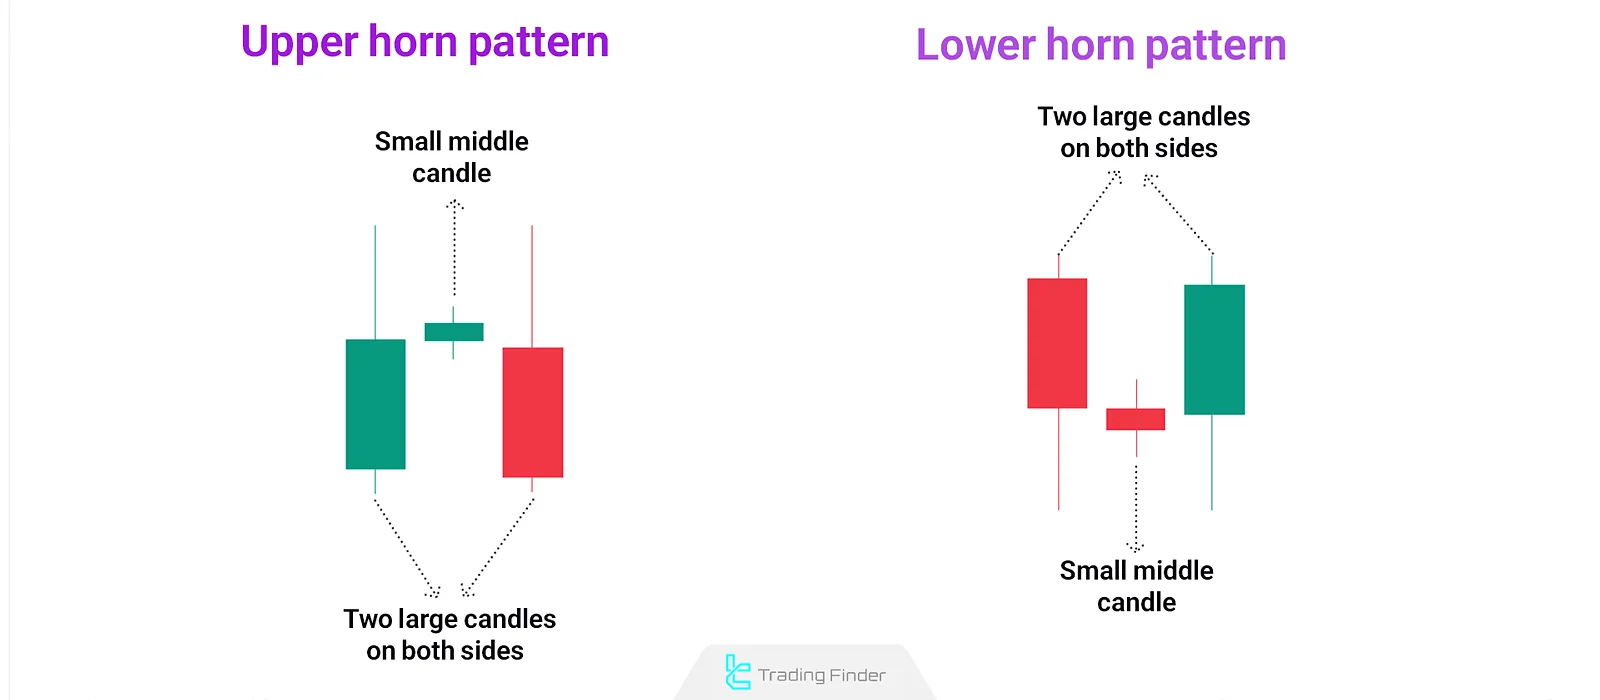
The Horn Pattern is a reversal pattern on the price chart formed by three candlesticks, with two large ones on either side and a small candlestick in between.
This pattern emerges when the price makes two sharp, rapid moves in one direction (e.g., upward or downward), but ultimately fails to continue, signaling a potential trend reversal.
If the two large candlesticks point upwards and appear at the top of the chart, it is called a Horn Top, usually indicating the start of a bearish trend.
Conversely, if the two large candlesticks point downwards and appear at the bottom of the chart, they form a Horn Bottom, suggesting a likely start of a bullish trend.
The small middle candlestick, situated between the two horns, indicates market hesitation and plays a crucial role in completing the pattern.
Despite visual similarities to patterns like the Double Top or Double Bottom, price reactions after completing the Horn Pattern are typically quicker, more volatile, and occur with higher volume.
Analysis of Top and Horn Bottom
The Horn Pattern appears in two different forms on the chart, each representing a specific type of trend reversal. The two primary variations are:
Horn Top
The Horn Pattern Trading is a bearish reversal formation that appears at the end of an upward trend. Its structure consists of two strong bullish candlesticks on either side and a small-bodied candlestick in between. This formation signals that, despite two consecutive surges in price, bullish momentum has weakened.
Horn Bottom
The Horn Pattern (Bottom) appears at the end of a downward trend, indicating a possible market reversal to the upside. Two strong bearish candlesticks on either side and a small central candlestick form the framework of this pattern. It reflects sellers' failure to break support levels successfully.
Entry and Exit Strategies in the Horn Pattern
When entry and exit are based on well-defined rules, the effectiveness of the pattern improves significantly. These strategies rely on breakout confirmation of the pattern zone and candlestick behavior:
#1 Breakout Confirmation with a Closed Candlestick
The first rule is to wait for the candlestick to close outside the horn range. A mere temporary breakout or a candlestick wick is not sufficient. A valid breakout occurs when a full candlestick closes above the high of the right horn (in Horn Bottom) or below the low of the right horn (in Horn Top). This confirmation helps detect false breakouts.
#2 Entry Point
Entry in the Horn Pattern should take place immediately after a confirmed breakout. The ideal entry point is the closing price of the breakout candlestick or slightly lower (in Horn Top) and slightly higher (in Horn Bottom) to avoid entry delays In lower timeframes, entries can be fine-tuned using smaller candlesticks.
#3 Setting Target Using Support/Resistance or Fibonacci
Price targets can be defined using two methods:
- Previous Support and Resistance Levels: Support and Resistance are zones where the price has historically reacted;
- Fibonacci Levels: Based on the preceding trend, targets can be calculated using Fibonacci ratios such as 1.618 or 2.618 relative to the horn's height.
Preferably, the target should be placed before congestion zones to increase the likelihood of being reached.
#4 Setting a Proper Stop-Loss
To manage risk, the stop-loss must be placed logically near the pattern structure:
- In Horn Top: Above the wick of the right horn
- In Horn Bottom: Below the wick of the right horn
If the distance between the stop and the entry is too wide, it's better to adjust the position or reduce the trade size to control risk.
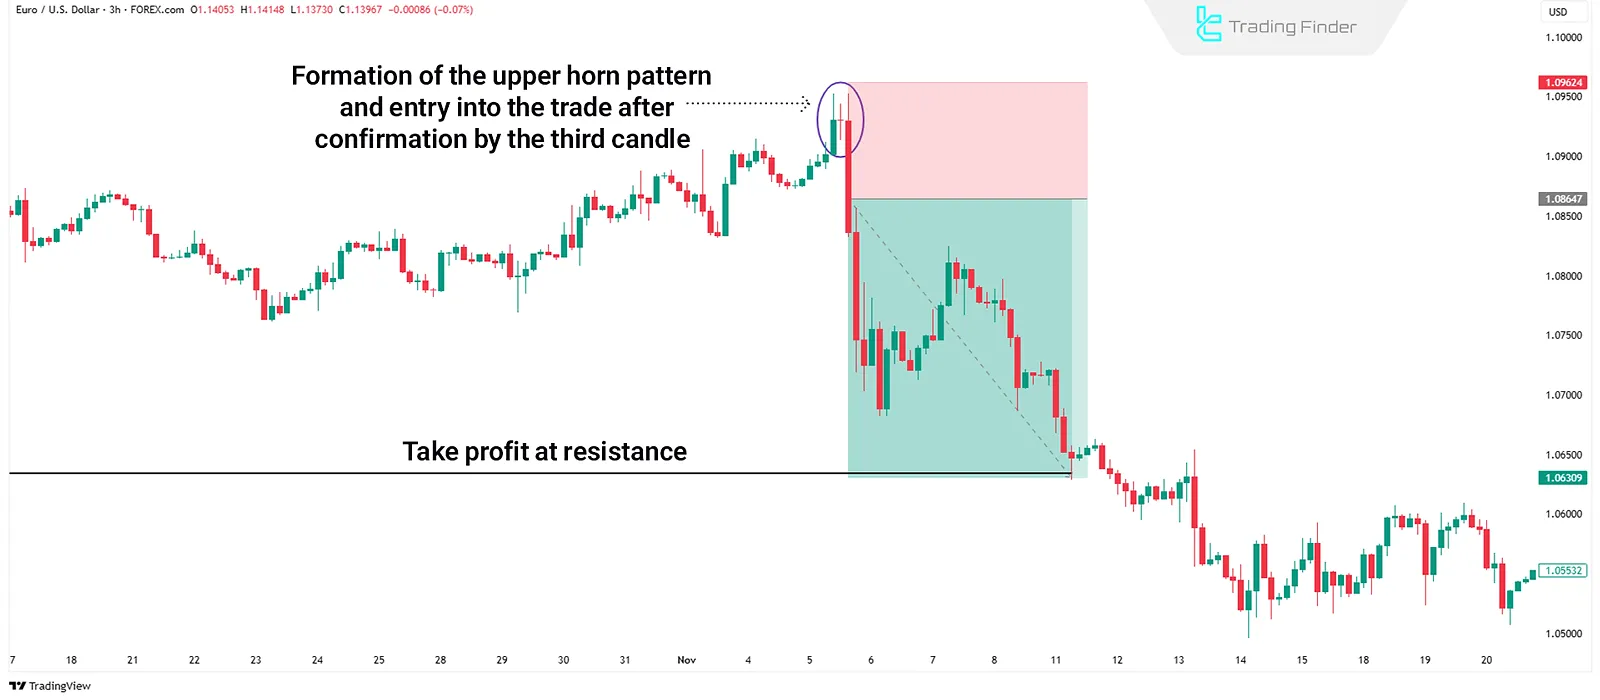
Example of Trading with Horn Top Pattern
On the EUR/USD chart, price has been in an upward trend, followed by two large bullish candlesticks forming within a short time span.
A small candlestick appears between them, indicating weakening buying pressure. Then, the price breaks below the low of the right horn with a strong bearish candlestick.
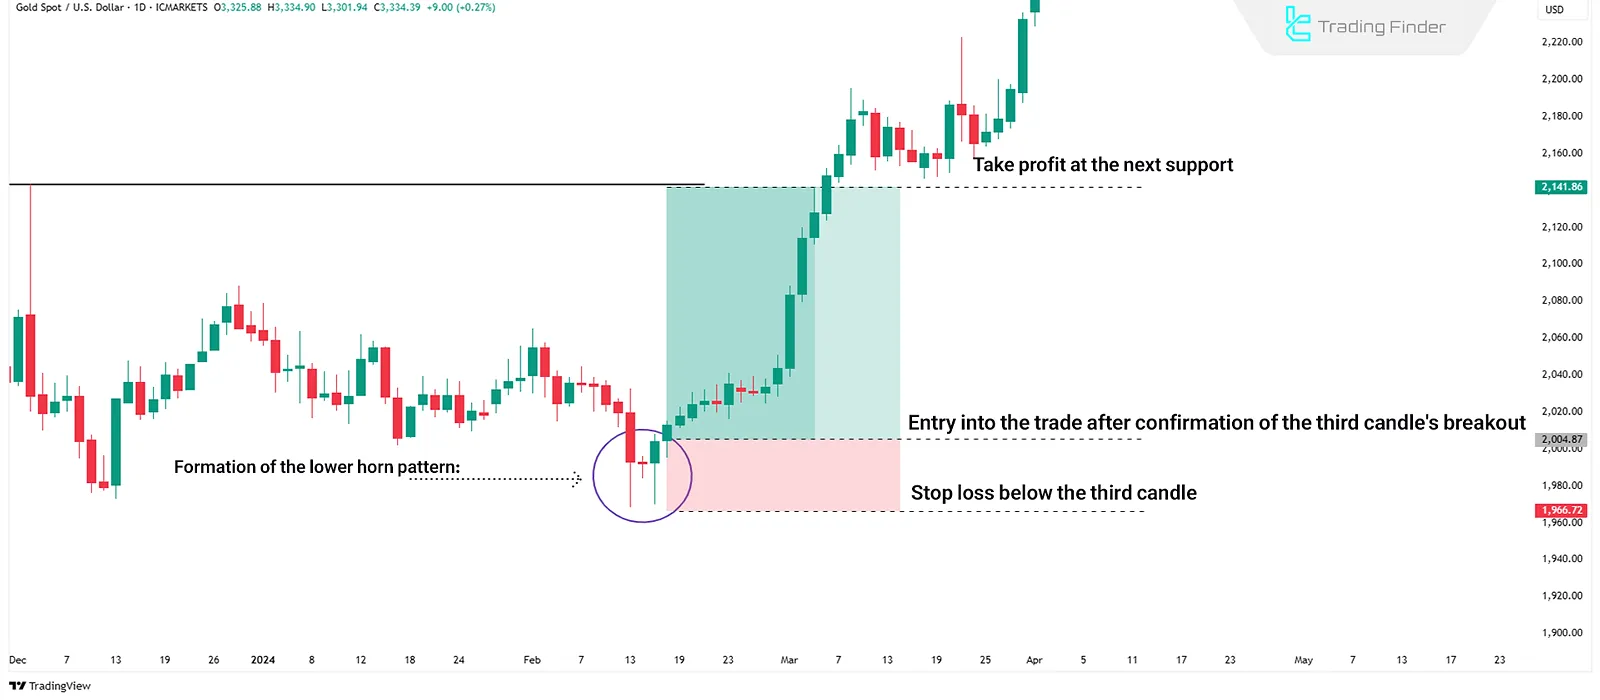
Example of Trading with Horn Bottom Pattern
In the example below, the XAU/USD (Gold) chart is analyzed at the end of a downtrend. Two powerful, bearish candlesticks appear close together, with a small candlestick in between. After a short while, the market closes above the high of the right horn, initiating a new bullish trend.
Combining the Horn Pattern with Expanding Range Patterns
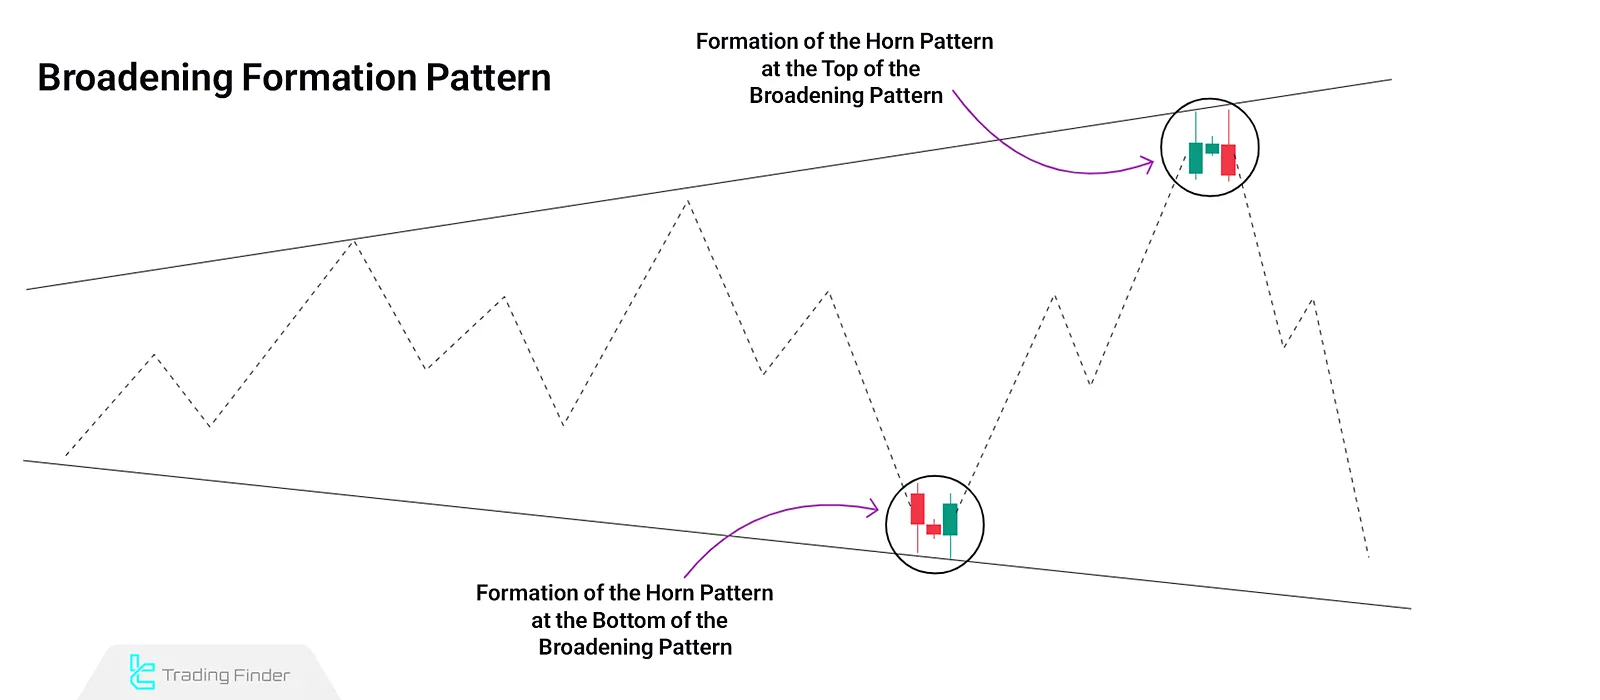
Combining the Horn Pattern with structures such as the Expansion Triangle Pattern, Megaphone Trading Pattern, and Broadening Formation Pattern can be useful for analyzing volatile zones in the market.
The formation of the horn at the terminal points of these patterns (whether at the top or bottom) is usually accompanied by changes in price behavior, which may indicate the beginning or end of a movement. In more symmetrical triangles, this combination is often associated with more limited fluctuations. In expanding patterns, such as the megaphone or broadening formation, the market reaction can be more intense and unstable.
Conclusion
The Horn Pattern Trading is a short-term reversal structure that can be identified by observing the arrangement of three consecutive candlesticks.
Its key distinction from similar patterns lies in the speed and volatility of price reaction post-pattern completion.
Analyzing this pattern requires more than just recognizing its shape. Candlestick ratios, trend context, and trading volume must all be evaluated together.
In a Horn Top, the price's inability to continue upward and the emergence of sellers signals the start of a bearish move. On the contrary, in a Horn Bottom, the reduction in selling pressure and the appearance of buyers may indicate the beginning of a bullish reversal.


