


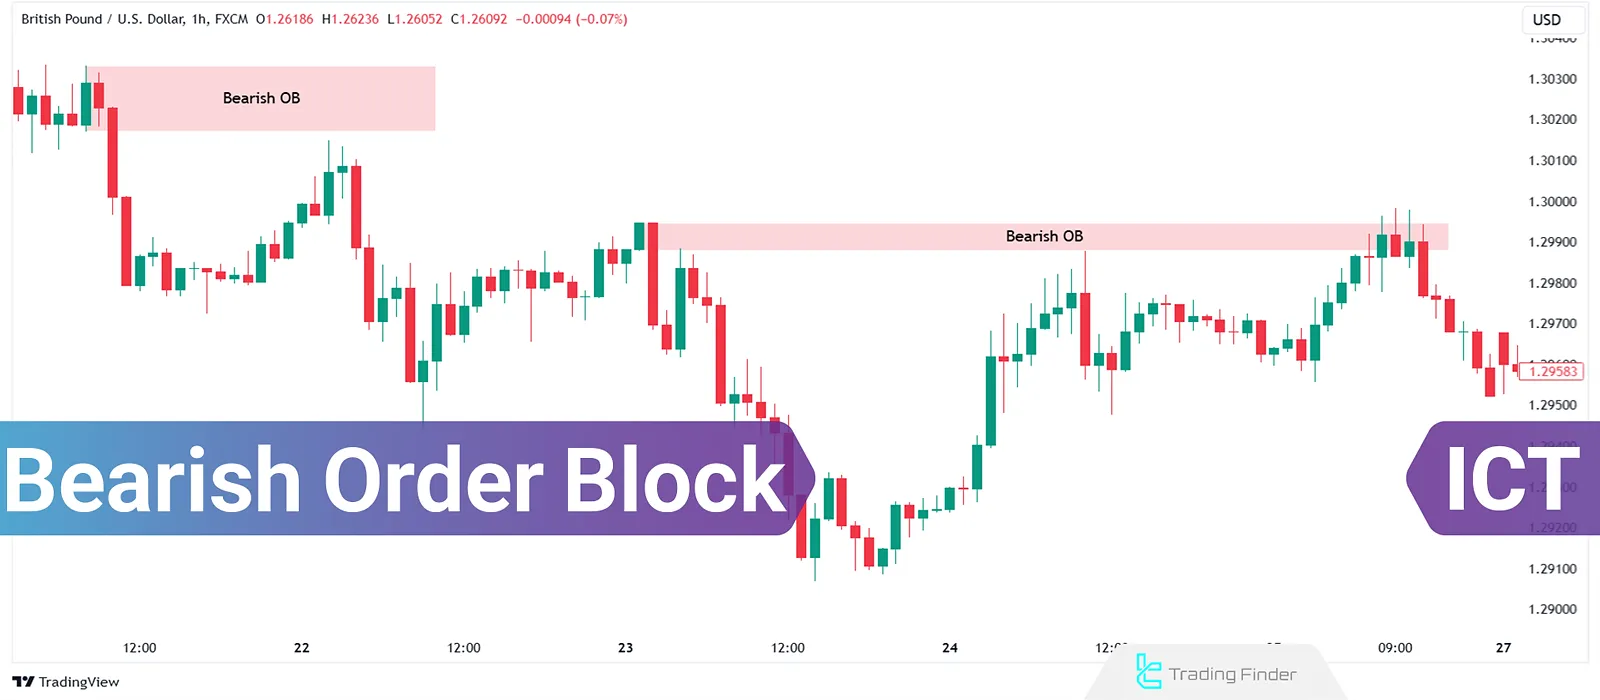
One of the foundational concepts in ICT trading is the Bearish Order Block (OB-), which represents the zones where smart money’s sell orders are concentrated. These areas often mark the starting point of strong bearish moves, offering opportunities to enter trades upon price retracements.
In fact, the bearish order block is the last bullish candle before an effective drop; a point where a high level of liquidity accumulates, and with the entry of heavy smart-money orders, the market structure records a bearish Break of Structure.
This zone usually appears alongside the formation of a price imbalance; an area that indicates the high speed of selling and the absence of resistance on the buy side.
The return of price to this zone, in the form of a pullback to the bearish order block, is considered a low-risk opportunity; because at this level the market completes the pending institutional orders and then continues strongly in the bearish direction.
What is an ICT Bearish Order Block?
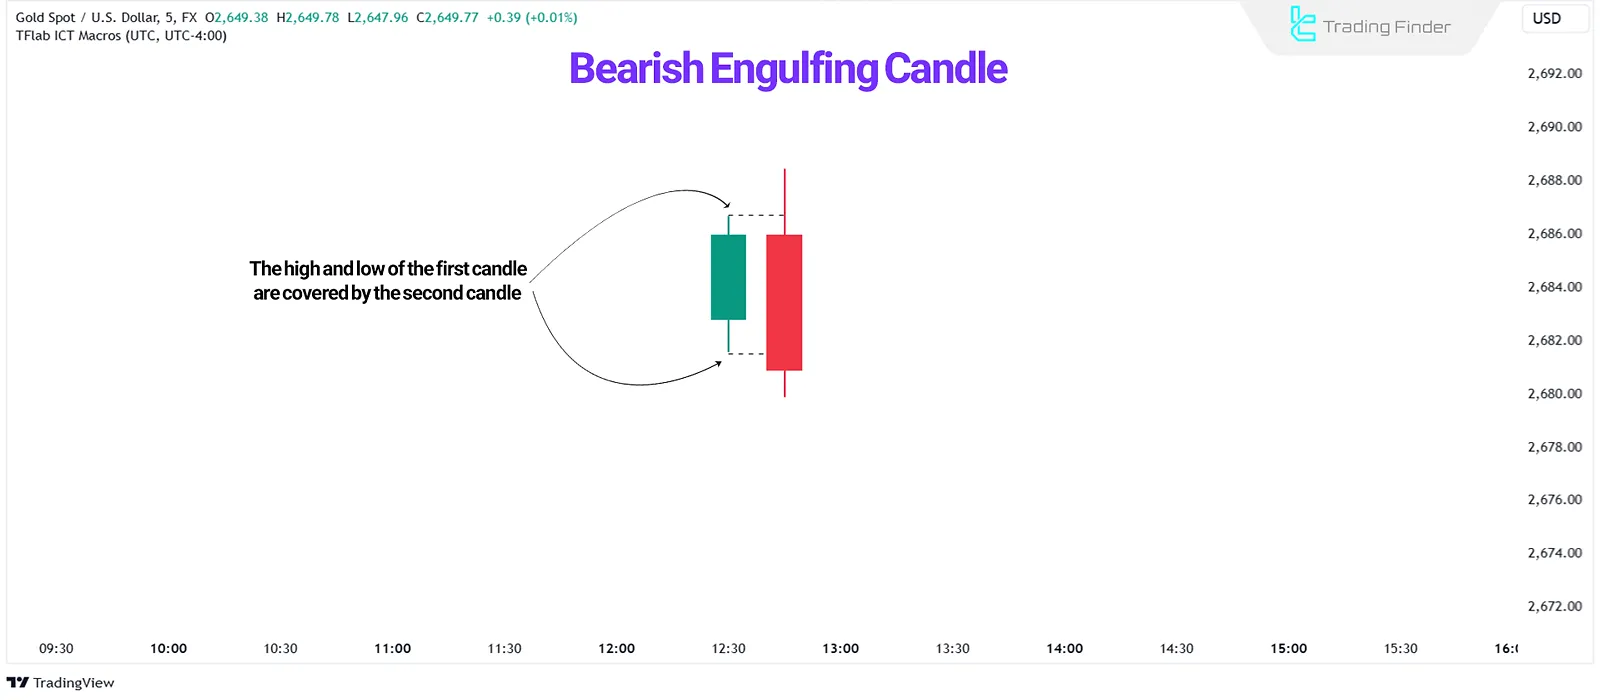
An ICT Bearish Order Block is a price chart zone that exhibits significant selling pressure. It typically comprises a bullish candle followed by a strong, bearish, engulfing candle.
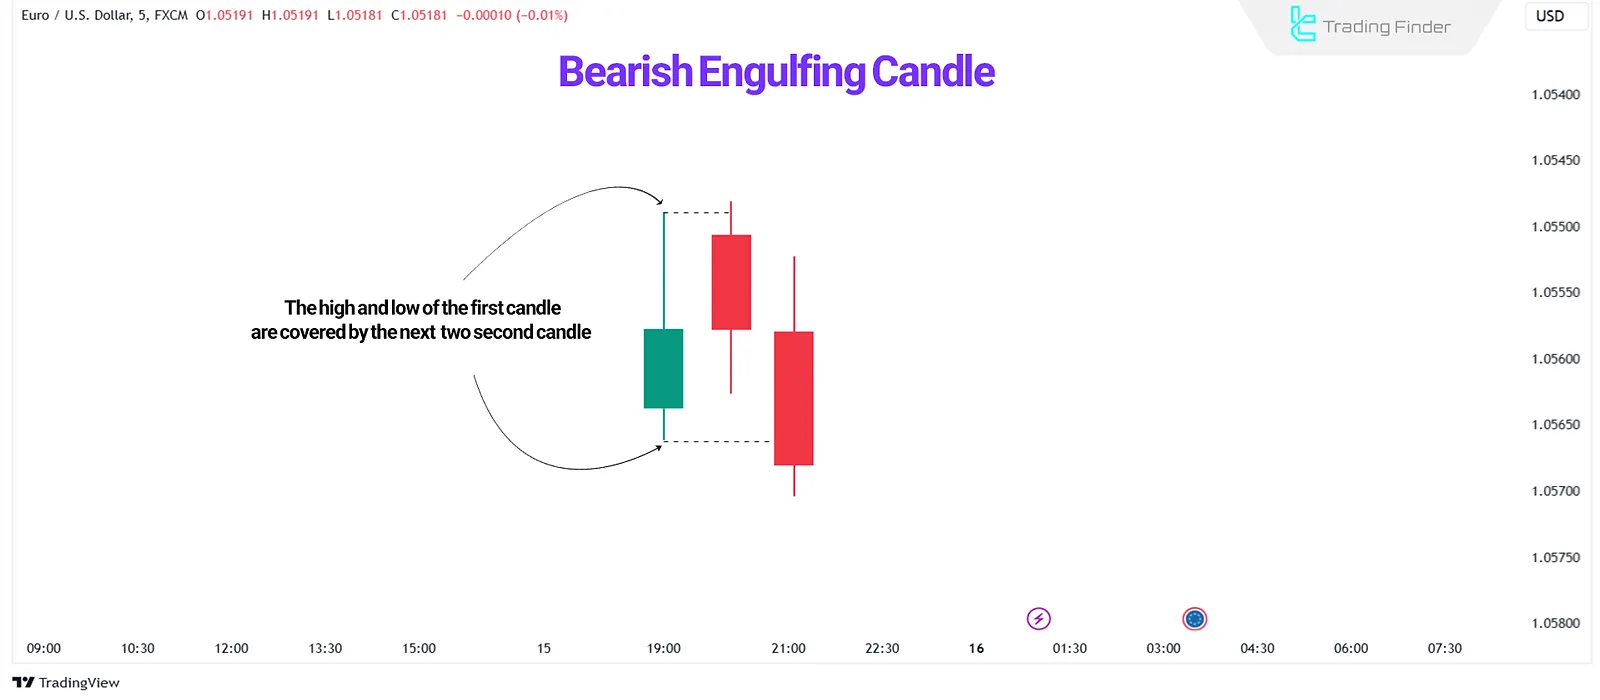
The bearish engulfing pattern can form over two or more candles. In the example below, it is formed over three candles:
How to Identify a Bearish Order Block?
A bearish order block, the last bullish candle before the downward move, is usually formed by two candles [bullish and bearish].
To validate an ICT Bearish Order Block, consider the following:
- The bearish candle must capture the liquidity above the previous bullish candle;
- The bearish candle must close below the low of the previous bullish candle;
- Presence of an Imbalance in the lower timeframe within the OB zone;
- A Market Structure Shift (MSS) in lower timeframes.
Thus, the second candle must engulf the first candle entirely, from body to body and wick to wick.
Top–down analysis of the bearish order block
A fundamental principle in working with the ICT bearish orderblock is a hierarchical analysis from higher timeframes to lower ones.
In this method, the direction of the market structure in higher timeframes is first identified, and then the precise entry point is determined in lower timeframes. The standard steps of multi-timeframe analysis include the following:
Timeframe | Time period | Key objectives | Tasks | Expected output |
Higher timeframe | H4 – Daily | Determine trend and bias | Identify market direction, mark valid OBs and specify EQH/EQL | Main bias + reaction zone |
Mid or intermediate timeframe | 1H – 15M | Examine reaction to the higher-timeframe zone | Monitor price reaction, identify structural weakness (Liquidity Run) and track liquidity break or protection | Preparation for MSS |
Lower timeframe | 5M – 1M | Find precise entry | Confirm MSS, examine FVG or Imbalance and select the entry + combination of OTE and 50% of the order block | Precise entry + optimal stop-loss |
This structure makes entry alignment more coherent and significantly increases the accuracy and win-rate of trades based on the order block.
How to Trade the Bearish OB?
To trade an ICT Bearish OB, follow these steps:
- Identify the market’s Order Flow or dominant trend;
- Note that Bearish OBs are more reliable in bearish trends and may only offer short-term pullbacks in bullish trends. Therefore, it’s recommended that Bearish OBs be traded within a bearish market structure;
- Identify a valid ICT Bearish Order Block;
- Wait for the price to retrace to the Bearish OB;
- When the price approaches the Bearish OB, execute a sell trade at around the 50% retracement level of the OB zone.
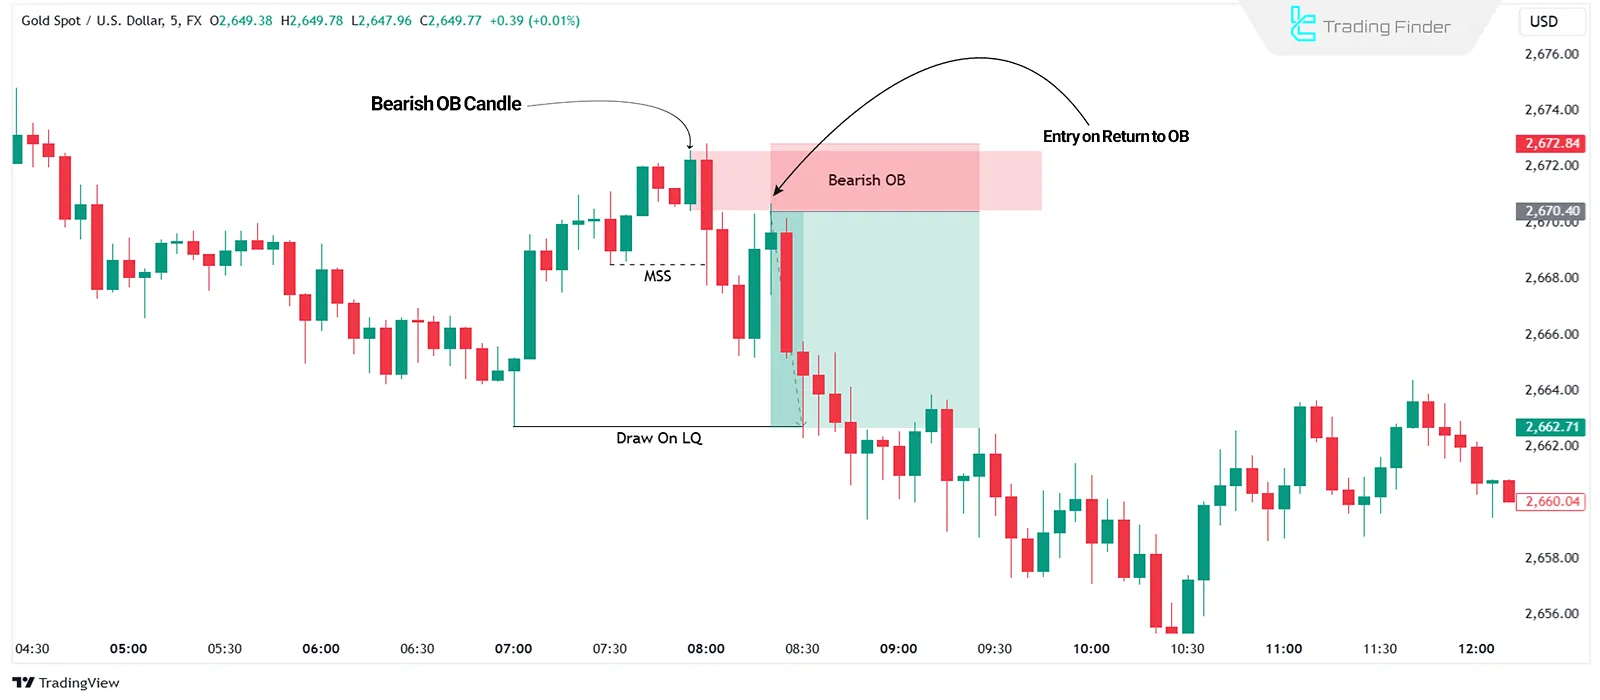
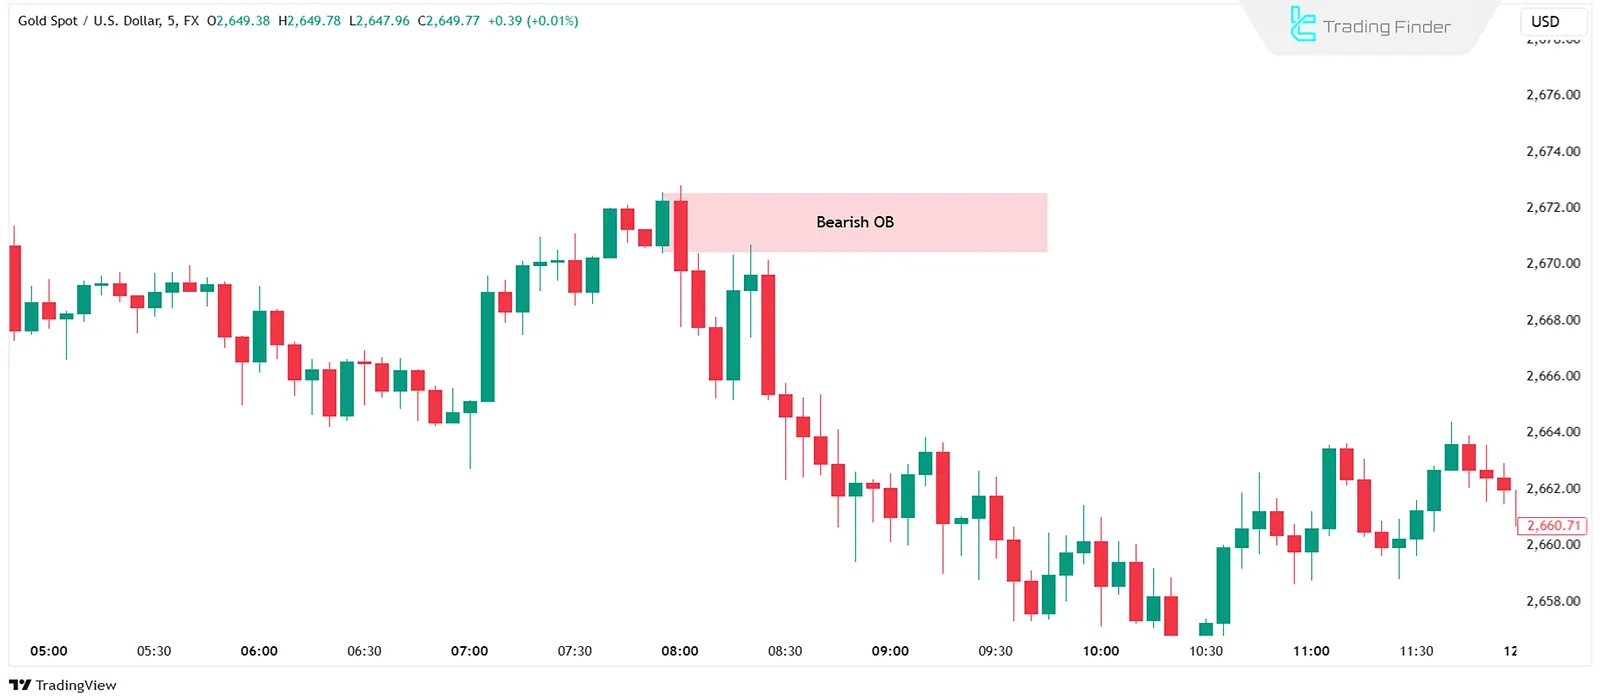
In the example above, the market shifts its structure to bearish, indicating a downward move. After forming a Bearish OB, the price retraces to this OB, allowing for a sell trade upon confirmation in lower timeframes.
Entering a Trade Using OTE in the Bearish Order Block
Choosing the optimal OTE entry point has a key place in ICT structures and adjusts the risk-to-reward ratio with high precision. The return of price to the 62% to 79% Fibonacci range creates a powerful context for entering in line with the smart money liquidity flow.
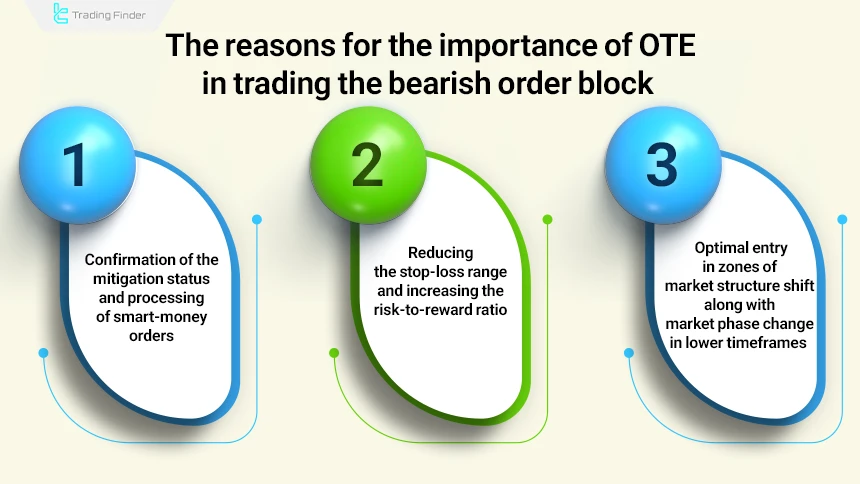
In the logic of the order block, this zone provides precise capacity for risk management due to its alignment with the absorption of large-scale orders. The reasons for the importance of OTE in the bearish order block include the following:
- Confirmation of the mitigation status and processing of smart money orders;
- Reducing the stop-loss range and increasing the R/R ratio;
- Enabling optimal entries in market structure shift (MSS) zones along with phase change of the market in the lower timeframe.
Given the explanations above, the process of executing the standard scenario for entry at OTE levels is as follows:
- Identifying a valid order block;
- Drawing the Fibonacci from the top of the order block to the bottom of the move;
- Waiting for price to return to the OTE zone of the order block;
- Entering after receiving structural confirmation in the lower timeframe via MSS.
Example of entering a trade using OTE in the bearish order block
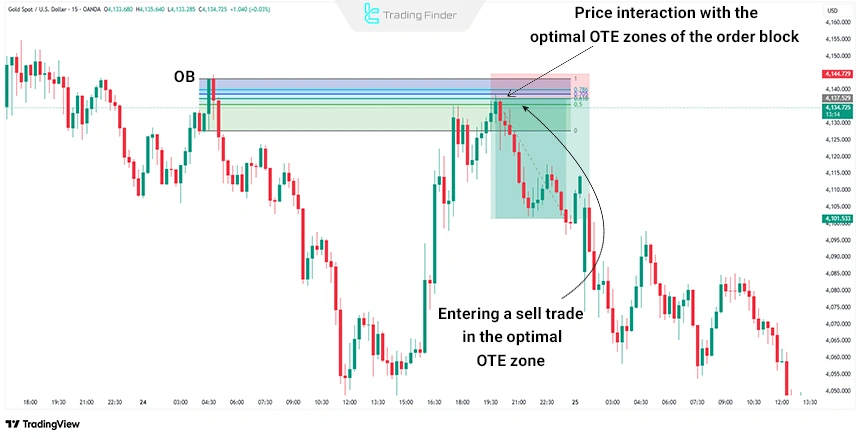
As a sample, the gold price chart in the 15-minute timeframe moves toward a bearish order block, and one can enter a sell trade at the OTE levels with a stop-loss placed slightly above the order block.
It is also possible to enter sell trades with greater confidence by confirming a structure shift in lower timeframes after price interacts with the OTE zones of the order block.
How to Set Stop-loss and Take-Profit in the Bearish Order Block Trade
When executing a trade based on the bearish order block, place the stop-loss a few pips above the order block. To determine the take-profit, you can look for the next major liquidity grab.
Placing the stop-loss slightly above the bearish order block in ICT reduces the likelihood of its activation due to broker spread or sudden price slippage within the order block zone.
The educational video from the Institutional Trading channel on YouTube provides more complete information regarding trading order blocks and the method of placing stops, which interested individuals can refer to.
Reliability of ICT Bearish Order Blocks
Yes, a Bearish OB is more reliable in bearish trends, reflecting the potential continuation of the bearish move. In bullish trends, a Bearish OB can act as a liquidity zone, where prices might breach the OB and move higher.
The bearish order block shows its highest validity when it is in complete alignment with the bearish market structure and appears after the formation of a Break of Structure.
This zone is the last area in which the execution of institutional orders has taken place before the continuation of the drop, and it has strengthened the order flow in the direction of selling.
However, backtest data shows that in bullish trends, these same order blocks mostly play the role of liquidity absorption and the probability of price passing through them is higher.
Therefore, the validity of the order block is directly dependent on the direction of the trend and structural confirmations, and it cannot be considered an independent signal.
Can You Trade Using Only the ICT Bearish OB?
Yes; you can trade using only the ICT bearish order block. It is enough to find a valid order block in the optimal trade entry zone (ICT Optimal Trade Entry) and follow the bearish trend of the market.
In fact, in this approach, the trader, by combining three main elements bearish structure, valid OB, and entry in OTE can execute precise and low-risk trades without using other concepts.
Common Mistakes of Traders in Using the Bearish Order Block
Also, the market structure shift (MSS) provides greater confidence for trade confirmation in the order block zone and usually reduces the error rate of trades.
In the professional order block training article on the eplanetbrokers.com website, complete explanations about bearish order blocks and how to trade with them have been provided, which can be used.
Order Block Indicator (ICT and Smart Money) for MetaTrader and TradingView
The Order Block indicator in the analytical environment of ICT traders and the smart-money approach is known as one of the specialized tools on the MetaTrader platform.
This tool, by focusing on price behavior and the placement of the orders of banks and major financial institutions, identifies zones from which powerful market moves usually originate.
In fact, order blocks are areas where heavy volumes have accumulated, and with price returning to these levels, the probability of a rapid reaction and the creation of new trends is very high.
This indicator, with its proprietary algorithm, displays bullish blocks in green and bearish blocks in brown, so that the trader, without the need for complex analysis, can identify high-risk and high-potential zones on the chart.
- Adding the Order Block indicator in TradingView
- Download ICT and SMC style Order Block indicator for MetaTrader5
- Download ICT and SMC style Order Block indicator for MetaTrader4
ICT traders, scalpers, and day traders who make decisions based on supply and demand can use these visual signals to find intelligent entry and exit opportunities.
For example, in the four-hour chart of a currency pair, the Order Block indicator is able to highlight points that were previously places of large institutional order placement.
A repeated touch of price to these zones usually creates sharp reversal waves. Another example is seen in the 15-minute timeframe of a different currency pair; where levels or a zone have repeatedly caused strong reactions and acted as powerful resistance.
This software also allows the adjustment of parameters such as Candles To Check to define the range of candles under review, and Theme to choose light or dark mode, so that the tool aligns with the trader’s taste and strategy.
In summary, due to its high accuracy in identifying reversal and initiating zones, the Order Block indicator is one of the most essential tools for traders who follow the approach of financial institutions and liquidity flow.
This indicator, by showing levels that have the potential to create explosive moves, is effective for improving analysis quality, increasing the precision of entry points, and achieving efficient risk management.
Conclusion
The ICT Bearish Order Block (OB) is a powerful tool for identifying zones of concentrated sell orders in financial markets. By analyzing bearish trends and monitoring market structure shifts, this tool enhances the precision of entry and exit points.
Accurate identification of an order block requires a deep understanding of Smart Money behavior and detailed analysis of lower timeframes.


