


The ICT Bread and Butter Sell-Setup, when aligned with a bearish Daily Bias, offers opportunities to enter short-term sell trades.
This Trading strategy, known as the Bread-and-Butter setup, focuses on ICT trading concepts such as IPDA and the Judas Swing, delivering 1 to 3 potential scalping entries per day.
In this strategy, the daily bias is first identified, and then analyses and entry opportunities are determined accordingly; therefore, most trades within this setup align with the main trend.
This analytical model is regarded among traders as one of the key components of the bread and butter strategy, focusing on repeating reliable patterns within the liquidity flow.

What Is the Bread and Butter Sell-Setup?
When the Daily Bias is bearish, the price tends to open near or above the previous day's high at the start of the new trading day.
In such cases, there's a strong possibility of a liquidity grab above the previous daily high, triggering the beginning of a bearish move.
The ICT Bread and Butter Sell-Setup identifies short-selling entries within the bearish trend by analyzing liquidity behavior.
The concept of daily bias is fully explained in the article daily bias tutorial on the Writo Finance website:

Advantages and Disadvantages of the ICT Bread and Butter Trading Strategy
TheICT Bread and Butter Sell-Setup provides relatively frequent entry points, but its risk-to-reward often falls below 1.2 ratio.
Pros and Cons of the Bread-and-Butter Trading Setup:
Advantages | Disadvantages |
Good number of signals per day | Lower risk-to-reward ratio |
Covers all 3 trading sessions | Requires a deep understanding of liquidity behavior |
Trades in the direction of Daily Bias | Relies on specific times of day |
Multi-timeframe analysis and structure awareness | Signal quality depends on previous setup success |
Role of IPDA in the ICT Bread and Butter Sell-Setup
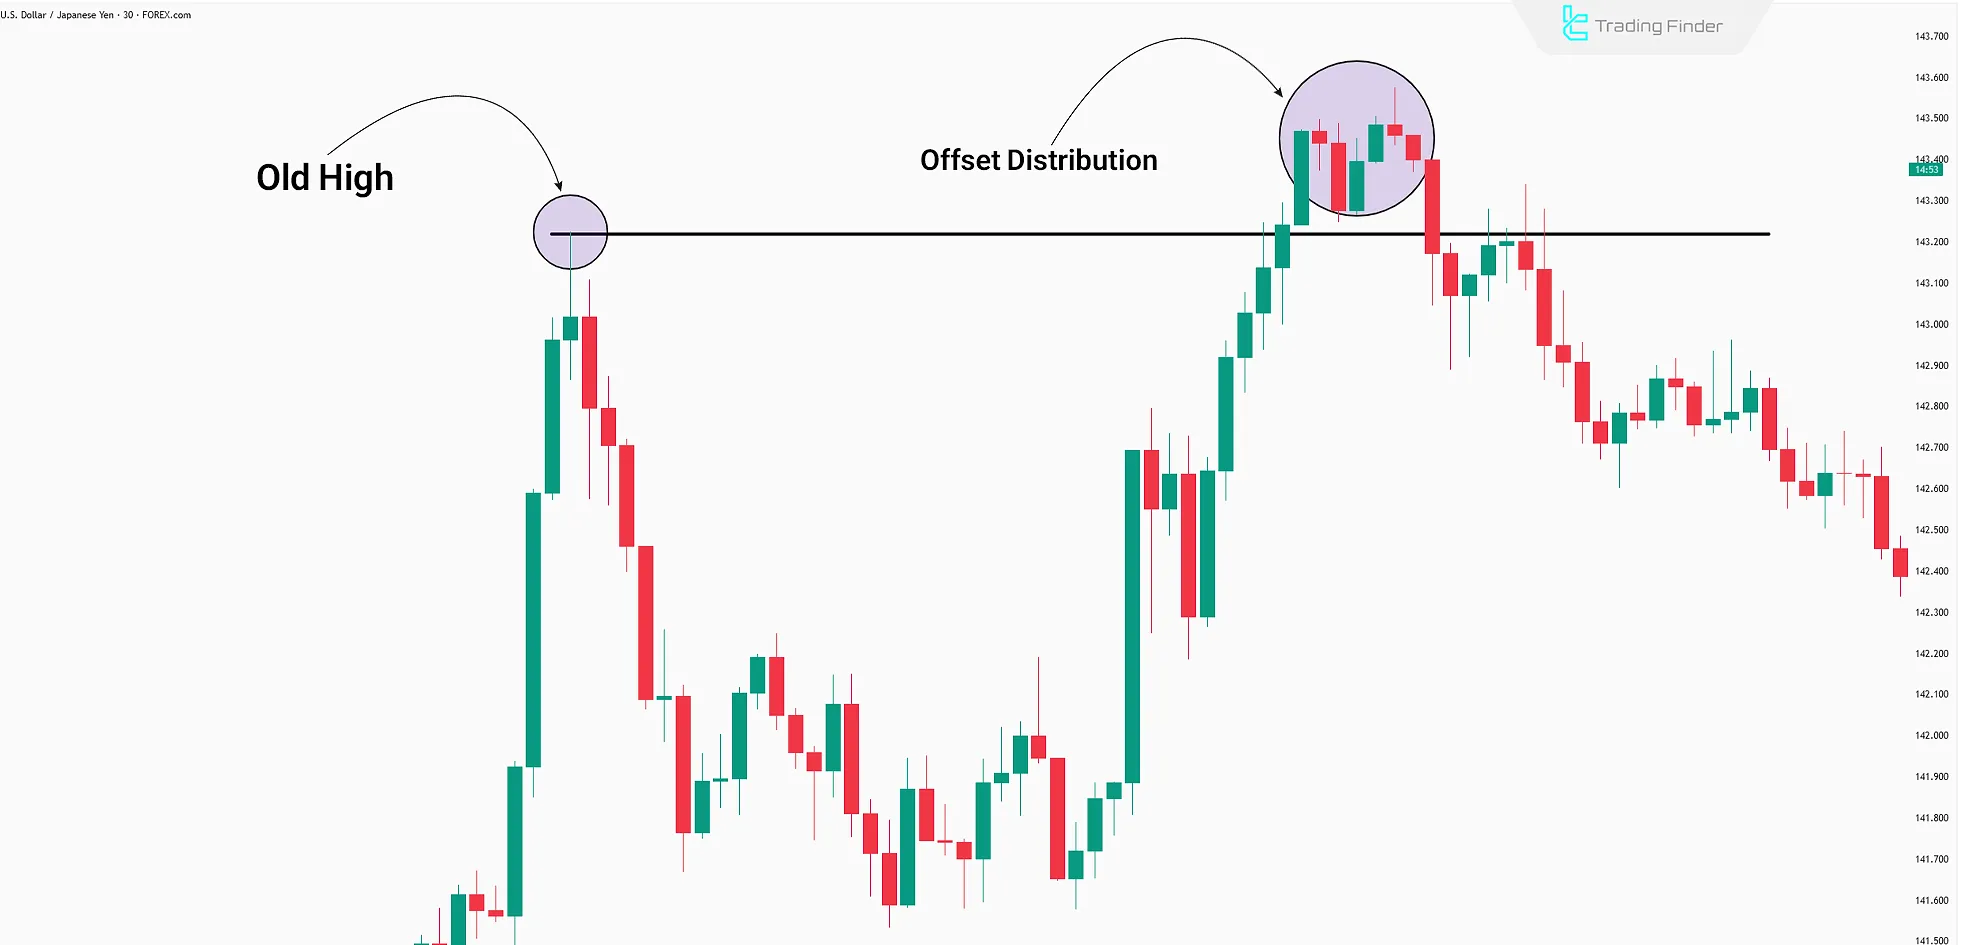
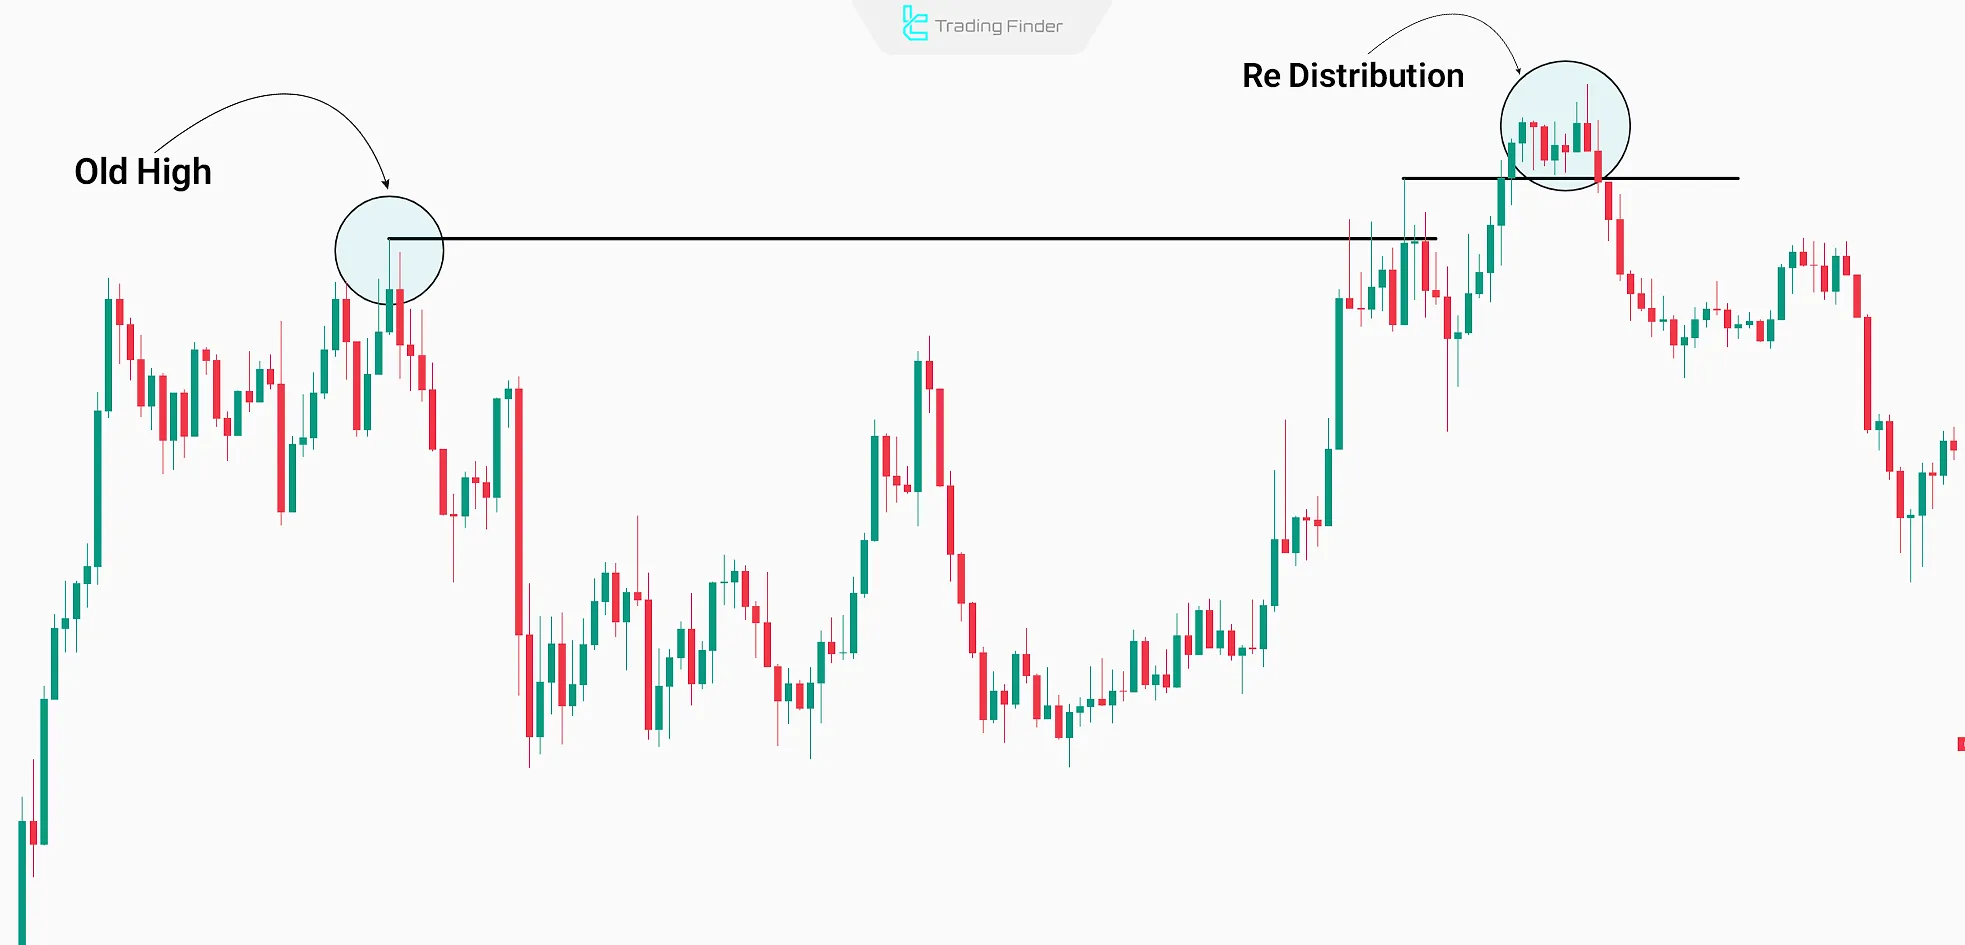
The Interbank Price Delivery Algorithm (IPDA) within this strategy operates based on two models of Offset Distribution and Re-Distribution.
Offset Distribution
In this model, IPDA manipulates prices upward beyond the previous high to halt the selling and gather the liquidity necessary for the primary move.
Re-Distribution
Here, the price moves toward buy-side liquidity, enabling Smart Money to enter premium levels (PD Array).
This temporary bullish move triggers stop-losses of short positions, providing the liquidity for the main bearish leg.
Connection Between the IPDA Model, Daily Bias, and Liquidity Behavior
The IPDA model plays a crucial role in understanding liquidity flow within the Bread and Butter strategy. In this model, the Daily Bias defines the overall market direction, while IPDA determines the optimal entry points on lower timeframes.
This combination forms the foundation of the ict bread and butter setup, widely utilized by professional analysts of the ICT methodology.
When liquidity flow aligns with the Daily Bias, the probability of a successful trade increases significantly. In such cases, the higher timeframe PD Array defines the liquidity direction, while the lower timeframe PD Array determines the precise entry timing.
Determining the Daily Volatility Range Using the 5-Day ATR
One of the essential tools in this setup is examining the average daily volatility (ATR) over the past five days. By applying an ATR indicator with a period of 5, traders can estimate the approximate daily price movement range.
When price approaches the ATR level, the likelihood of a pullback or reversal increases. It is advisable to secure partial profits or avoid opening new positions when the price is within approximately 15 pips of the ATR level.
The ATR indicator is introduced in a video on the ForexSignals TV YouTube channel:
Identifying Kill Zone Time Ranges in Each Session
In the Bread and Butter setup, timing is one of the key factors of success. Each trading session has a specific time range where the probability of Judas Swing formation and liquidity grabs is higher.
- London Session: 2:00 AM to 8:20 AM New York time
- New York Session: 8:20 AM to 10:00 AM New York time
- Asia Session: 7:00 PM to 2:00 AM New York time
Typically, the main market move occurs within these periods, while outside them the market tends to remain in limited-range fluctuations.
Entry Signals in the ICT Bread and Butter Sell-Setup
This strategy issues scalping signals during the New York, Asian, and London sessions.
London Session Entry
With a bearish bias, the day’s high typically forms during the London session. At the 00:00 GMT open, a bullish move usually precedes the main bearish leg.
This upward move ends in a bullish Judas Swing, triggering the first sell entry for the London session.
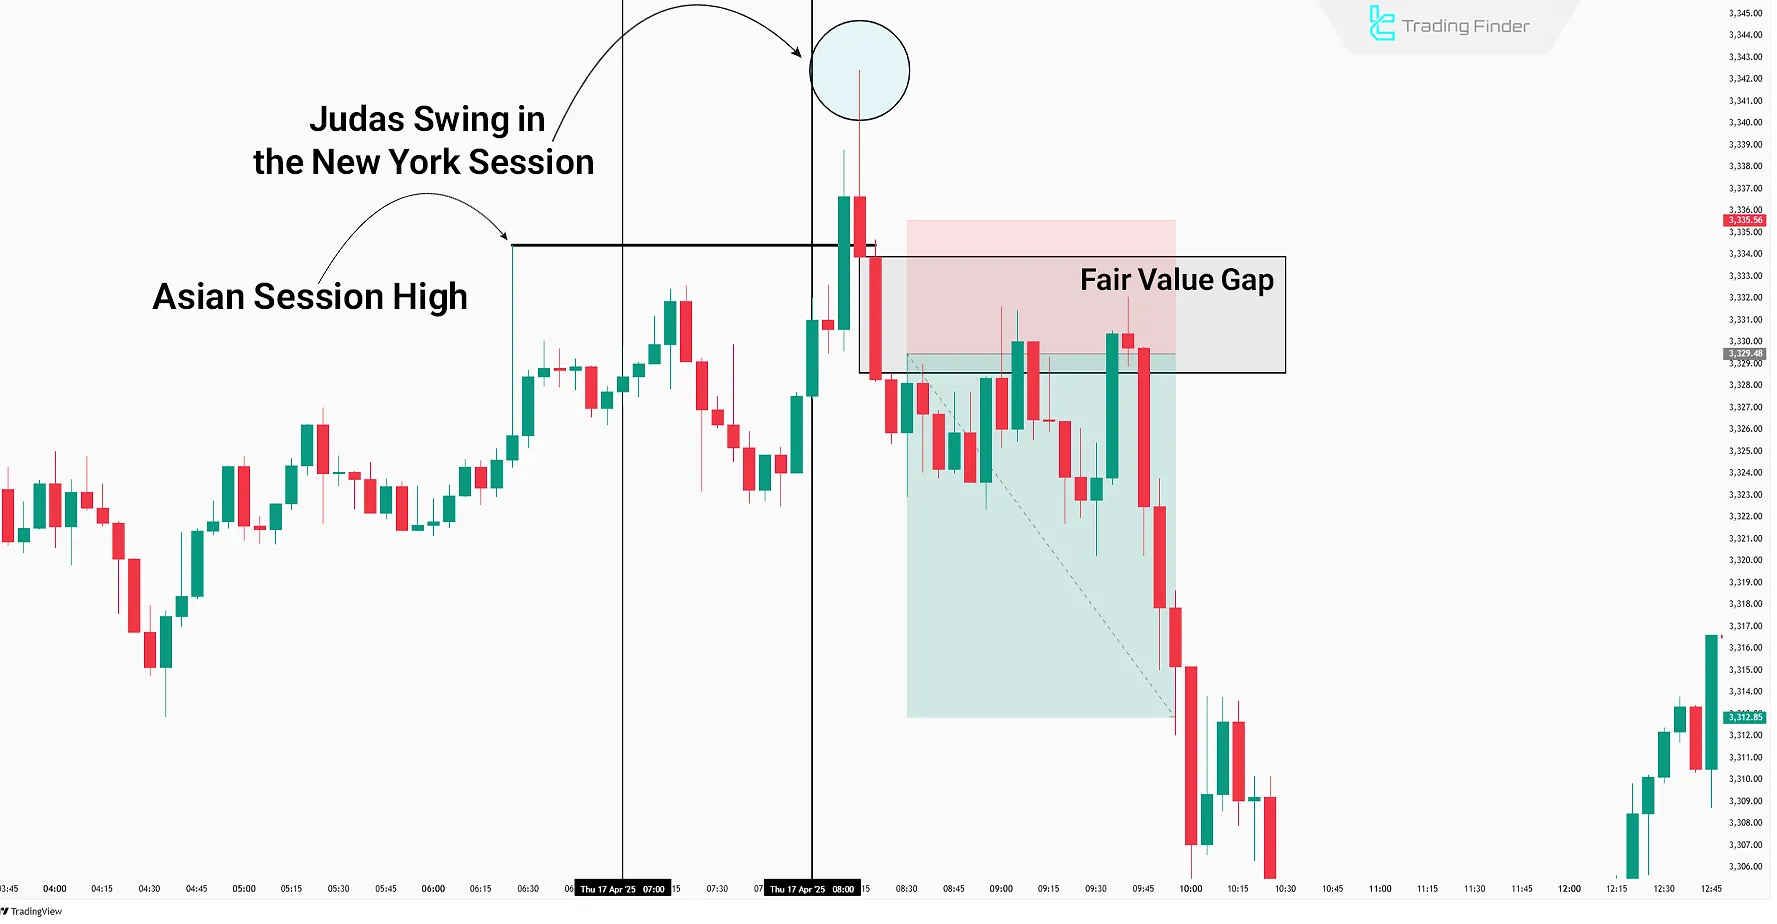
New York Session Entry
If the daily high is confirmed in theLondon session, the New York session typically continues the bearish move.
At the CME open (8:30 AM NY time), a Judas Swing forms during the NY Kill Zone, offering another sell entry.
The take-profit target is usually the Discount Array on higher timeframes (H1, H4, or Daily).
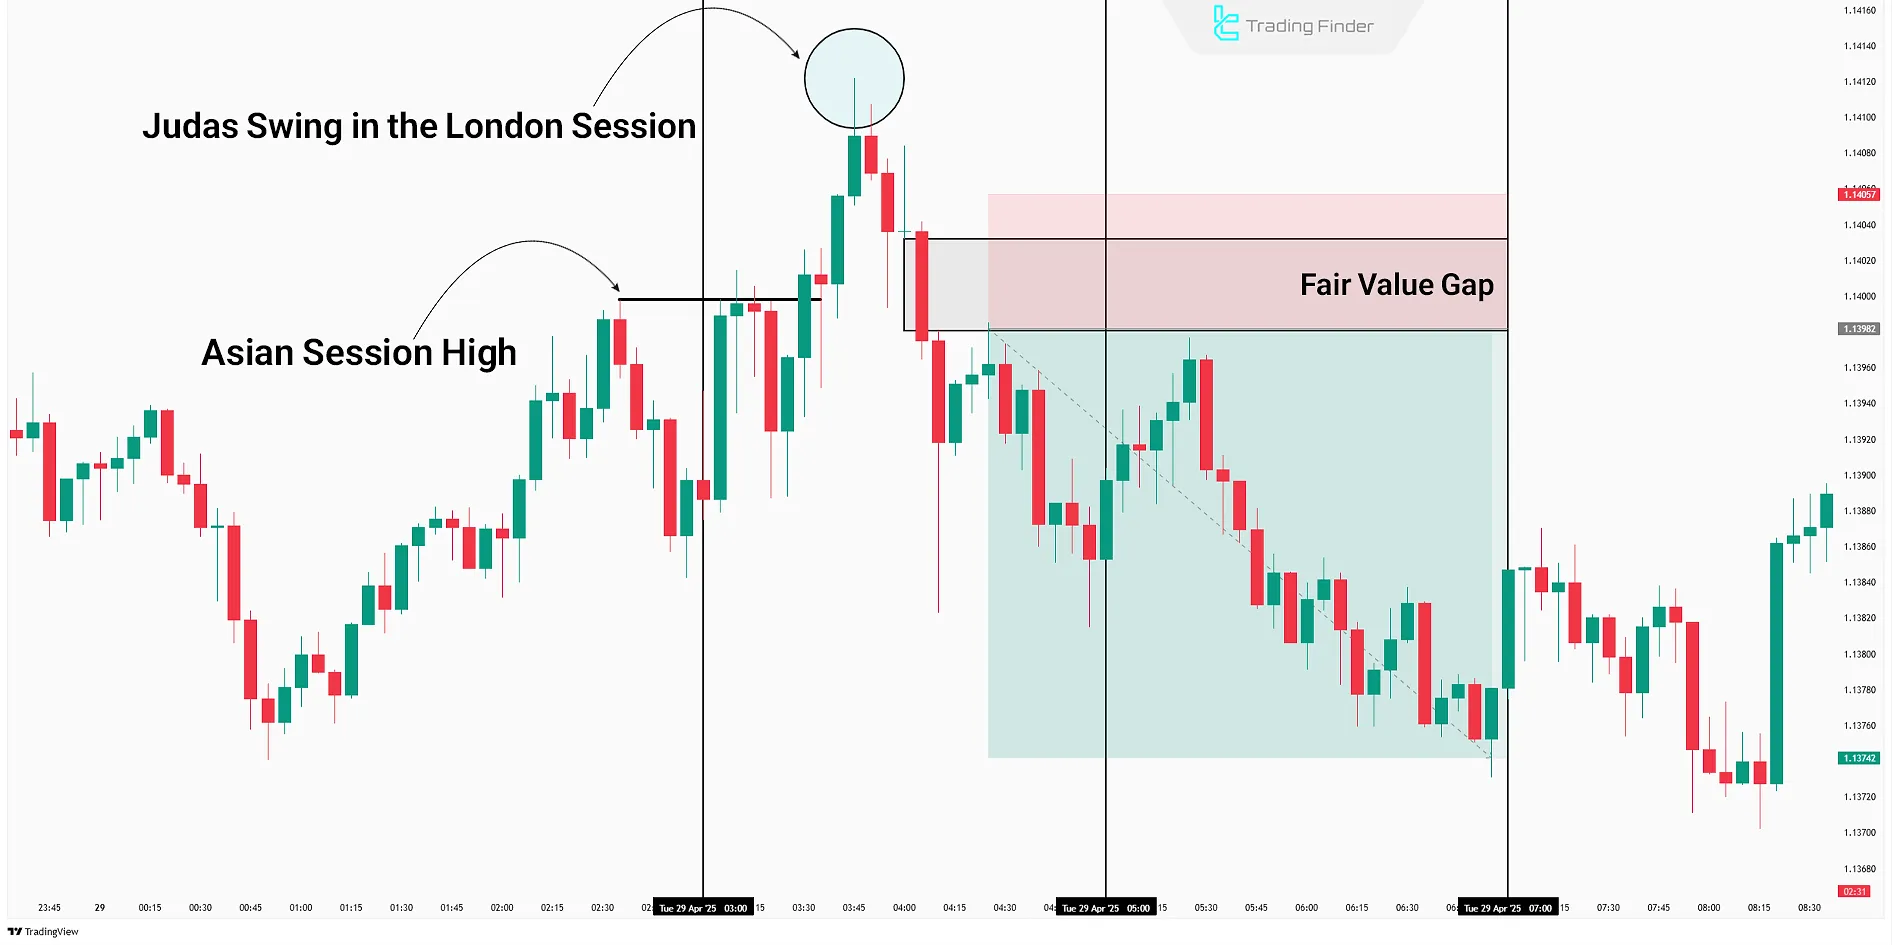
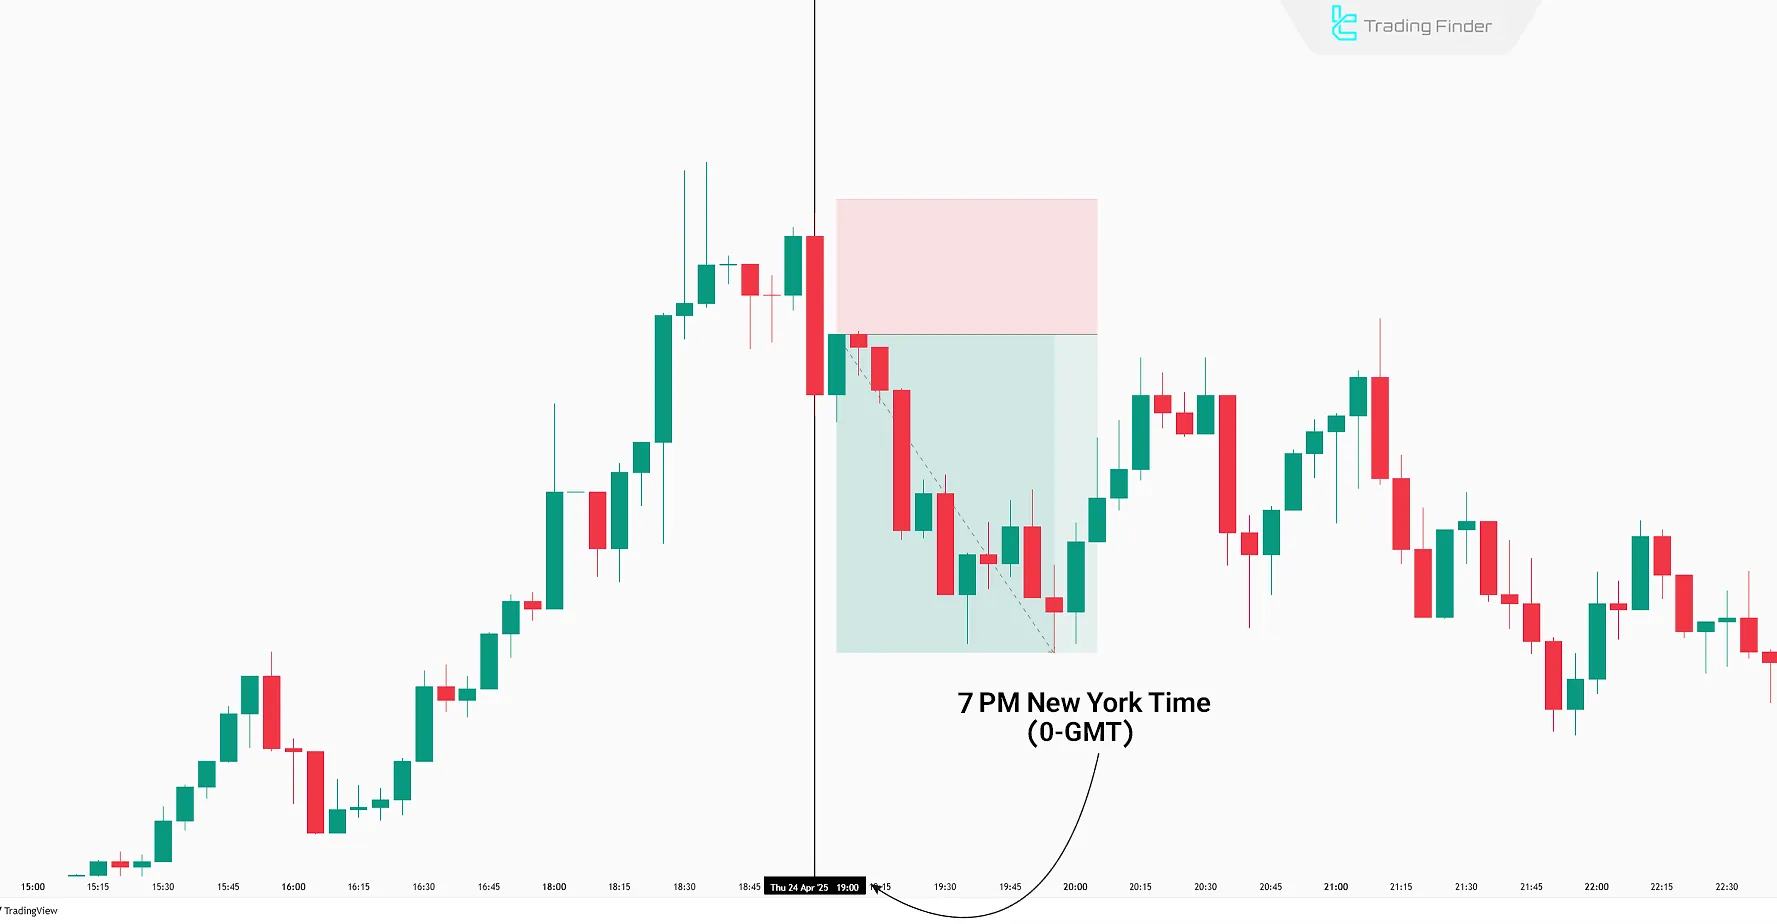
Practical Example of the Bearish Bread and Butter Setup in the New York Session
In this example, after forming a high during the Asian session, the market enters a temporary bullish phase in the New York session.
The initial upward movement represents the New York session’s Judas Swing, which sweeps the previous session’s high and captures buy-side liquidity.
After the liquidity grab, the price stalls in the premium zone, where a Fair Value Gap (FVG) forms within the same area. This FVG marks the zone used by smart money to enter sell trades.
Entry within the FVG, confirmed by a bearish candle structure on the following candle, serves as the main entry point of this setup.
The subsequent downward move continues in alignment with the daily bias and, with a limited 10-pip risk, provides at least three times the potential reward. This method represents a classic sell setup in ICT-style trading.
Asian Session Entry
If the bearish bias is confirmed during the London and New York sessions, entering a short position around 7 PM NY time (0 GMT) before the Asian Session opens becomes a viable option.
Due to lower volume and slower price movement in Asia compared to London and NY, the target is limited to 15–20 pips.
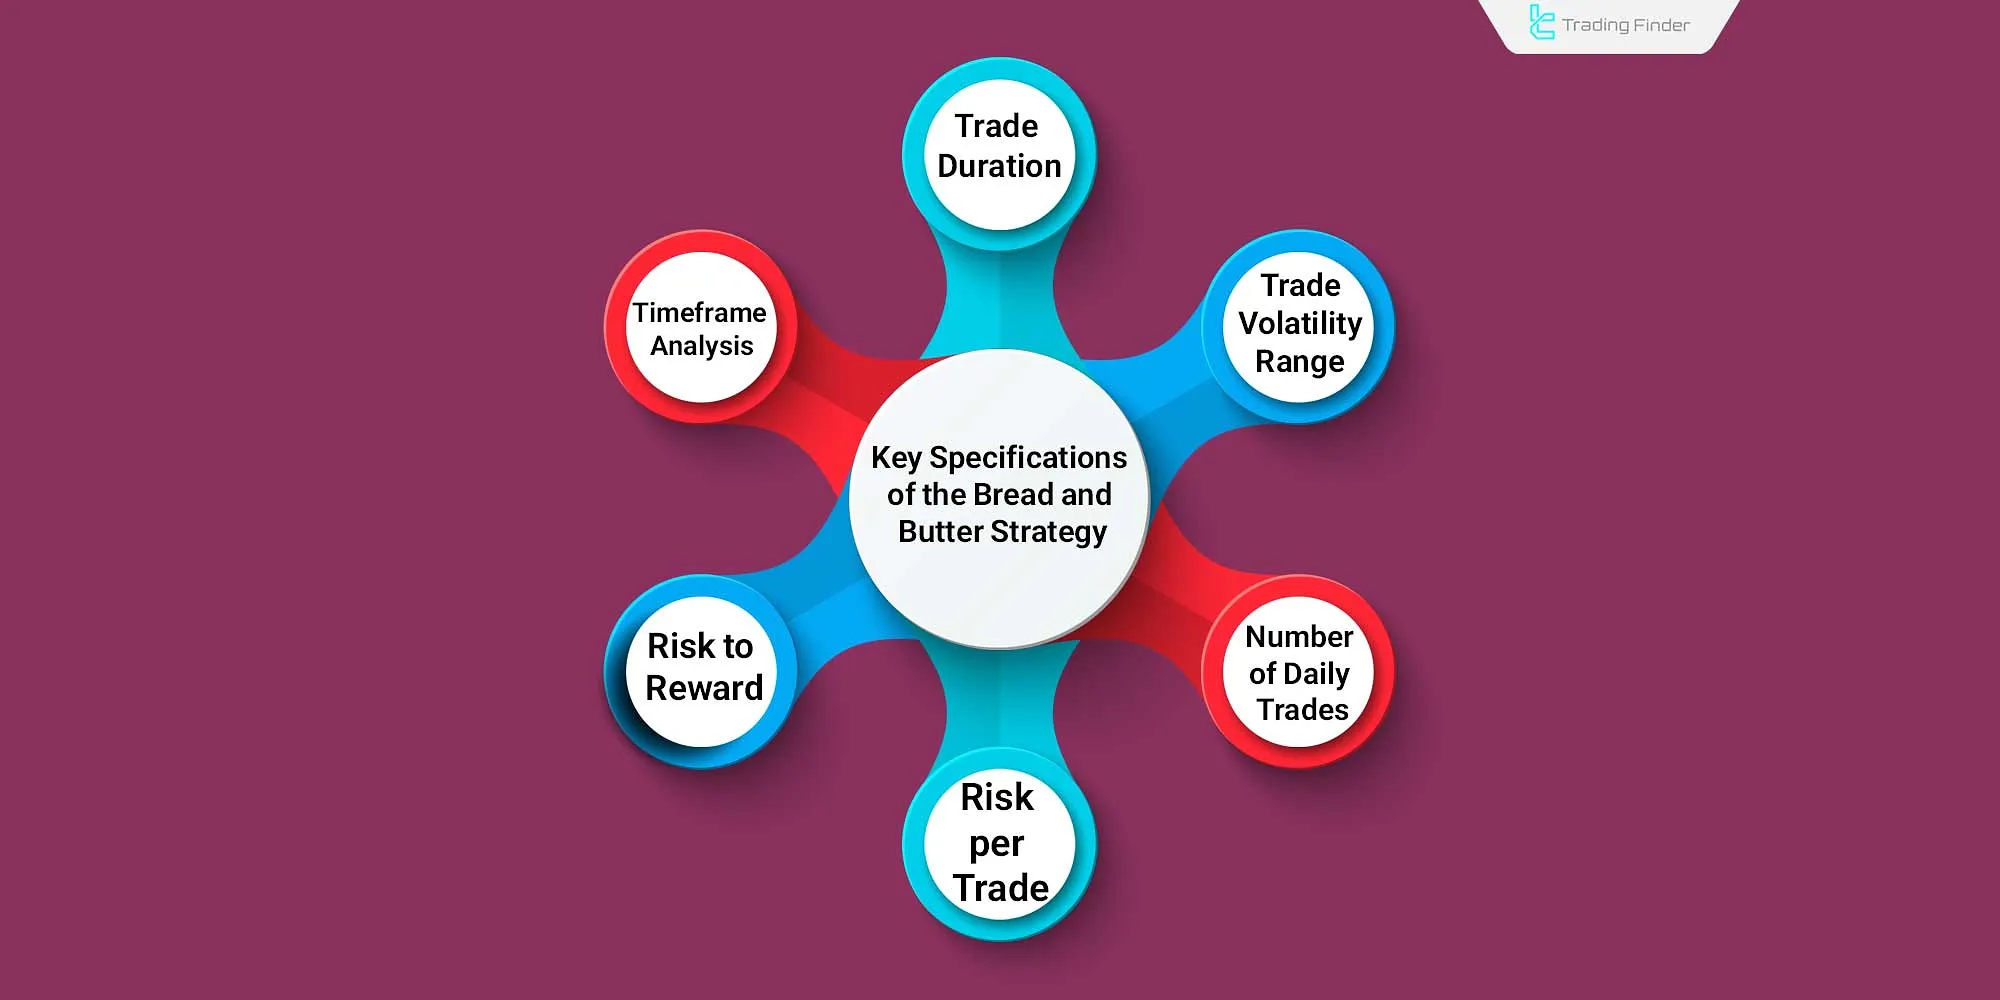
Key Features of the ICT Bread and Butter Sell-Setup
The ICT Bread and Butter Sell-Setup offers multiple short entries daily, making it ideal for scalping. Key characteristics:
- Trade Duration: 1 to 2 hours
- Trade Range: 30 to 50 pips per trade
- Analysis Timeframe: 5-minute chart (M5)
- Trades per Day: 1 to 3 setups
- Risk-to-Reward Ratio: varies with price zones
- Recommended Risk: 0.5% to 1% per trade
Risk Management and Risk-to-Reward Ratio in the Bread and Butter Strategy
In the Bread and Butter strategy, risk management plays a crucial role in maintaining consistent performance. The stop loss is typically set 10 pips above the session high (in sell trades).
The take profit level is determined based on the higher timeframe liquidity range or the discount zone. The risk-to-reward ratio is generally around 1:1, but in cases where price redistribution occurs, it can increase to as high as 1:1.5.
Following this simple yet structured framework allows traders to operate more consistently throughout the week and maintain steady performance in line with the bread and butter trading strategy principles.
Key Parameters of the Bearish Bread and Butter Setup Across Different Sessions
In this section, a table can be used to compare the setup structure in the three main sessions (London, New York, Asia).
The suggested table is as follows:
Trading Session | Active Time | Main Entry Type | Target Range (Pips) | Suggested Stop Loss | Key Note |
London | 2:00 AM – 8:20 AM New York | Bullish Judas Swing in Premium | 30–50 pips | 10 pips above the high | The daily high is typically formed in this session |
New York | 8:20 AM – 10:00 AM New York | Reversal Judas Swing in New Premium | 20–40 pips | 10 pips above the London high | Continuation of the bearish move with Daily Bias confirmation |
Asia | 7:00 PM – 2:00 AM New York | Entry near 0-GMT | 15–20 pips | 8–10 pips | Limited yet sharp fluctuations for scalping |
Bread and Butter Strategy as an Inter-Session Scalping Model
One of the key features of this strategy is its usability during inter-session periods. When the main move in the London session ends and the New York session has not yet started, traders can utilize retracement moves within premium or discount areas.
During this time, trading volume is lower and volatility is more limited, but due to clearer liquidity structures, it becomes possible to secure quicker profits with lower risk.
This part of the strategy represents what is known in classic ICT models as the foundational trading structure or bread butter strategy, which many traders use to gain a practical understanding of market behavior.
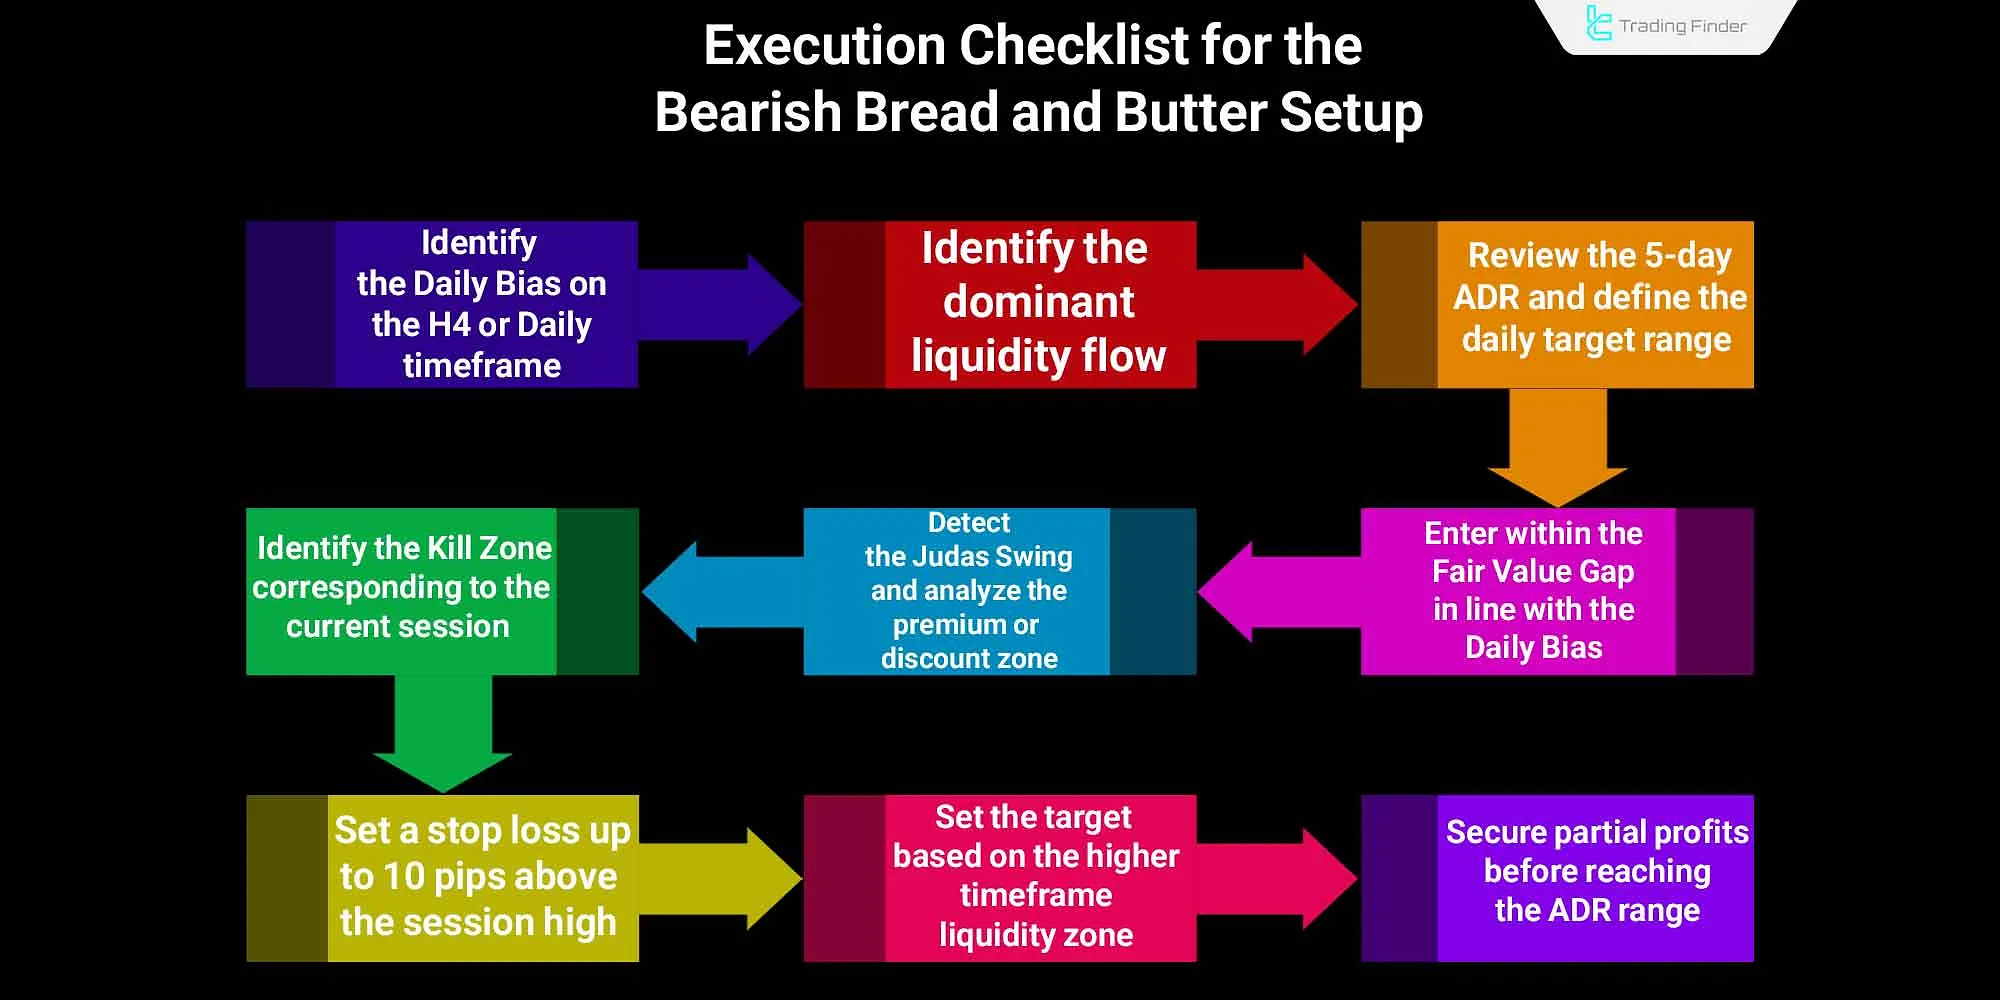
Execution Checklist for the Bearish Bread and Butter Setup
To execute this strategy precisely and systematically, it is recommended to follow these steps before entering a trade:
- Determine the Daily Bias on the H4 or Daily timeframe;
- Identify the dominant liquidity flow (buy-side or sell-side);
- Review the 5-day ADR and define the daily target range;
- Identify the relevant Kill Zone for the current session;
- Detect the Judas Swing and analyze the premium or discount area;
- Enter within the Fair Value Gap (FVG) in line with the Daily Bias;
- Set a stop loss up to 10 pips above the session high;
- Set the target based on the higher timeframe liquidity zone;
- Secure partial profits before reaching the ADR range.
Introducing the Session Box Indicator
The Session Box Indicator is one of the most practical analytical tools for professional traders, designed to display the time structure and volatility of each trading session.
It visually marks the time ranges of major markets such as Asia, London, and New York with colored boxes on the chart, helping traders analyze price behavior more accurately within each time window.
In financial markets, volatility and trading volume throughout the day are highly dependent on the activity hours of central banks and global exchanges.
Therefore, knowing the start and end times of trading sessions is vital when designing short-term or scalping strategies.
The Session Box Indicator highlights the highs and lows of each session, providing a clear view of daily liquidity zones and indicating where price reversals or breakouts are more likely to occur.
This feature is precisely what is applied in the bread and butter strategy structure, as traders can combine session timing with liquidity flow to identify optimal entry points.
In charts of currency pairs such as EUR/USD or GBP/JPY, the most significant volatility usually occurs during the overlap of the London and New York sessions.
This indicator allows traders to compare the price movement strength within each session and analyze liquidity behavior.
Moreover, traders can integrate its data with ICT concepts such as Fair Value Gap, Order Block, and Judas Swing to fine-tune their entry and exit levels based on the market’s time structure.
Another capability of this tool is a time panel that shows whether sessions are open or closed and displays the remaining time until each session ends. This allows traders to make instant decisions on whether to enter a trade or wait for a session shift.
Ultimately, the Session Box Indicator, thanks to its accuracy in displaying time zones and liquidity ranges, is one of the most essential tools for ICT-style analysts and scalpers seeking a precise understanding of price behavior within market time cycles.
It helps traders gain a deeper comprehension of entry and exit conditions and make trading decisions with greater confidence something that also proves useful during learning and practice phases, even in topics related to how to sell ict.
Conclusion
The ICT Bread and Butter Sell-Setup, by evaluating the Daily Bias, provides one scalping entry per session in London, New York, and Asia. With multiple daily entries and a 30–50 pip target per trade, it's a robust strategy for short-term trades.
This setup utilizes ICT concepts, including IPDA, Judas Swing, and Liquidity Grab, for trade execution.


