


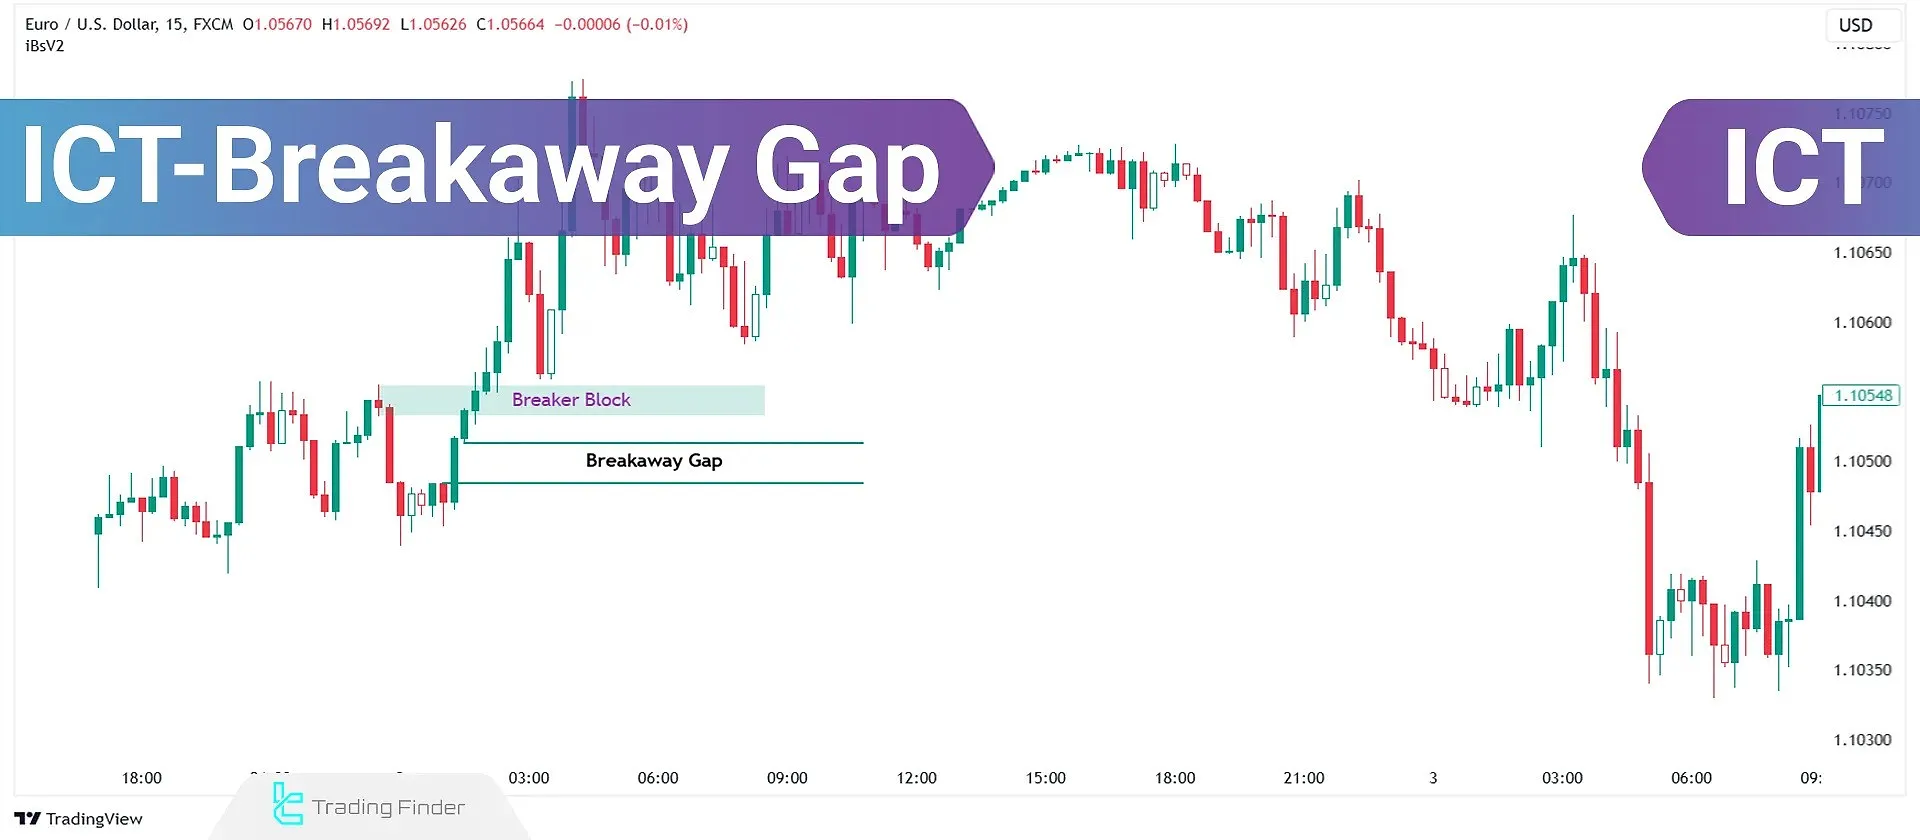
An ICT Breakaway Gap is a fair value gap (FVG) that remains unmitigated following a strong price movement. This gap is unique because it forms when the price separates from a significant high or low and continues decisively without returning to fill the gap.
The ICT Breakaway Gap is one of the most powerful yet lesser-known concepts in the ICT trading style. This advanced Trading strategy goes beyond traditional fair value gap (FVG) trading and systematically identifies low-risk trading setups.
A breakaway gap indicates a rapid shift in liquidity and the dominance of one side of the market, as the sudden move through resting orders creates a new balance in the supply–demand structure and opens up a new area of price movement.
The persistence of this gap as a price inefficiency causes the market to use it later in the trend to assess the strength of the move and determine the sustainability of the direction. ICT-style traders analyze these zones alongside concepts such as BOS, FVG, and order blocks.
Key Components of Breakaway Gaps
Three critical components contribute to the formation of a breakaway gap. These three components typically include the origin zone of the strong move, the price imbalance area (FVG), and the point of break-of-structure confirmation, which together define the validity of the gap.
The stronger the alignment of these factors with the trend direction and liquidity positioning, the higher the probability that the move will continue after the gap is filled. Below, the key components of breakaway gaps are examined:
Breaker Block
Acts as the primary barrier preventing price reversal. A breaker block forms when the price breaks a significant high and moves upward.
On its return, the first obstacle it encounters is the breaker block, which stops further downward movement.
Inverse Fair Value Gap
Provides secondary confirmation of the price movement and gap formation. When the price moves upward and breaks a bearish fair value gap, it turns into a bullish inverse fair value gap.
Balanced Price Range (BPR)
Creates an overlapping area that helps maintain price direction. The overlap between a bearish and bullish FVG creates the BPR, which prevents further downward movement and leaves the BISI as a breakaway gap.
In practice, when price enters the BPR, it is usually accompanied by reduced volatility and the formation of consolidating candles, indicating a relative balance between supply and demand.
This area often acts as a launchpad for continuation in the direction of the dominant trend and can represent one of the most precise low-risk entry zones within the Smart Money approach.
What is The Difference Between Breakaway Gaps & Regular Fair Value Gaps?
What distinguishes Breakaway Gaps from regular FVGs is their behavior post-formation. While FVGs typically get filled, Breakaway Gaps indicate exceptional movement that prevents immediate price return.
The significance of a Breakaway Gap lies in its ability to confirm price direction and momentum strength. When identified with high volume, it will signal stronger conviction in the breakout's direction.
The article on ICT-style breakaway gaps training on the writofinance.com website provides more detailed explanations about this type of gap, and interested readers can also make use of this article.
Types of ICT Breakaway Gaps
Correct identification of the gap type and its alignment with market structure and liquidity plays an important role in the validity of the analysis and the selection of an appropriate trading scenario.
The breakaway gap is divided into two main types bullish and bearish:
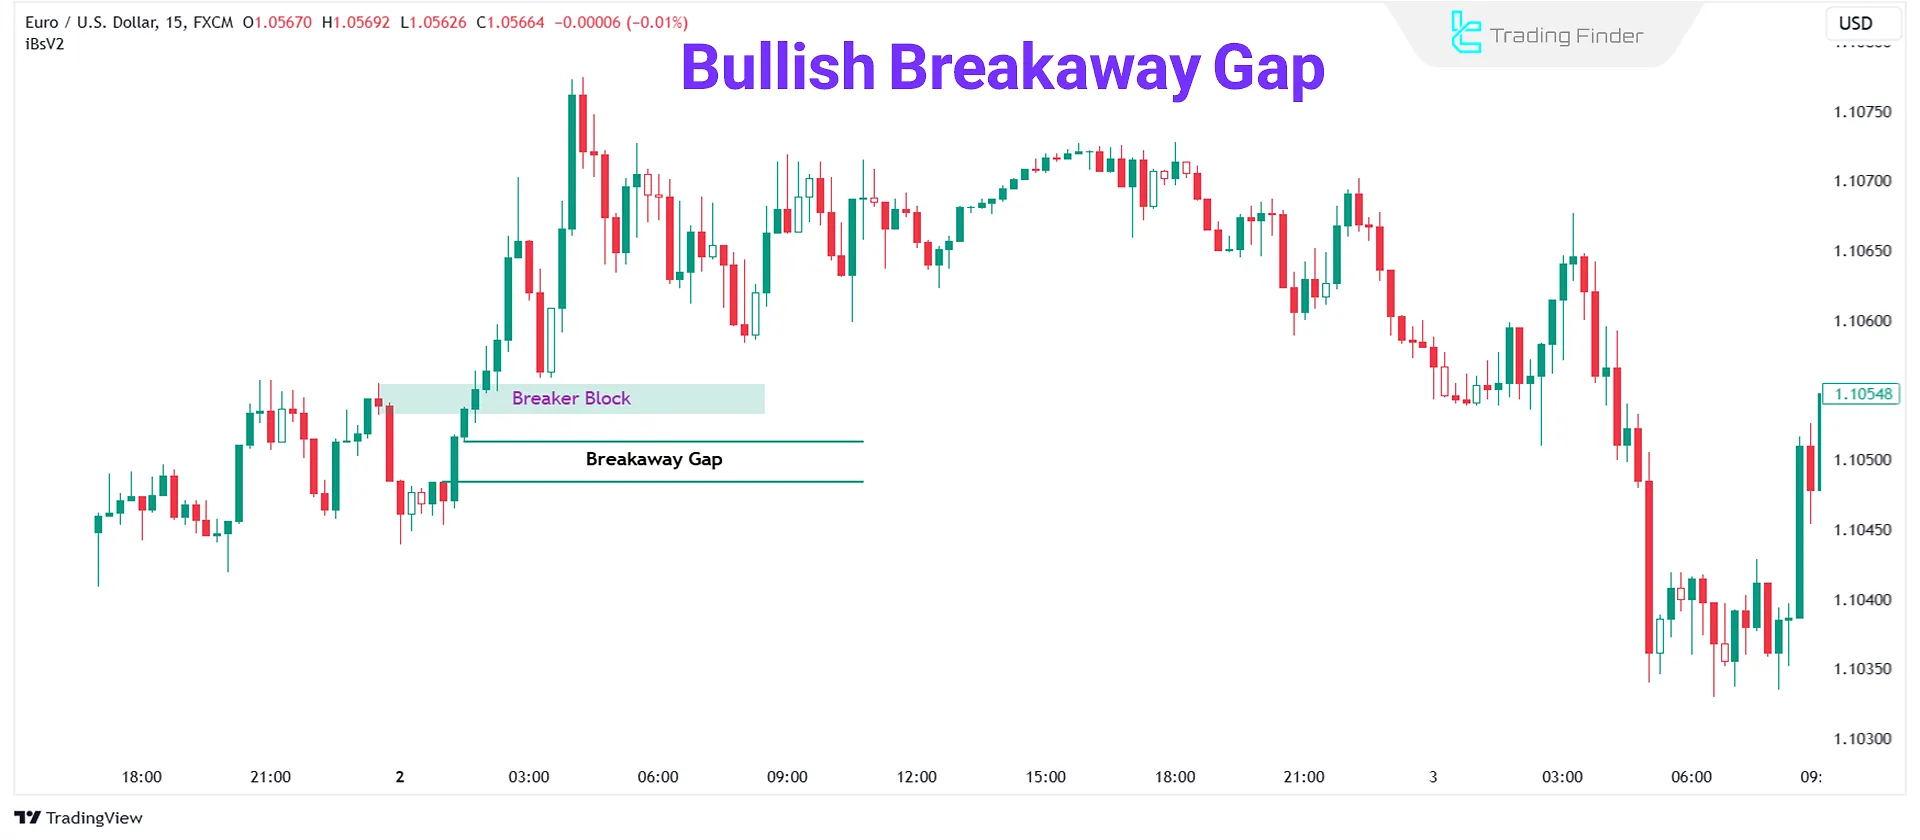
Bullish Breakaway Gap
A Bullish Breakaway Gap, or BISI, forms near a significant high after breaking it with a strong upward move.
This gap usually forms when the market, after multiple failed attempts to break resistance, suddenly breaks through it due to a strong force such as demand from positive fundamental news, heavy order flow, or a change in market sentiment.
Example of a Bullish Breakaway Gap
In the EUR/USD pair, price had been consolidating below a key resistance for some time. After the release of positive news, a 15-minute candle breaks above the resistance with a clear gap, forming a gap between the prior candle’s close and the new opening price.
This 15-minute candle has a strong body, and its trading volume is significantly higher than usual.
This situation indicates a bullish breakaway gap (BISI) and signifies a valid resistance breakout with a strong, one-sided move at the very start of the market.
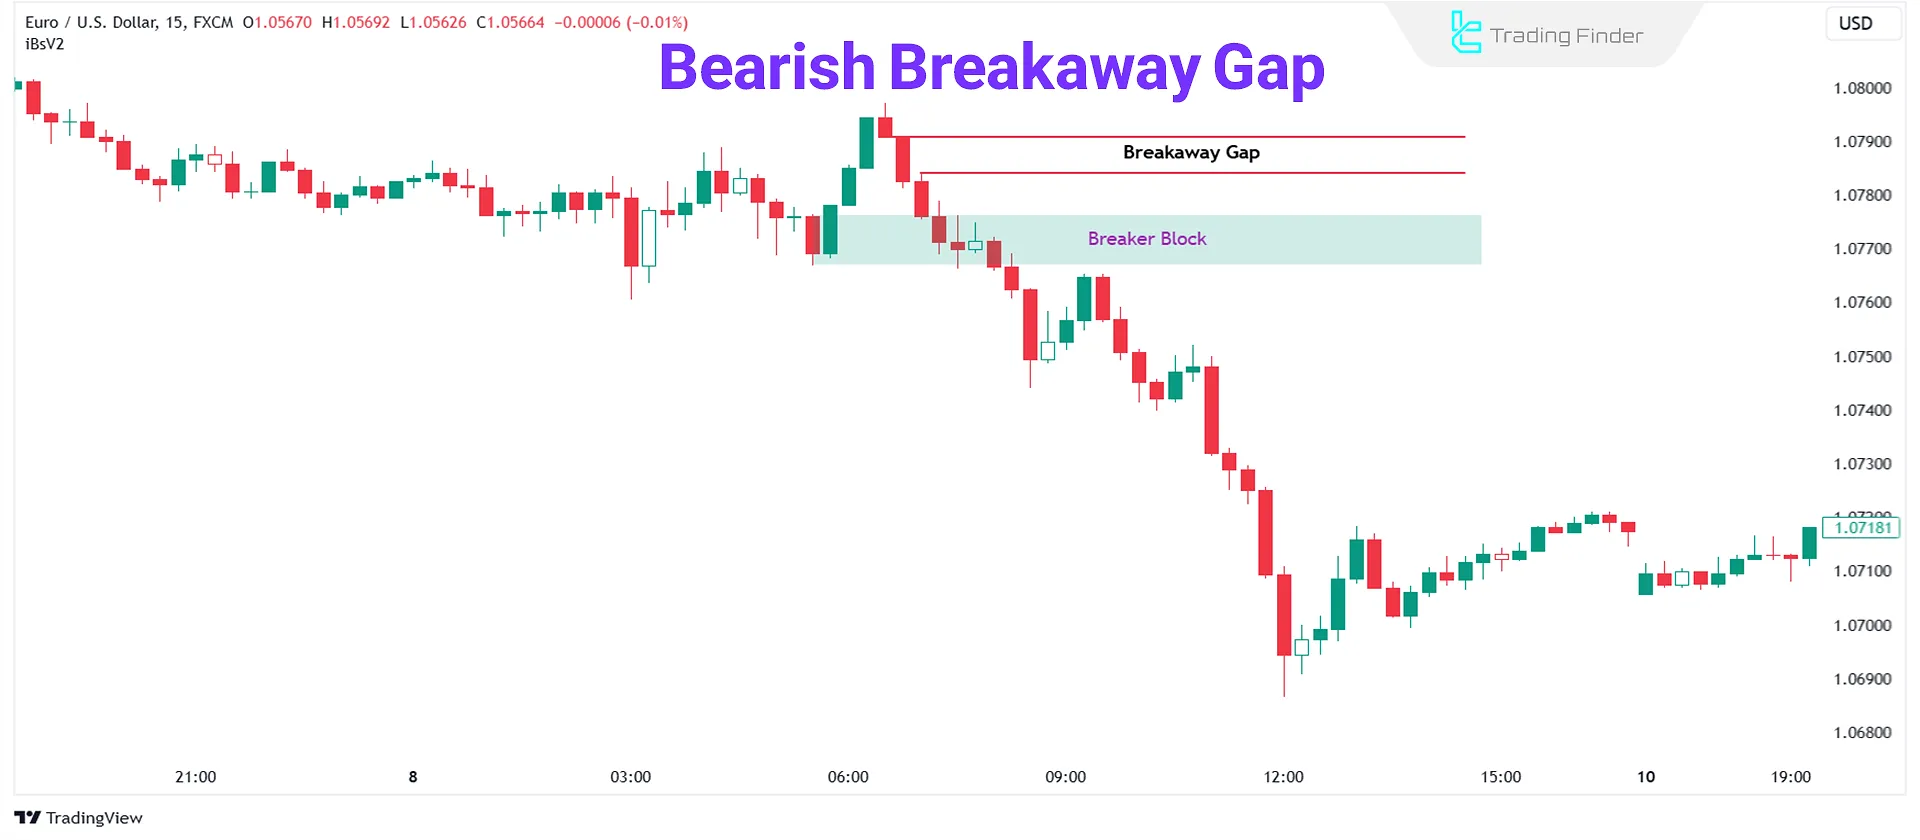
Bearish Breakaway Gap
A Bearish Breakaway Gap, or SIBI, forms near a significant low after breaking it with a strong downward move, and the price is not expected to return.
In the image below, you can see an example of a bearish breakaway gap:
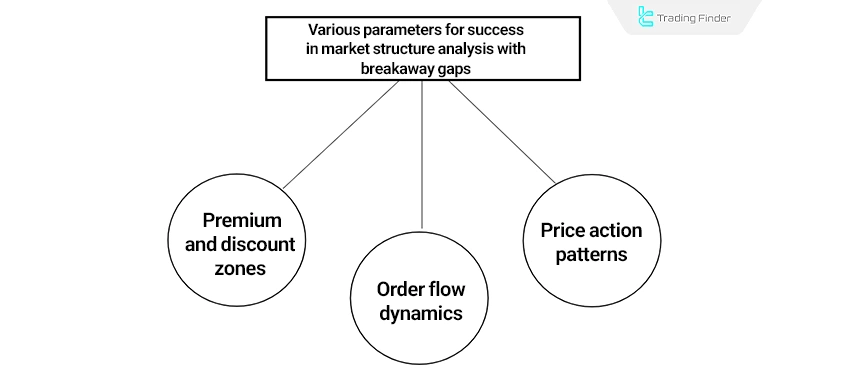
Market Structure Analysis with Breakaway Gaps
Understanding market structure is crucial for successful ICT Breakaway Gap trading and can be analyzed systematically using various parameters.
In this type of analysis, the direction of the dominant trend, the position of the gap relative to highs and lows, and the type of structure break (BOS) or (CHOCH) play a decisive role in the validity of the Breakaway Gap.
The more this gap is aligned with the higher-timeframe trend and formed after a liquidity sweep, the greater the probability of continuation and reaching subsequent price targets.
Premium/Discount Arrays (PD Arrays)
To identify premium and discount zones:
- Define aprice range between high and low points;
- Use Fibonacci tools to divide the range into two distinct zones: premium (above 50%) and discount (below 50%);
- To effectively plan trades, search for key elements like Order Blocks, Fair Value Gaps, and Breaker Blocks in these zones.
Order Flow Dynamics
When analyzing Order Flow, focus on zones where price exhibits specific behaviors. A trading range is defined when both buy-side and sell-side liquidity are taken. Key factors include:
- Formation of Order Blocks
- Liquidity pools
- Price equilibrium points
- Smart money footprints
The educational video on the Sir Pickle YouTube channel provides further explanations about the ICT breakaway gap within market structure, which interested viewers can use for better understanding.
Price Movement Patterns
Specific price movement patterns reveal the quality of a Breakaway Gap. Patterns with above-average volume are generally more effective.
Consider that the price tends to maintain direction after a valid Breakaway Gap, confirming the underlying trend's strength.
This is particularly important when the price moves away from significant support or resistance levels.
Multi-Time Frame Analysis in ICT Breakaway Gaps
The role of multi-timeframe analysis is vital in the trading journey with ICT Breakaway Gaps. This approach significantly enhances decision-making by providing a comprehensive market view.
Analyzing breakaway gaps across multiple timeframes is an approach used to confirm the validity of a breakout on higher timeframes and to determine precise entry points on lower timeframes.
In this approach, the trend and the location of the ICT breakaway gap are first identified on higher timeframes to define the overall market direction and liquidity target.
Then, on lower timeframes, traders look for an FVG, order block, or CHOCH to achieve more precise and lower-risk entries.This multidimensional alignment increases trade win rate and reduces impulsive entries.
Higher Time Frames
Gaps in higher time frames, such as daily or weekly charts, are more reliable than those in lower time frames.
This approach helps maintain an unbiased perspective and avoids common trading errors.
Lower Time Frame Confirmation
After establishing a higher time frame bias (like Daily Bias), use lower time frames for precise entry timing. Structure your analysis with lower time frame confirmation as follows:
- Identify potential Breakaway Gaps in higher time frames
- Look for relevant fair value gaps in lower time frames
- Confirm entry signals with volume analysis
- Monitor price movement patterns for continuation
Time Frame Correlation Techniques
Successful multi-timeframe trading requires consistency in time frame selection. Stick to a combination for at least 30-50 trades before making changes.
This approach allows you to improve risk-to-reward ratios by using higher time frames for directional bias while executing trades in lower time frames.
Correlation also helps avoid overnight risks and news events while maximizing profit potential.
Please pay attention to volume patterns during time frame correlation, as the high trading volume accompanying Breakaway Gaps confirms their validity and strength.
The Role of Session Timing in the Formation of the Breakaway Gap
Time is one of the most important elements in identifying a valid ICT breaker block, and according to ICT teachings, most breakaway gaps form during high-liquidity windows.
Best times for breakaway gap formation:
Session | Ideal time window | Description |
London Kill Zone | 07:00 to 10:00 UTC | The highest initial market momentum and the formation of approximately 40% of breakaway gaps |
New York Kill Zone | 11:00 to 14:00 UTC | High liquidity accompanied by impactful economic events |
End of London session | 15:00 to 17:00 UTC | Formation of many gaps accompanied by end-of-day drops or final price spikes |
Implementation and Risk Management
Successful trading with ICT Breakaway Gaps requires a disciplined implementation and risk management approach.
In this approach, setting a logical stop loss behind the structure or gap zone, waiting for confirmation of a valid breakout, and adjusting position size to market volatility are critically important.
Adhering to an appropriate risk-to-reward ratio and avoiding impulsive entries ensures that even during temporary price pullbacks, overall trade risk remains controlled and long-term performance is preserved.
Entry and Exit Strategies
The most effectiveentries occur when Breakaway Gaps are clearly confirmed through volume and price movement.
Exit strategies should follow a structured approach based on multiple contracts:
- First target at initial support/resistance levels;
- Second target at major market structure points;
- Final portion for broader moves.
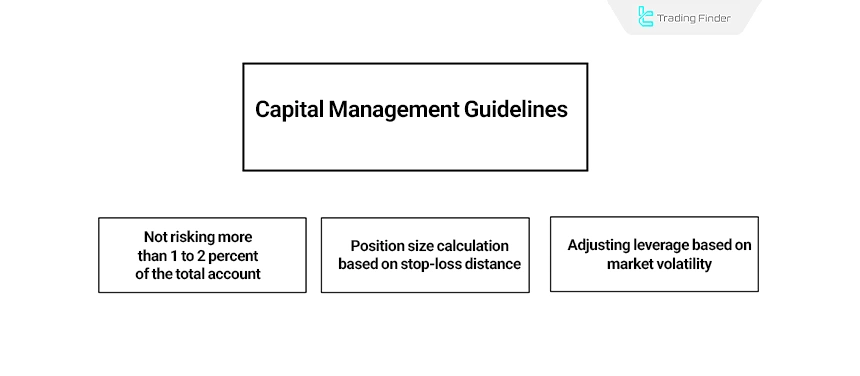
Capital Management Guidelines
Adhering to the one-percent rule is crucial for protecting trading capital. This includes:
- Never risk more than 1-2% of the total trading account on a single trade
- Calculating position size based on stop-loss distance
- Adjusting leverage according to market volatility
Stop-Loss Placement
Stop-loss strategies vary based on trade context and market conditions. For Breakaway Gap trades, stops are placed:
- Above/below the subsequent execution of the gap;
- At the highest/lowest point of the manipulation phase for trend trades;
- Using a 5-10 point range for London session trades.
A minimum ratio of 1:2 is ideal for optimal risk-to-reward ratios, allowing profitability even with a low win rate.
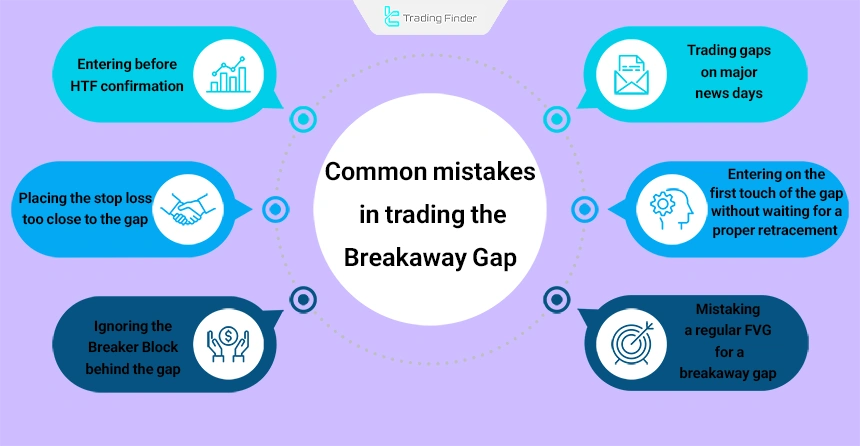
Common Mistakes in Trading the Breakaway Gap
Below are the errors that reduce accuracy in identifying a Breakaway Gap and divert the correct interpretation of the gap structure from its proper path:
- Mistaking a regular FVG for a breakaway gap: Improper differentiation between a standard FVG and a breakaway gap; regular gaps do not have the ability to form strong trends;
- Entering before HTF confirmation: The Breakaway Gap requires confluence with an HTF MSS or BOS;
- Ignoring the breaker block behind the gap: The importance of the BB as the primary filter for gap validity;
- Entering on the first touch of the gap without waiting for a healthy retracement: Higher entry safety in IFVG or BB compared to direct entry;
- Placing the stop loss too close to the gap: The need for an additional 10 to 30 percent buffer to accommodate volatility;
- Trading gaps on major news days: Increased likelihood of forming false gaps and their rapid filling.
Opening Gaps + Breaker Indicator for MetaTrader
The Opening Gaps + Breaker indicator on the MetaTrader platform is an advanced tool based on ICT and Smart Money logic that plays an important role in analyzing price behavior through liquidity, level breaks, and gap filling.
This indicator automatically identifies NDOG (New Day Opening Gap) and NWOG (New Week Opening Gap), marking zones to which price typically tends to return in order to fill and rebalance them.
When the indicator detects an active gap, it displays it on the chart as a support or resistance zone; support zones are marked in gray and resistance zones are marked in red.
If price breaks these levels and market structure shifts, the indicator changes the color of the broken level to purple to indicate its new status as a breaker gap. This feature allows traders to track key areas of role reversal and liquidity displacement with greater precision.
For example, on a currency pair, after a bullish gap initially acts as resistance, breaking this level causes its role to flip to support, and the indicator immediately marks this zone as a bullish Breaker Block.
A similar pattern appears in bearish trends: on a 15-minute chart, a gap-based support is identified, but after price returns and breaks it, the zone flips into resistance and is shown by the indicator as a bearish Breaker Block.
This tool falls under the category of liquidity indicators, reversal indicators, and multi-timeframe analysis tools, and it is fully compatible with Forex, cryptocurrency, stocks, commodities, and forward markets.
In the settings section, options such as New Day Opening Gap Duration, New Week Opening Gap, and other gap management parameters are available, enabling more precise control over the indicator’s behavior.
Overall, Opening Gaps + Breaker Block is considered one of the key tools for ICT-style traders, as it simplifies and enhances the accuracy of smart gap identification, level role-shift analysis, and market.
Conclusion
The ICT Breakaway Gap is a type of Fair Value Gap (FVG) that remains unfilled after a strong price move. Mastery of this structure requires precise market analysis, accurate gap identification, multi-timeframe evaluation, and strict adherence to capital management and risk control principles.
This type of gap typically indicates strong smart money participation in the market and, as long as the trend structure is not violated, can act as a hidden support or resistance zone.
Combining the Breakaway Gap with liquidity analysis, market structure, and multi-layer confirmation significantly increases the probability of low-risk trades aligned with the primary market flow.


