


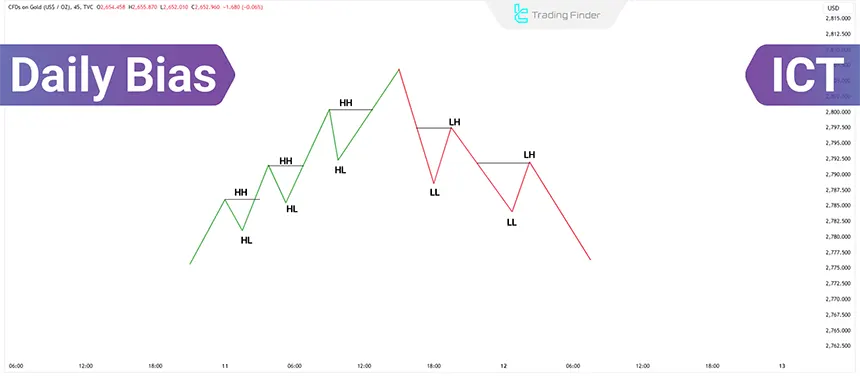
ICT Daily Bias refers to predicting price movement within a single trading day. This prediction indicates whether the price tends to rise (Bullish) or fall (Bearish) and is crucial in successfully implementing the ICT trading strategy.
The daily bias essentially shapes the trader’s analytical framework for the day and clarifies which type of liquidity or which part of the imbalance the market is likely aiming to complete.
By determining the bias, the trader can more accurately identify valid entry zones, invalidation levels, and the probable path of price movement.
What is the Daily Bias?
In ICT methodology, the daily bias is the predominant directional tendency of price movement within a given trading day. It shows which side of liquidity the market is likely to target and which segment of existing imbalance it intends to complete.
This concept elevates daily analysis beyond simple “trend identification” and transforms it into a behavioral model of the market.
To determine the daily bias, the trader begins by examining the structure on the daily timeframe:
- The highs and lows selected by smart money;
- Liquidity pools positioned above and below current price;
- Fair value gaps and remaining imbalances;
- Order blocks that have shaped the existing structure.
Through this assessment, it becomes clear whether the market is more inclined to reach upward liquidity (bullish bias) or downward liquidity (bearish bias).
As long as the daily structure remains intact and unbroken, all intraday analysis stays aligned with that same direction. Tutorial on how to find daily bias in the City Traders Imperium website.
How to Identify Daily Bias?
Pay attention to how price reacts around key highs and lows to determine whether the market is likely to draw liquidity from above or below. To correctly identify the daily bias (ICT Daily Bias), focus on the following elements:
#1 Daily Timeframe Order Flow
This is one of the primary factors for identifying the market's daily movement direction.
Banks and institutional traders use daily charts to execute their orders precisely; thus, analyzing daily order flow can help identify the primary market direction.
#2 Imbalance to Rebalance
One reason for price movements is to balance imbalances in the market. By understanding this concept, traders can identify market imbalance zones, as prices will likely correct these imbalances by moving upward or downward.
#3 Draw on Liquidity
The second reason for price movement is the Liquidity Hunt. To utilize this concept, identify previous highs or lows, as prices often target these levels to capture liquidity.
Why is the daily directional bias important in the ICT style?
The daily directional bias in the ICT methodology plays a fundamental role in analyzing smart-money flow.
This concept defines the price movement framework for a trading day and clarifies which type of liquidity or which part of the imbalance the market intends to complete.
With a proper understanding of this directional bias, the trader views price movements not as random fluctuations but as the gradual execution of a liquidity-driven move.
Educational video on using the daily bias from the TTrades YouTube channel:
The main importance of the Daily Bias is that it sets the behavioral expectation of the market for the current day.
If the order flow trading strategy on the daily timeframe indicates buying pressure, it is logical to expect price to move toward buy-side liquidity above the highs; if the structure is bearish, the market’s focus on sell-side liquidity below the lows becomes predictable.
In such an environment, the trader only looks for scenarios that align with this roadmap. Aligning analysis, entry, and risk management with the prevailing market direction increases the quality of decision making.
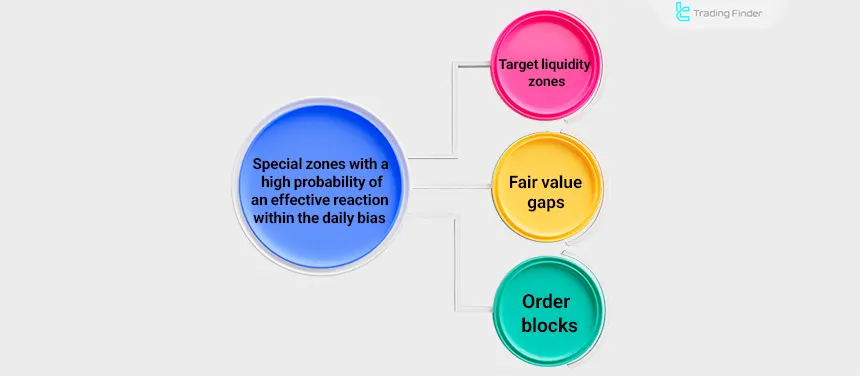
The trader stays away from aimless searching on smaller timeframes; instead, they focus on specific zones that have a high probability of an effective reaction:
- Target liquidity zones;
- Fair value gaps that require rebalancing;
- Order blocks that have established the daily structure.
Another advantage of the daily directional bias is filtering out counter trend movements. Many false breakouts, liquidity grabs, or sharp rejections are simply attempts by price to reach opposing liquidity.
The daily bias makes these behaviors identifiable and prevents incorrect entries. Finally, having a clear directional bias gives structure to the trading plan:
- A defined target path;
- A clear invalidation point;
- An entry structure based on lower timeframes.
Features of Daily Bias
The daily bias is an analytical framework in day trading that is determined based on liquidity flow, market structure, and session behavior.
By identifying the dominant direction of the day, the trader can distinguish high-probability reaction zones from noisy price movements. Types of characteristics of the daily bias:
- Correctly identifies the overall market direction, preventing major mistakes;
- Enables trading only in the correct market direction (buy during an uptrend and sell during a downtrend);
- Helps identify precise entry and exit points for trades.
How to Identify Order Flow in the Daily Timeframe?
To identify order flow on the daily timeframe, we need an accurate reading of the sequence of breaks, retracements, and the way liquidity shifts within market structure.
By examining the BOS/CHOCH pattern, smart-money control zones, and the manner in which imbalances are filled, the true direction of buying or selling pressure on the daily timeframe can be determined.
Steps for identifying order flow:
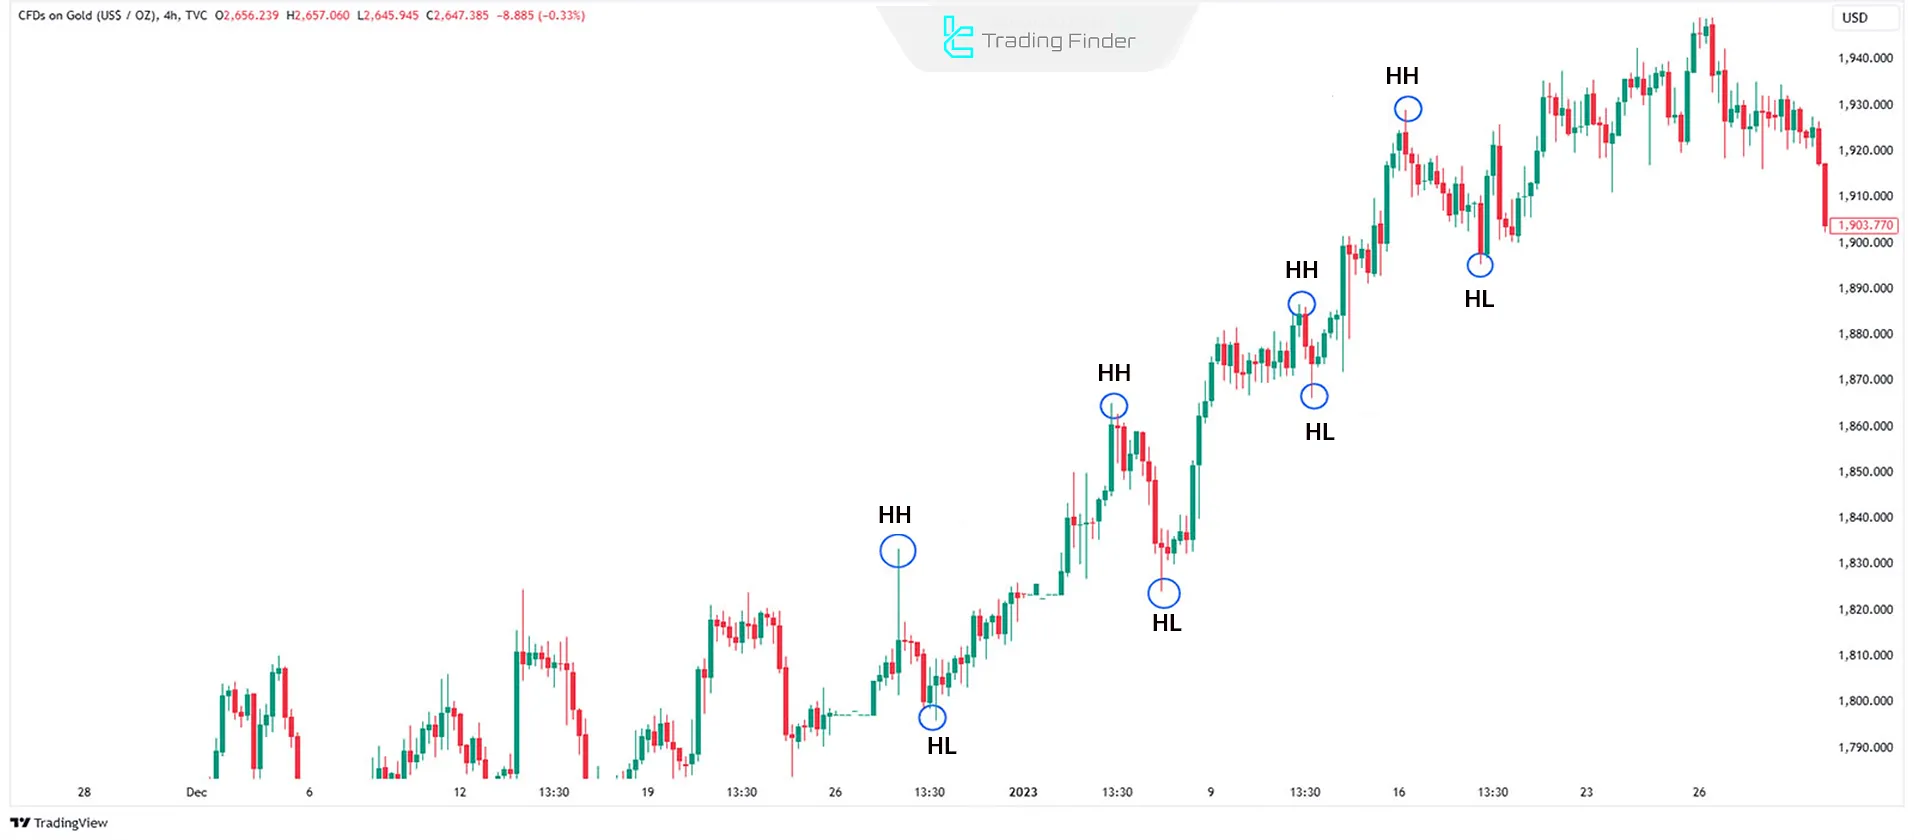
#1 Bullish Order Flow
In bullish order flow, prices create higher highs and higher lows while moving upward to absorb liquidity or resolve market imbalances.
In such conditions, focus on buying opportunities and set the daily bias toward a price increase.
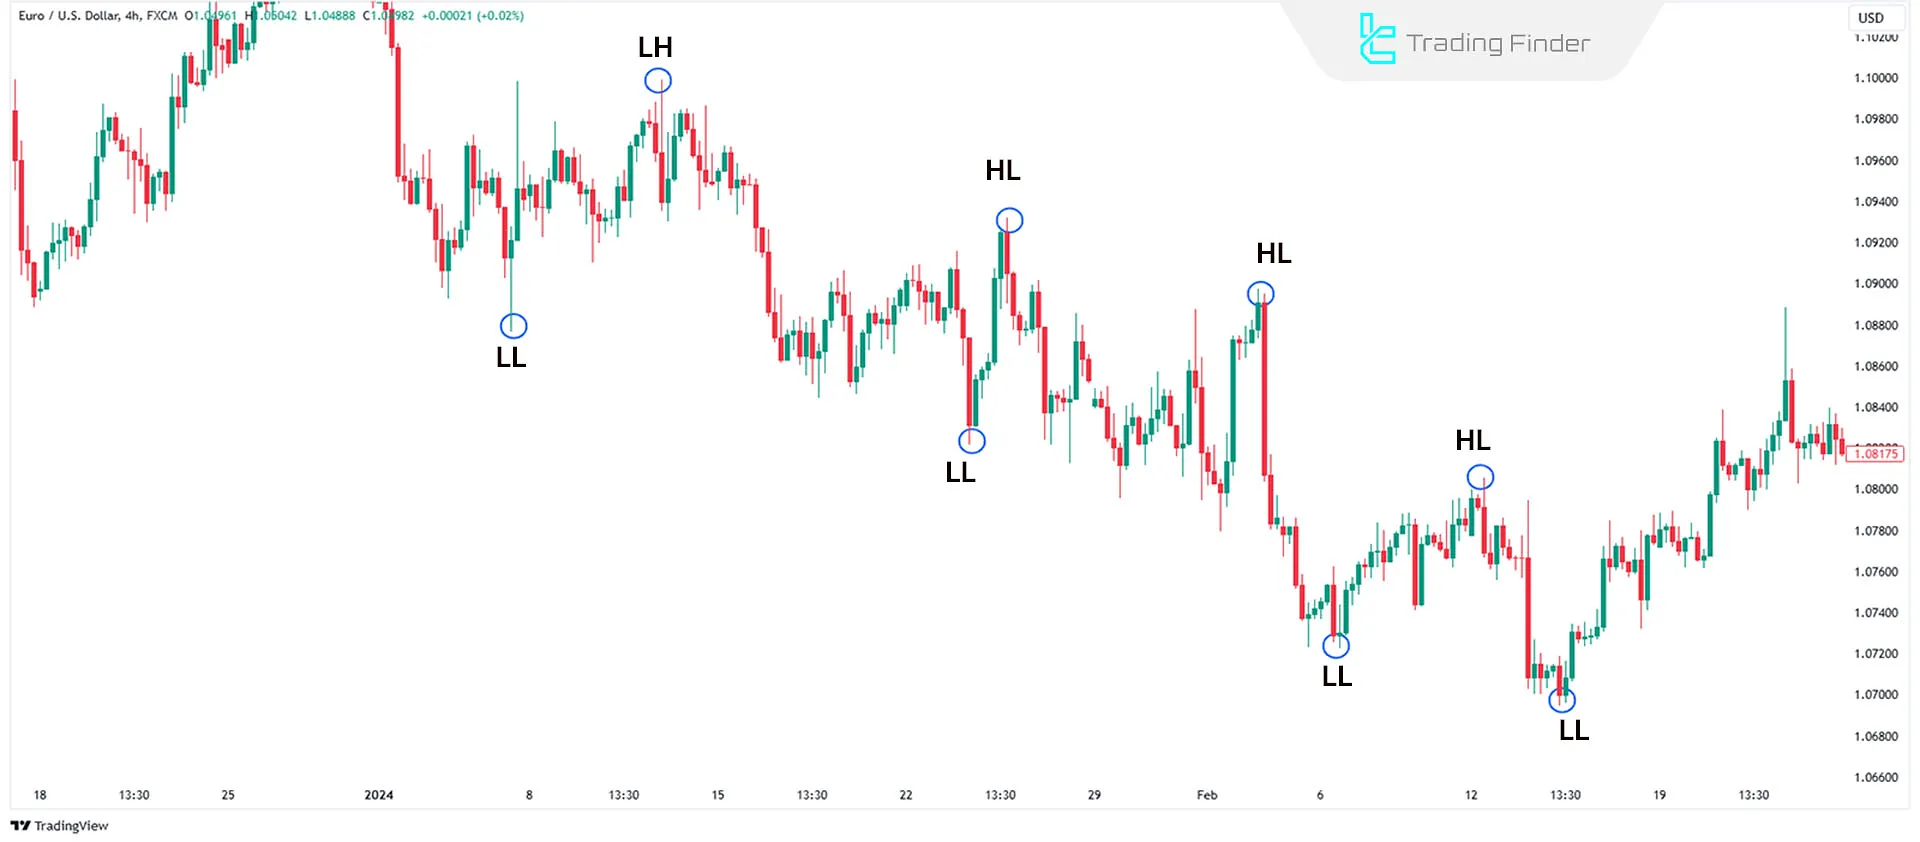
#2 Bearish Order Flow
In bearish order flow, prices create lower lows and lower highs while moving downward to capture liquidity and resolve market imbalances.
In such conditions, focus on selling opportunities and set the daily bias toward a price decrease.
Importance of Daily Bias
The importance of the daily bias in ICT lies in the fact that it reveals the true direction of liquidity and the market maker’s intention for the day, preventing counter-trend entries. It also reduces errors by filtering setups and aligning trades with the effective direction of the day.
Types of reasons for the importance of the daily bias:
#1 Better Decision-Making
Identifying market direction (bullish or bearish) prevents trades that go against the market trend. Aligning decisions with order flow reduces the likelihood of low-quality, reactive entries and centers the analysis on valid market structure.
#2 Higher Accuracy in Trades
Focusing on the correct market direction allows for more precise entry and exit points, eliminates losses from counter-trend trades.
This alignment with the dominant direction allows liquidity levels, order blocks, and reaction zones to be selected with much greater precision, and it significantly improves the quality of trade execution.
#3 Improved Risk Management
Understanding the overall market direction protects traders from unexpected movements and enhances risk management.
Mastering the daily bias makes invalidation zones and scenario cancellation levels clearer, allowing position size, stop-loss placement, and exit points to be adjusted according to the market’s actual behavior.
#4 Liquidity Alignment
The market typically moves toward high-liquidity zones; daily bias helps identify these areas.
By defining the dominant direction, the target path of price and the type of liquidity being sought become clear. This enables the trader to distinguish liquidity-grabs from true structural shifts and to forecast target zones with greater accuracy.
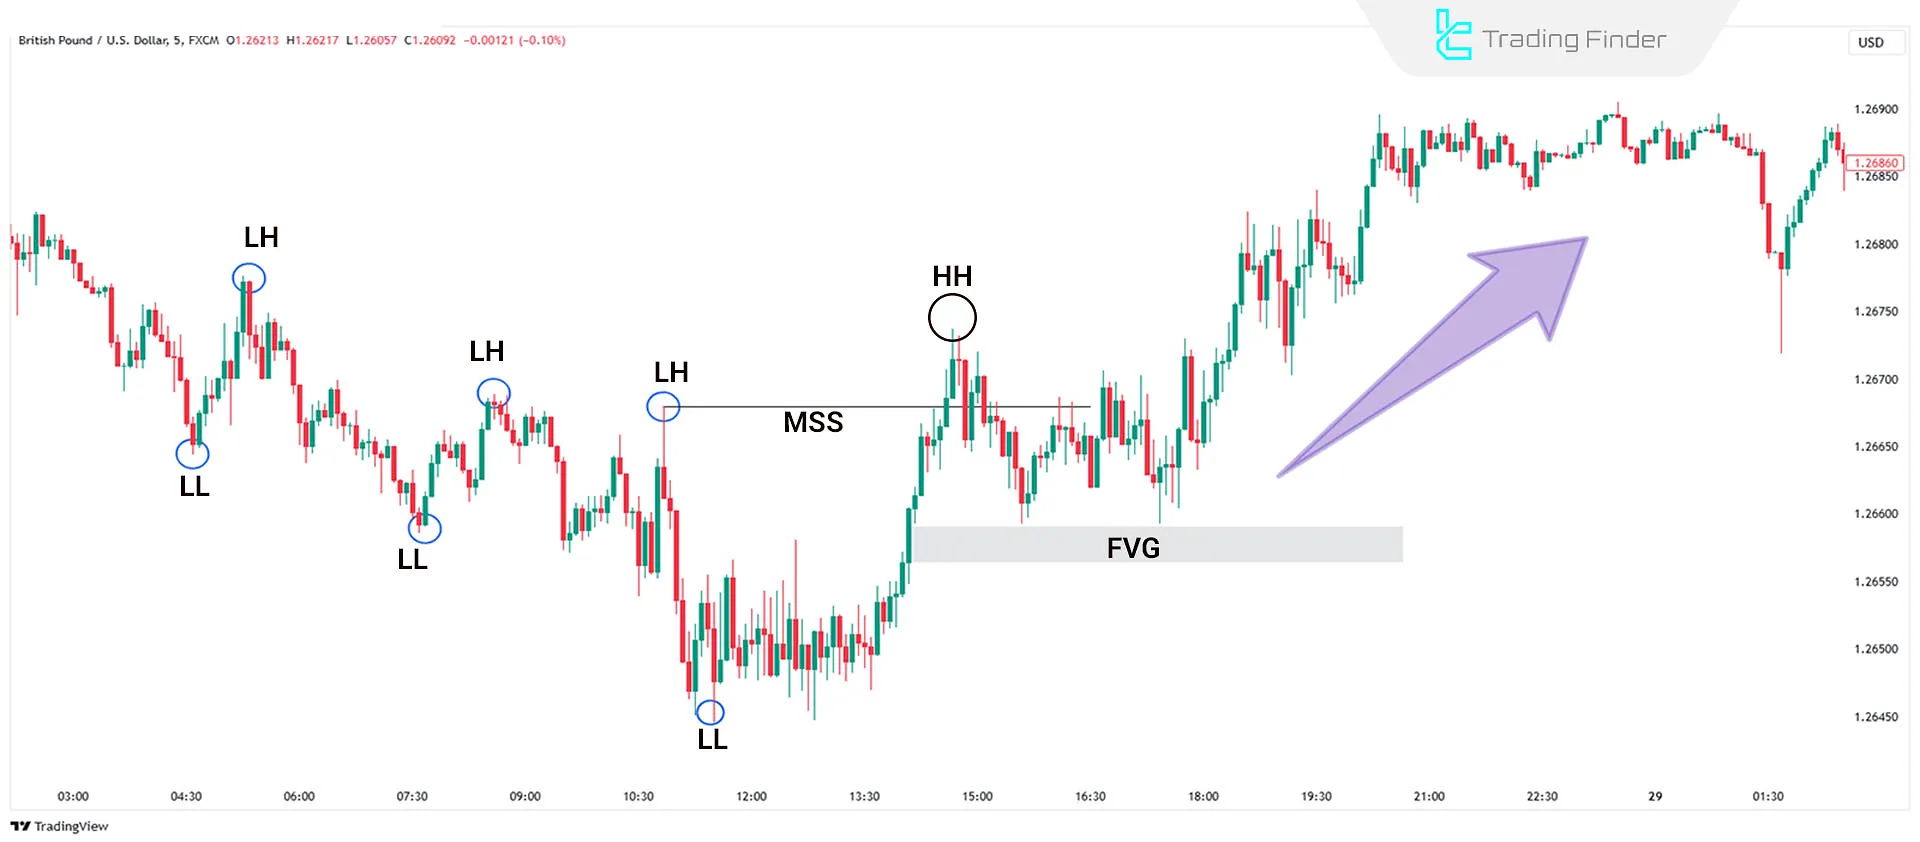
Example of a Bullish Daily Bias
In the GBP/USD chart, the initial bearish structure is visible through a series of lower lows and lower highs, indicating continuation of the downward movement. The market then shifts from bearish to bullish with a Market Structure Break (MSB), forming the first higher high.
Following this break, price retraces downward to fill the FVG, which acts as an ideal smart-money entry zone. As buyers step in, the market develops a strong bullish daily bias, highlighted by the purple arrow on the right side of the chart.
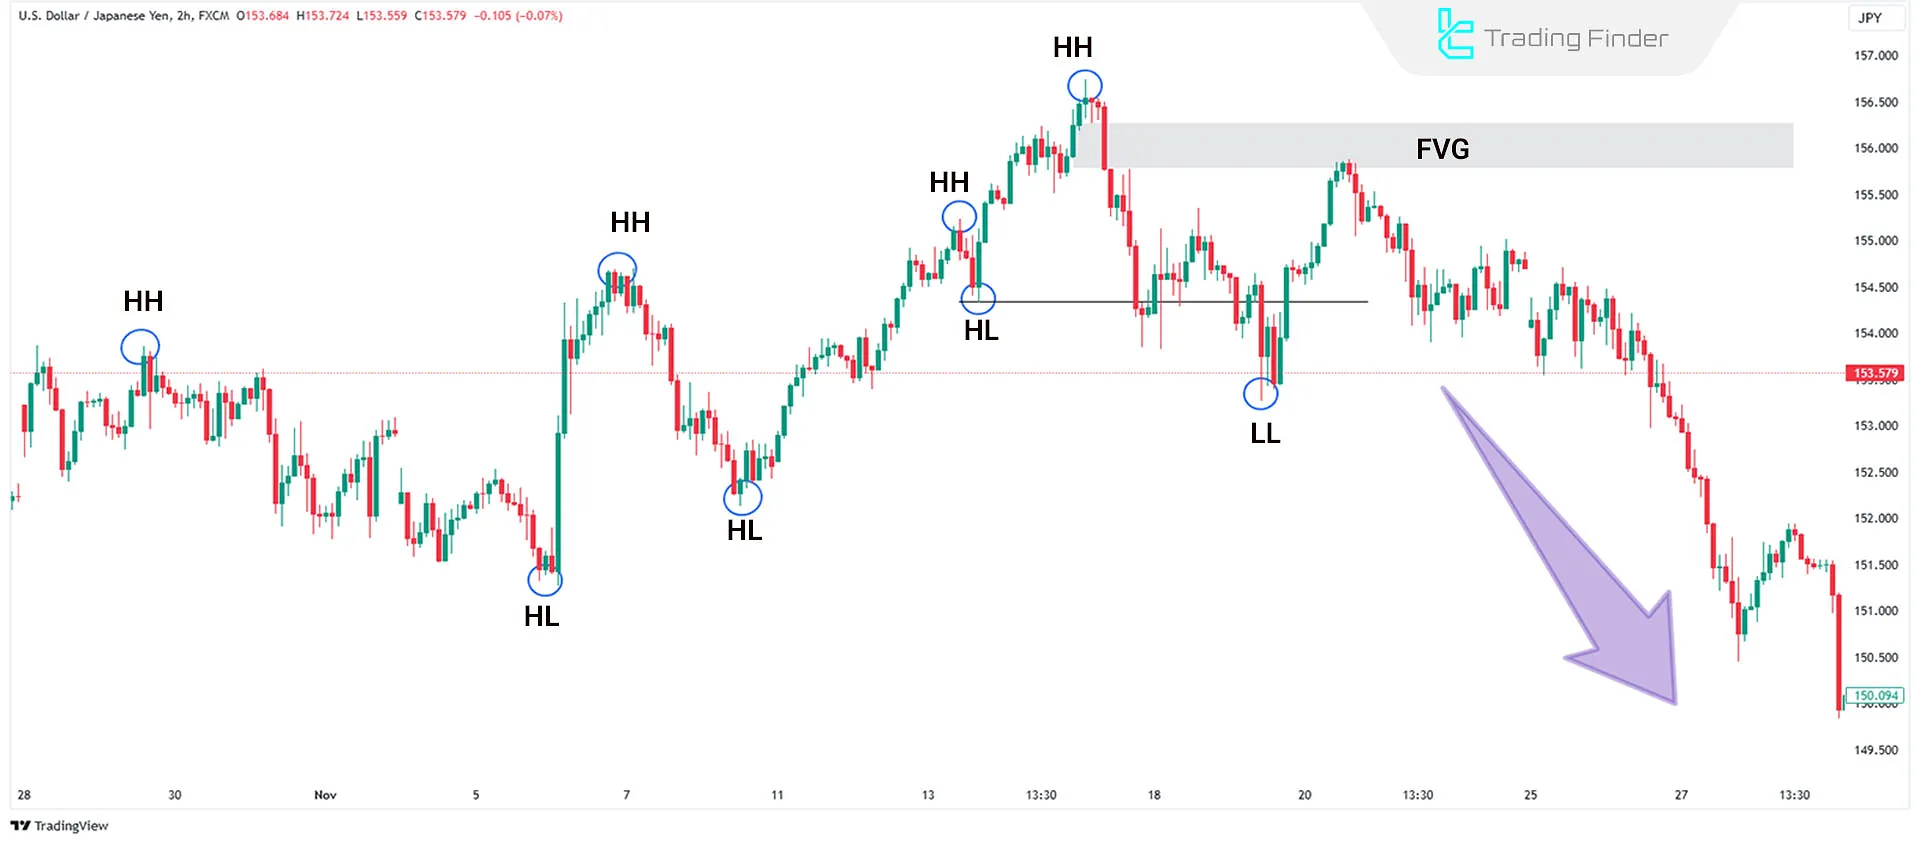
Example of a Bearish Daily Bias
In the USD/JPY chart, the market initially moves within a clearly bullish structure, confirmed by the formation of higher lows and higher highs. After creating the final higher high, price enters an FVG located within a supply zone, where early signs of weakening buyer momentum begin to appear.
The subsequent lower low serves as the first warning of a developing market structure shift, indicating that buy-side liquidity has been taken. Eventually, with the break of this low and the continuation of the decline, the market transitions into a strong bearish trend, highlighted by the purple arrow in the image.
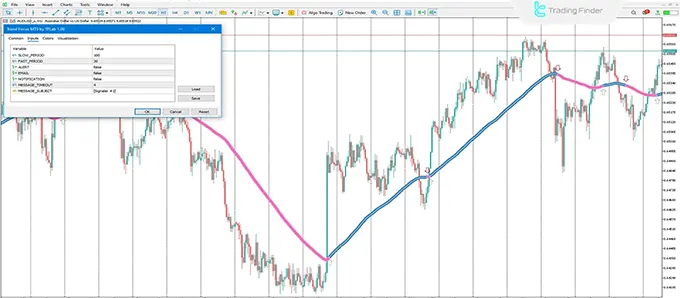
Indicator Use in Identifying the Daily Bias
The Trend Focus indicator is a technical tool based on moving averages, designed to identify the dominant direction of the market. With simple color-coding, it displays bullish trends in blue and bearish trends in red, and issues trading alerts when a directional shift occurs.
The structure of this tool is based on calculating two periods (fast and slow) and using the difference between them to detect directional changes. For this reason, it provides relatively reliable signals for trend-oriented analysts, particularly in choppy markets.
The main function of Trend Focus is to help traders recognize real-time directional changes and provide cues for entering or exiting trades.
It performs well on mid-range timeframes such as M15–M30, as well as higher timeframes like H1–H4, making it useful for day trading, scalping, and intraday strategies.
Additionally, various settings such as alerts, email notifications, and push notifications make trade management easier and increase the trader’s reaction speed.
The connection of this indicator to the ICT daily bias is important because Trend Focus can serve as a supporting tool.
The daily bias is determined through higher timeframe analysis, including market structure, liquidity behavior, and order flow this defines the market’s overall direction for the day.
However, to find precise entry points, the trader needs signals from lower timeframes. At this stage, Trend Focus can provide useful confirmation especially when the indicator changes color in line with the daily bias, increasing the likelihood of a high-quality trading setup.
In summary, the Trend Focus indicator is not a standalone tool for determining the daily bias, but by clarifying short-term direction, it helps the trader better align with the market’s main daily structure.
Combining this indicator with order-flow models, liquidity zones, and market structure within ICT creates a cohesive framework that enhances decision-making power and entry accuracy.
Download Links for the Trend Focus Indicator for Daily Bias Detection:
Common Mistakes in Using the Daily Bias
The daily bias is accurate only when the trader correctly evaluates higher-timeframe structures, liquidity behavior, and price position relative to key zones.
Any deviation from this framework moves the analysis away from order-flow logic and reduces it to time-based or noise-driven reactions. Common mistakes in applying the daily bias:
Determining the Bias Based on Lower Timeframes
Some traders only look at the recent candles and fail to examine the liquidity highs or lows targeted by smart money. As a result, they enter positions at points where price is merely reaching to collect liquidity, which leads to trader losses.
In such situations, the trader, lacking an understanding of the structural position of price and the liquidity destination, effectively stands against the market flow and gets stopped out before the main move even begins.
Ignoring Daily Liquidity
Some traders look only at recent candles and fail to examine highs and lows selected by smart money. As a result, they enter trades at points where price merely taps liquidity, causing avoidable losses.
Without understanding price’s structural position and liquidity destination, the trader effectively trades against the market and is removed prematurely before the real move begins.
Mistaking Retracements for a Bias Shift
Many quick pullbacks or counter-directional moves are merely corrections or liquidity grabs. A true bias shift occurs only when a valid structural break (MSB/BOS) takes place.
Price must not only break a key high or low but also confirm the market maker’s intent to shift order flow. Only then can we say the market’s dominant direction has changed.
Setting the Bias Without Considering the Previous Day’s Candle Close
The closing position of the daily candle relative to liquidity pools, structure, and fair value gaps determines the next day’s path.
It is not enough for price to simply be above or below a level the closing behavior is more important.
How the candle closes (e.g., above an FVG, inside a structural block, or below a liquidity zone) defines the strength and validity of the next day’s bias and prevents incorrect interpretations.
Not Using Confirmation on Lower Timeframes
The daily bias sets the overall direction, but the entry must be confirmed through:
- Micro-structure shift (MSS);
- Break of Structure (BOS);
- A confirmation candle.
Without these signals, traders often enter during a correction or liquidity grab and are quickly stopped out. Aligning the daily bias with micro-structure is essential for low-risk, flow-aligned entries.
Comparison Between Structural Bias and Intraday (Momentary) Bias
Comparing structural bias and momentary bias helps separate real market direction from short-term fluctuations and clarifies the level at which each bias is valid and reliable for decision-making.
Comparison Table of structural bias vs. momentary bias:
Topic | Momentary Bias | Structural Bias |
Reference timeframe | Lower timeframes (15M, 5M) | Higher timeframes (Daily, H4) |
Nature of analysis | Short-term direction based on momentary volatility | Overall market direction based on core structure |
Basis of change | Reaction to liquidity or a corrective move | Valid structural break (BOS/MSB) |
Stability | Variable, short-term dependent | Stable and slow to change |
Main purpose | Identifying entry points aligned with structural bias | Defining the daily path and the macro scenario |
Risk of sudden change | Very high | Very low |
Best use | Entry confirmation or avoiding volatile moments | Filtering trade direction |
Price behavior targeted | Filling micro FVGs, temporary corrections | Moving toward daily liquidity pools |
Common trader mistake | Mistaking a correction for a trend change | Misidentifying BOS |
Psychological effect | Creates doubt or frequent scenario changes | Provides stability in decision-making |
Conclusion
The ICT Daily Bias is a key component of the ICT trading method, helping traders to determine the market's overall direction for the day. By leveraging concepts like liquidity and order flow, this method allows traders to align with the market trend and avoid counter-trend trades.
This approach, by defining the target path of price, directs the trader’s focus toward key zones and areas with a high probability of structural reaction.
It also separates liquidity grab moves from genuine trend shifts, making the decision making process more logical and aligned with institutional market behavior.


