


Higher Highs (HH) and Higher Lows (HL) are fundamental components of trend analysis in bullish markets. These structures indicate the strength of price movements and the tendency for the trend to continue; HL and HH act as critical points for entering and exiting trades.
However, identifying these structures requires a deep understanding of Smart Money concepts (SMC), such as Break of Structure (BOS), Change of Character (CHOCH), and Inducement.
What Are Higher Highs and Higher Lows?
Higher Highs (HH) and Higher Lows (HL) are two concepts in technical analysis used to identify and confirm bullish trends in markets:
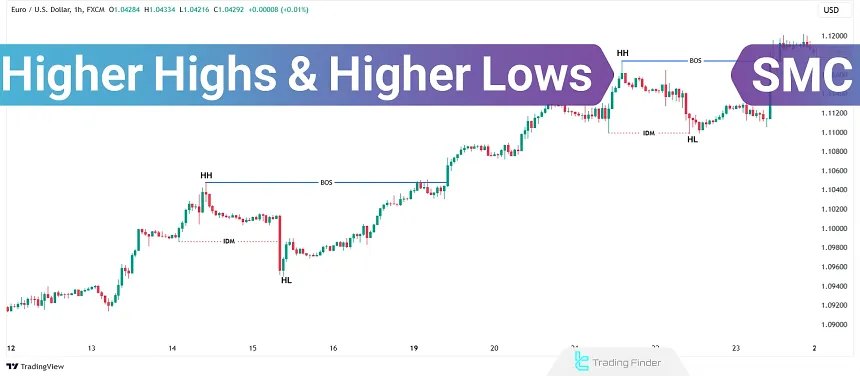
- Higher High (HH): This occurs when a new high on the chart surpasses the previous high. It indicates the continued strength of buyers in the market and serves as a signal for an uptrend;
- Higher Low (HL): This occurs when a new low is higher than the previous low. It demonstrates sellers’ failure to push the price below the prior low and confirms the validity of the ongoing uptrend.
These two concepts create an upward structure that signifies buyer dominance and trend continuation.
Identifying these patterns is crucial as they allow traders to pinpoint entry points for buy positions and identify suitable areas to place stop losses.
How to Identify Higher Highs in a Bullish Market?
Although price creates higher highs in a bullish market, not all are considered structural highs! Guide to identify valid Higher Highs (HH) in a bullish market:
- Start by identifying Inducement (IDM);
- After detecting the Inducement, wait for the price to form a swing high and pullback to sweep the Inducement;
- When the price collects the Inducement, the last swing high before the collection is considered the valid Higher High.
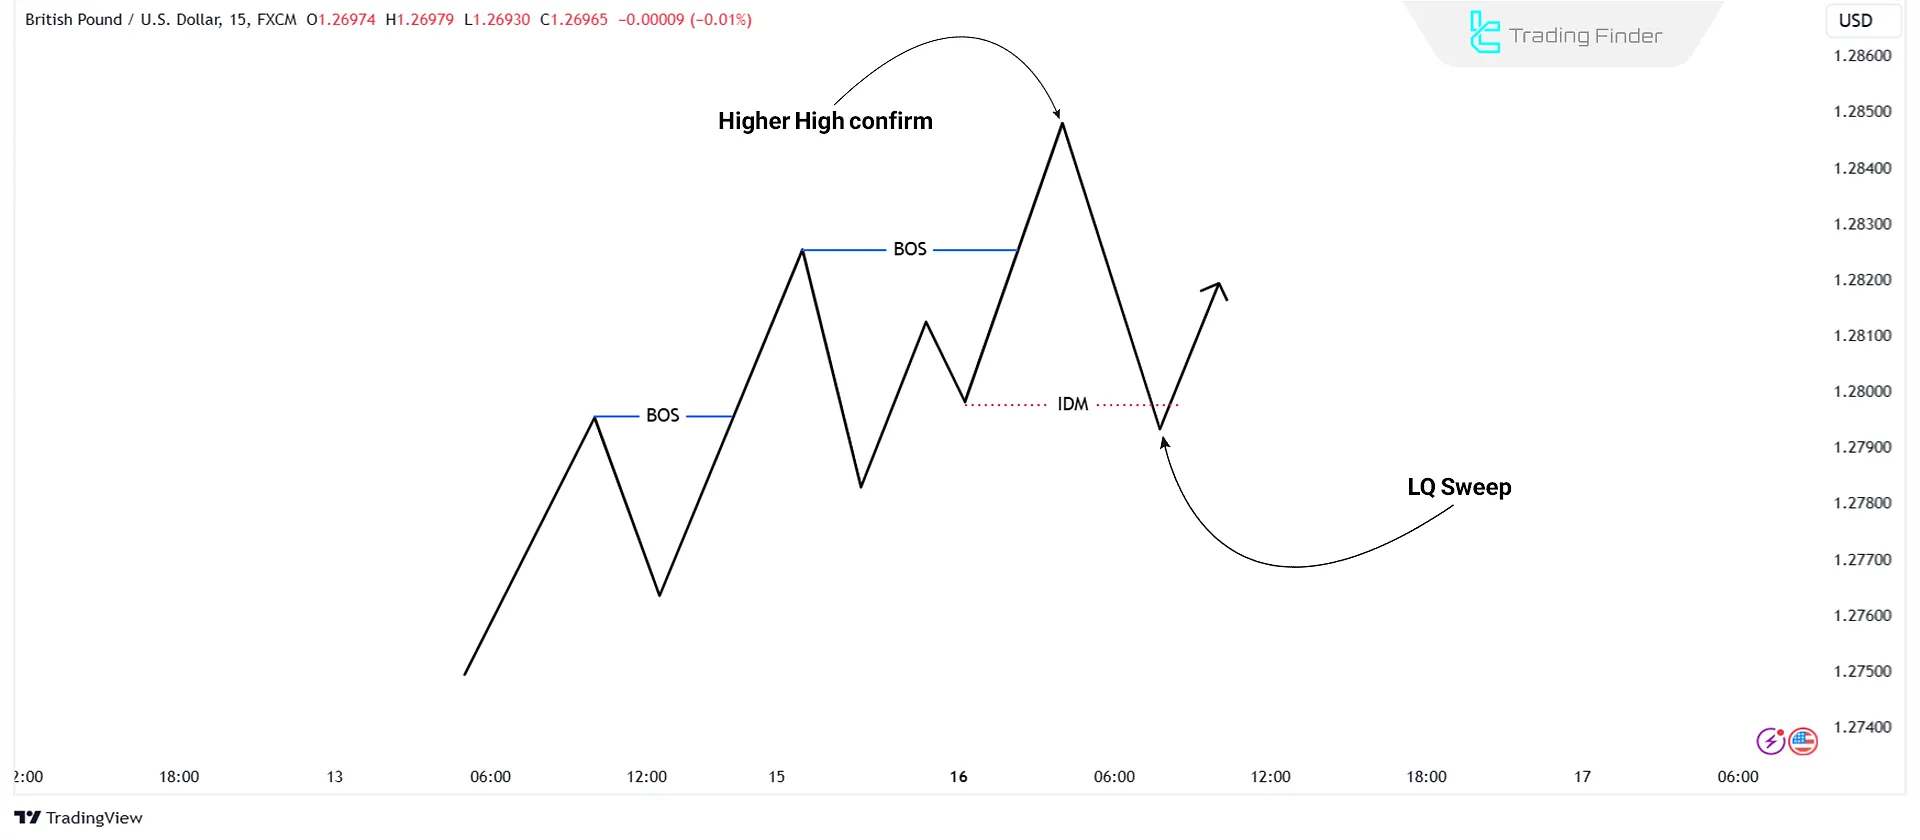
When the price breaks a Higher High, this is called a Break of Structure (BOS). With each price break, look for Inducement sweeps to confirm the Higher High.
Guide to Identify Higher Lows in a Bullish Market
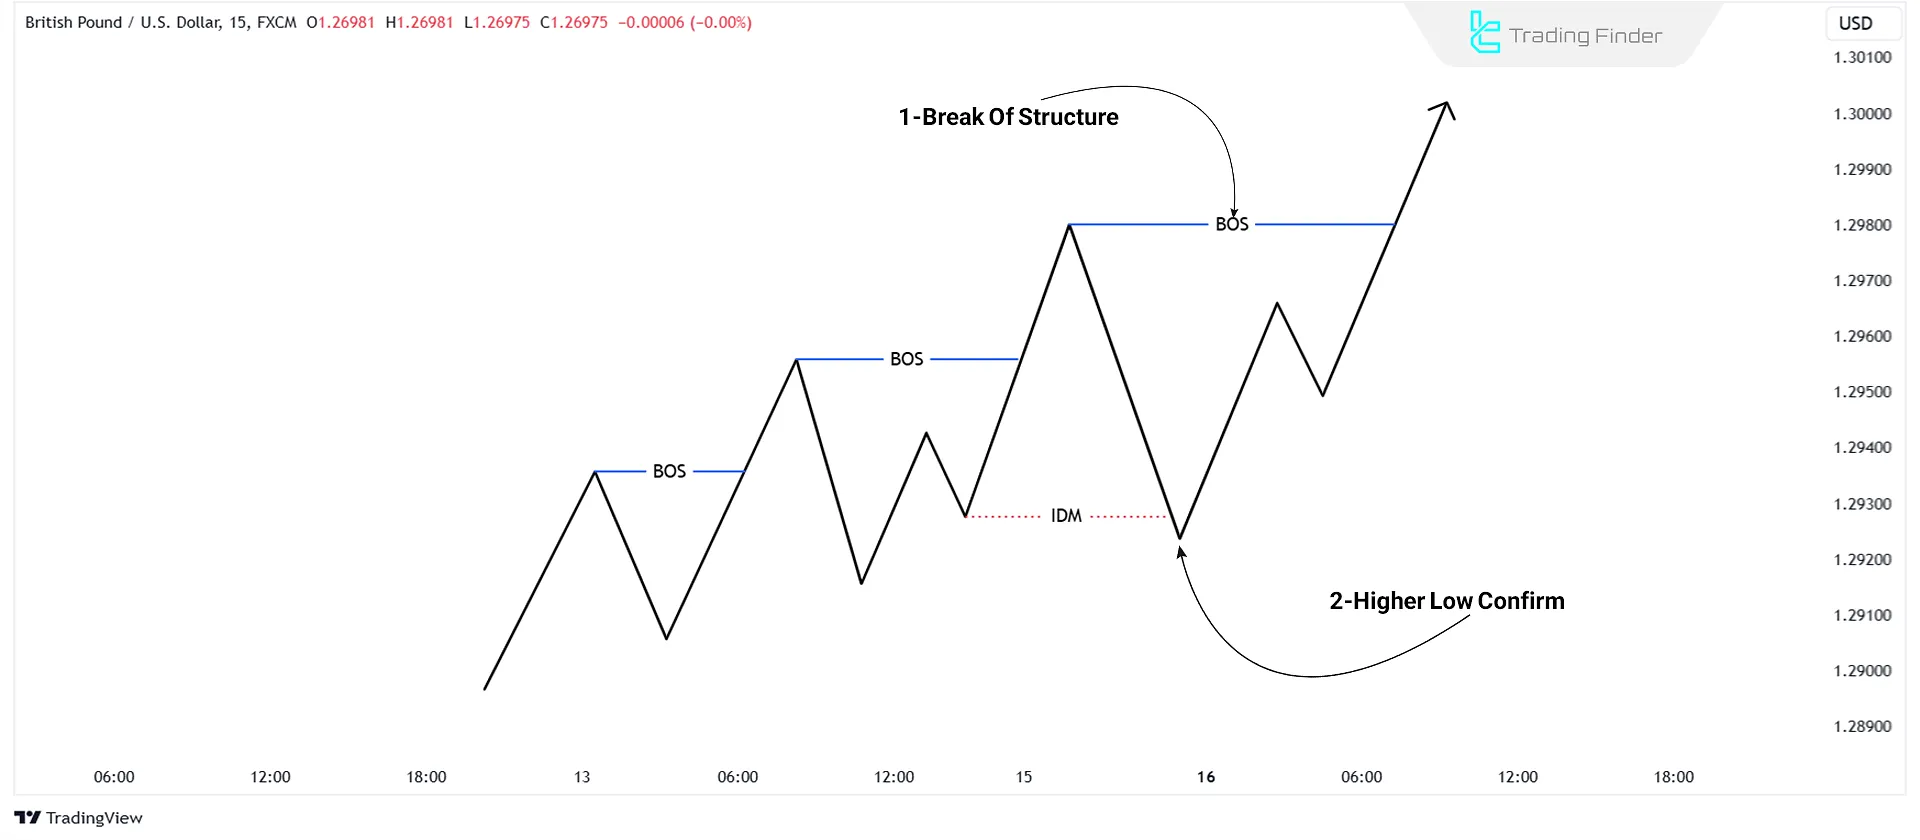
Even though prices create higher lows in a bullish market, not every low is a valid Higher Low. Follow these steps to confirm a valid Higher Low (HL):
- Look for swing lows forming during Inducement sweeps by the price;
- After forming the swing low, the price rises and breaks the previous high, the last swing low is marked as a valid Higher Low.
Identify Higher Lows by finding Break of Structure (BOS) upwards and liquidity sweeps to confirm their validity.
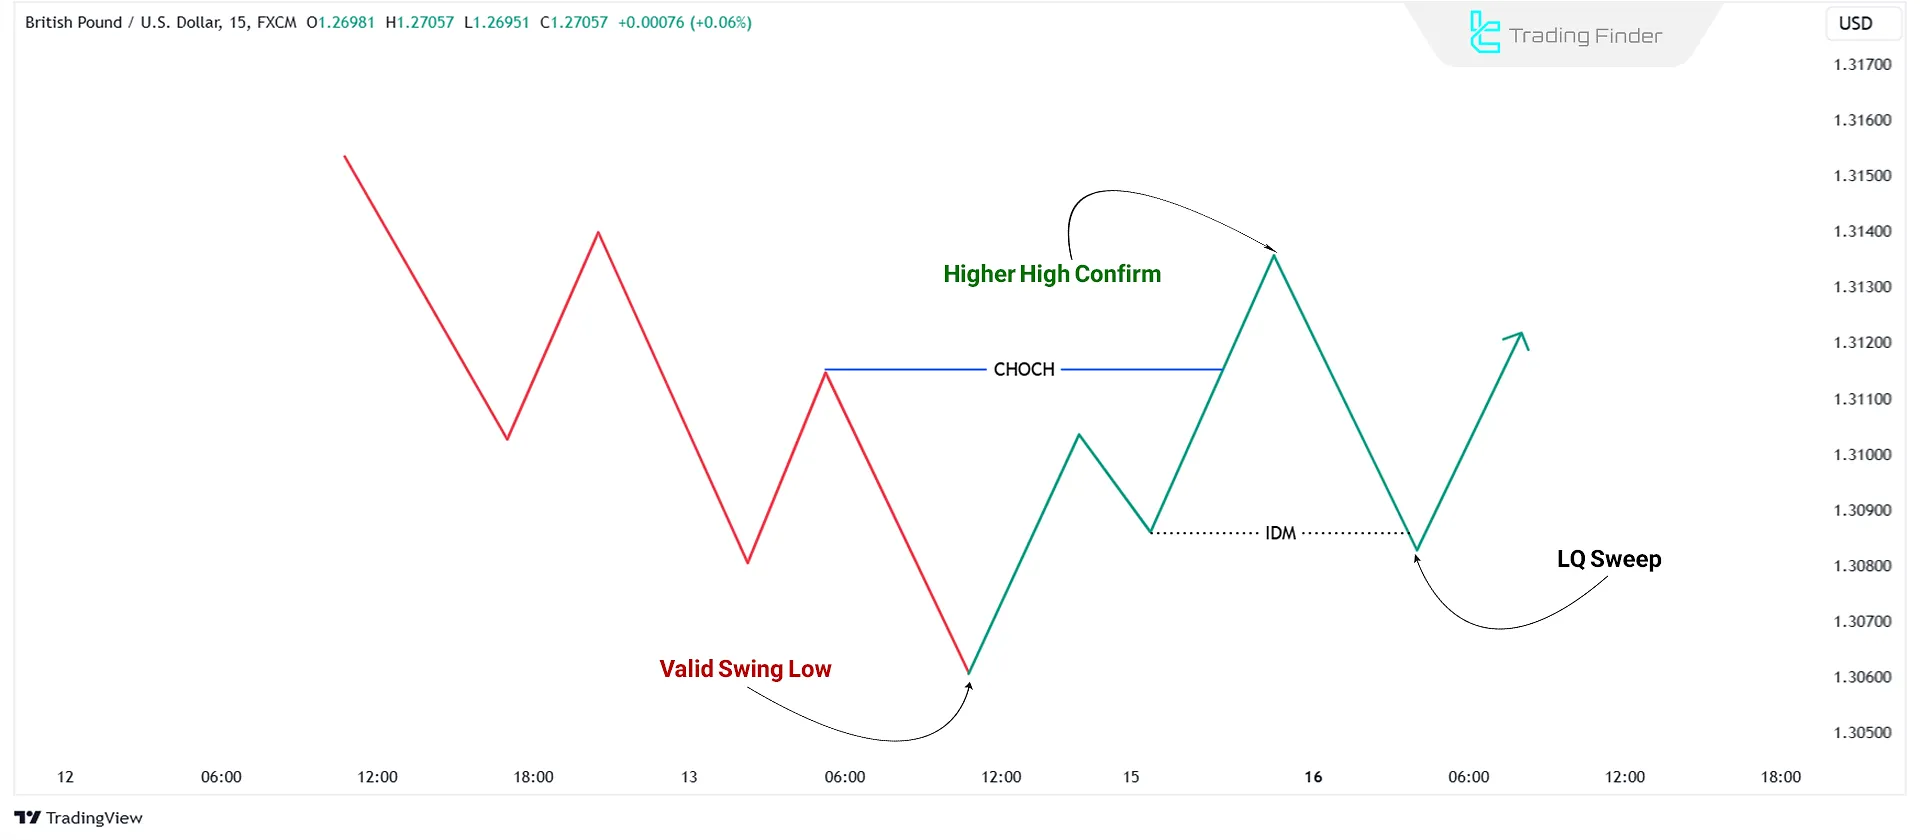
Example of Identifying HH and HL in Market Trends
For example, in an uptrend, the market first forms an HH. It then enters a retracement but does not break the previous low, and an HL is formed. However, not every HL is necessarily valid.
To confirm an HL, liquidity collection in the form of Inducement (IDM) must first be observed, followed by the formation of a swing low.
After the swing low is formed and IDM is confirmed, price must rise and break the previous high. With the occurrence of a BOS, that swing low is recognized as a valid HL, and the continuation of the uptrend is confirmed.
In the next retracement, a new HL is formed, which may also go through the same steps; namely, the appearance of IDM first, then the formation of a swing low, and finally the break of the previous high as a BOS.
After these conditions occur, the market forms another HH and the uptrend continues.
This structure shows that the most valid and lowest-risk entry points in an uptrend are entries at HLs that have satisfied all three conditions: IDM, swing low formation, and the occurrence of a BOS.
How to Identify Structural Lows After a Bullish CHOCH?
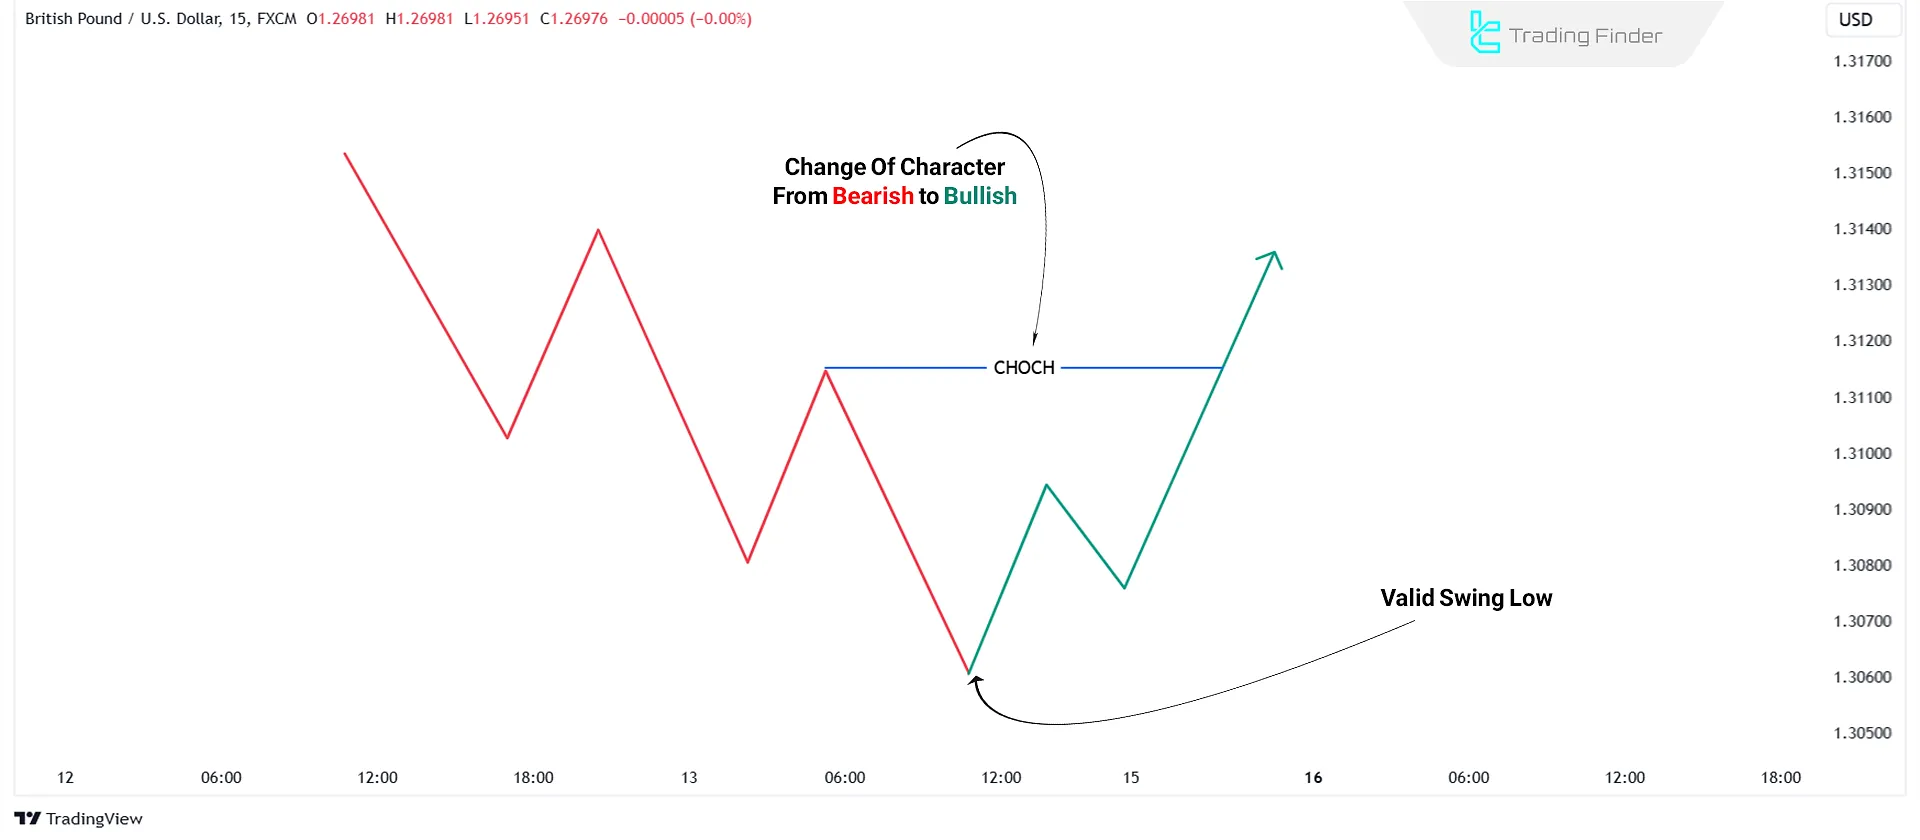
To identify a structural low after a bullish Change of Character (CHOCH), follow the steps below:
- Mark the lowest low created before the CHOCH;
- When the market transitions from bearish to bullish, the lowest low of the bearish trend is marked as the structural low since the bullish trend begins from there.
After every Break of Structure, locate Inducement sweeps and the subsequent upward BOS to confirm the Higher Low.
Guide to Identify Structural Highs After a Bullish CHOCH
CHOCH signifies a change of character; therefore, mark the Higher Highs accordingly when the market transitions from a bearish to a bullish trend. To identify a structural high after a bullish CHOCH:
- Detect Inducement (IDM);
- Wait for a swing high to form;
- After the swing high is formed and the price sweeps the Inducement, the last swing high is marked as the valid structural high.
Find the Inducement sweeps after every Break of Structure to confirm the Higher High (HH).
When Does an Uptrend Structure Change and Break Down?
An uptrend maintains its validity as long as the price movement structure can continuously sustain the sequence of higher highs and higher lows, meaning the cycle of HH followed by HL and again HH and HL.
However, it should be noted that this structural pattern is not permanent and may lose its stability due to changes in price behavior or a reduction in buying pressure, causing the trend to weaken or reverse. An uptrend becomes disrupted when:
- Price fails to form a new higher high;
- A new low forms below the previous low (the first Lower Low).
If the first sign of trend weakness appears and, after forming an LL, price rises but creates a Lower High, the structure is completely broken and a trend reversal begins in earnest.
This concept is fundamentally important for traders who analyze based on ICT market structure, as it helps prevent entering long trades in areas where the probability of price reversal and increased risk is high.
In addition, awareness of this structural behavior enables traders to be prepared to identify early signs of CHOCH or a reverse BOS and to recognize potential trend direction changes in a timely manner.
In the training article on how to trade using HH and HL on the xs.com website, more detailed explanations are provided about the structure of an uptrend and higher highs and higher lows, which interested readers can refer to.
Can We Mark a Higher High and Higher Low Without Inducement Sweeps?
No! The Inducement Sweep (IDM Sweep) is essential to validate a Higher High. Beside that, to confirm a Higher Low, both Inducement Sweeps (IDM Sweep) and an upward Break of Structure are required.
The educational video on the Mind Math Money YouTube channel provides additional explanations about higher lows and higher highs on the price chart, and traders can use this content to gain a deeper understanding of market structure.
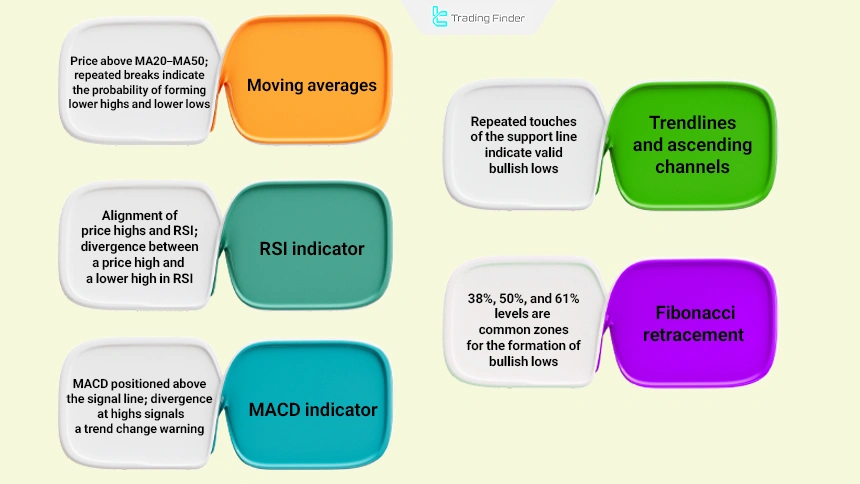
Auxiliary Tools for Identifying HH and HL
Although identifying HH and HL is more accurate through pure price action, some tools can be used as trend confirmation:
- Moving averages (MA20 – MA50): Price holding above the averages indicates buyer dominance and the formation of valid HH/HL, while repeated breaks of the averages signal an increased probability of forming LH/LL;
- RSI indicator: An HH in price accompanied by an HH in RSI indicates a healthy and sustainable trend, whereas an HH in price combined with an LH in RSI signals divergence and warns of trend weakness;
- MACD indicator: MACD positioned above the signal line confirms an uptrend, while MACD divergence at highs indicates the potential for a CHOCH or trend exhaustion;
- Trendlines and ascending channels: Repeated price reactions at the channel support line indicate the formation of valid HLs;
- Fibonacci retracement (38% – 50% – 61%): Common HL formation zones in many markets, where one of these levels often serves as the HL formation area.
Previous Highs and Lows Indicator for MetaTrader
The Previous Highs and Lows indicator is one of the key tools in MetaTrader that analyzes raw price data to extract the most important historical High and Low levels and displays them as horizontal lines on the chart.
These lines, which can be static or dynamic, are recognized as historical support and resistance zones and play an important role in identifying price behavior.
This indicator falls under the category of support and resistance tools, trading tools, and technical levels, and is suitable for traders with an intermediate skill level. Due to its nature, it is also classified among reversal indicators as well as tools for identifying price breakouts.
The Previous Highs and Lows indicator can be used across all tradable markets in Meta Trader, including Forex, the stock market, and cryptocurrency, and is highly practical in day trading styles as well as multi-timeframe analysis.
In bullish market conditions, price breaking above a previous high usually signals increasing buyer strength.
For example, on a 1-hour chart, breaking a previous high can confirm the start of a new bullish phase and offer a valid buy entry zone. Conversely, on a 5-minute chart in a bearish trend, breaking a prior low signals increasing selling pressure.
A price retracement back to this broken level and its conversion into resistance is typically considered a low-risk entry point for sell positions.
The indicator features a relatively comprehensive settings panel with options such as “DRAW PIVOTS” for displaying pivot levels, ZigZag-related settings including “PERIOD” and “BACKSTEP,” and the ability to enable or disable ZigZag lines.
Additionally, traders can define the colors of High and Low lines, adjust line thickness, and set the historical lookback range (HISTORY LIMIT) to customize the indicator’s display according to their analytical style.
Overall, the Previous Highs and Lows indicator is a precise tool for identifying key historical levels where price often reacts, helping traders spot entry, exit, breakout, and reversal opportunities and build a more structured analysis.
Common Mistakes in Identifying Higher Highs and Higher Lows
When identifying an uptrend based on HH and HL, many traders make similar mistakes. The most important of these errors are listed below:
Common mistake | Description |
Marking false swings | Identifying small price movements as structural swings without confirmation from a BOS or CHOCH |
Ignoring the higher timeframe | Observing a bullish structure on a lower timeframe while it contradicts a bearish trend on the higher timeframe |
Late trade entry | Entering after the formation of an HH, which carries higher risk compared to entering at an HL or on a pullback after a BOS |
Ignoring trading volume | Formation of an HH accompanied by decreasing volume, signaling trend weakness |
Trading in neutral ranges | Applying HH/HL structure within a range-bound market, leading to analytical errors |
Conclusion
Higher Highs (HH) and lower lows (HL) in a bullish market signify market strength and the tendency to continue the uptrend.
Understanding concepts like Break of Structure (BOS), Change of Character (CHOCH), and Induction is essential to identifying these key points, as not every high or low on the price chart is inherently valid and requires confirmation.


