


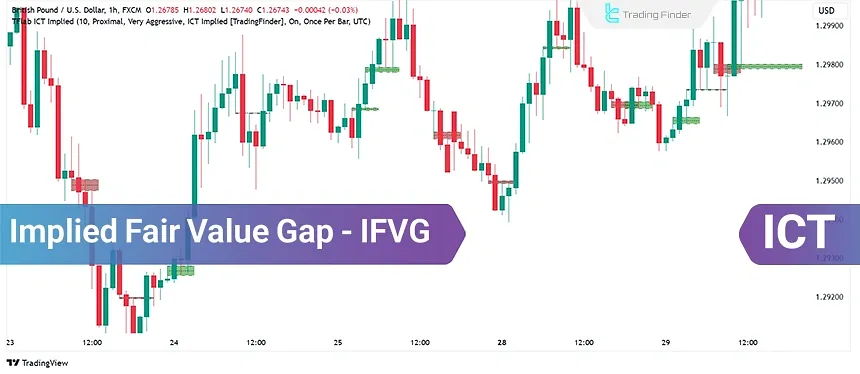
Implied Fair Value Gap (IFVG) is a significant imbalance area in ICT Style, indicating potential price trend reversals in financial markets. Unlike most Fair Value Gaps(FVG), the IFVG refers to a subtle area where a price imbalance exists, but no clear and visible gap is formed.
This zone often forms at the beginning of a trend reversal or during the liquidity redistribution phase and acts as a key level for entering or confirming a trend reversal.
Accurate identification of an incomplete value zone requires precise analysis of price behavior, examination of order flow, and its alignment with liquidity zones.
Unlike most Fair Value Gaps (FVG), the IFVG refers to a subtle area where a price imbalance exists, but no clear and visible gap is formed.
What is the Implied Fair Value Gap (IFVG)?
The IFVG is a pattern composed of three candlesticks:
- A middle candlestick with a large body;
- The preceding and succeeding candlesticks, where their wicks overlap the body of the middle candlestick;
This structure suggests that no explicit gap exists between the candles, yet it is still considered an area of price adjustment.
Difference Between Ifvg and Regular Fvg
The difference between FVG and IFVG lies in the type, structure, and method of identifying the price gap; IFVG is formed based on order flow behavior (Order Flow) and liquidity changes (Liquidity), while the Fair Value Gap (FVG) is extracted from the spacing of candles on the price chart.
The table below provides a more detailed examination of the differences between implied FVG and regular FVG.
Feature | IFVG (Implied Fair Value Gap) | Regular FVG (Fair Value Gap) |
Nature of Gap | Hidden and invisible imbalance zone | Clear and visible price gap |
Formation Structure | Three candles with a strong middle body and overlapping shadows | Three consecutive candles with a defined price gap |
Identification Method | Precise candle analysis and Fibonacci tools | Direct observation of the price gap on the chart |
Liquidity Precision | Identification of subtle and hidden liquidity areas | Focus on visible price imbalance zones |
Analytical Use | Identifying reversal points, liquidity absorption, trend confirmation | Forecasting gap fill and price correction |
Price Behavior on Return | Strong reaction and structural price reversal | Gap fill and continuation of the previous trend |
Timeframe Application | High accuracy in daily and 4-hour timeframes | Easily observable in all timeframes |
User Group | Smart money traders and ICT analysts | Classic price action traders |
How to Identify IFVG?
IFVG diagnosis is carried out in four consecutive stages, with each stage forming the foundation for the next. This temporal sequence is valid only if followed without omission or skipping, and each component is evaluated according to specific criteria.
At each step, structural indicators are examined, and the outcome of that step determines the pathway into the subsequent stage:
#1 Observe Price Movements
Begin by identifying sharp price movements. Look for candlesticks with large bodies, as they indicate rapid and significant changes in market structure.
In the optimized fair value gap tutorialon the writofinance.com website, more detailed information is provided regarding the analysis of price movements and the examination of IFVG, which traders can make use of.
#2 Analyze Adjacent Candlesticks
After identifying a large candlestick, examine its adjacent candlesticks (the one before and the one after).
If the shadows of these candlesticks overlap the large body's range, this overlap is recognized as the Implied Fair Value Gap (IFVG).
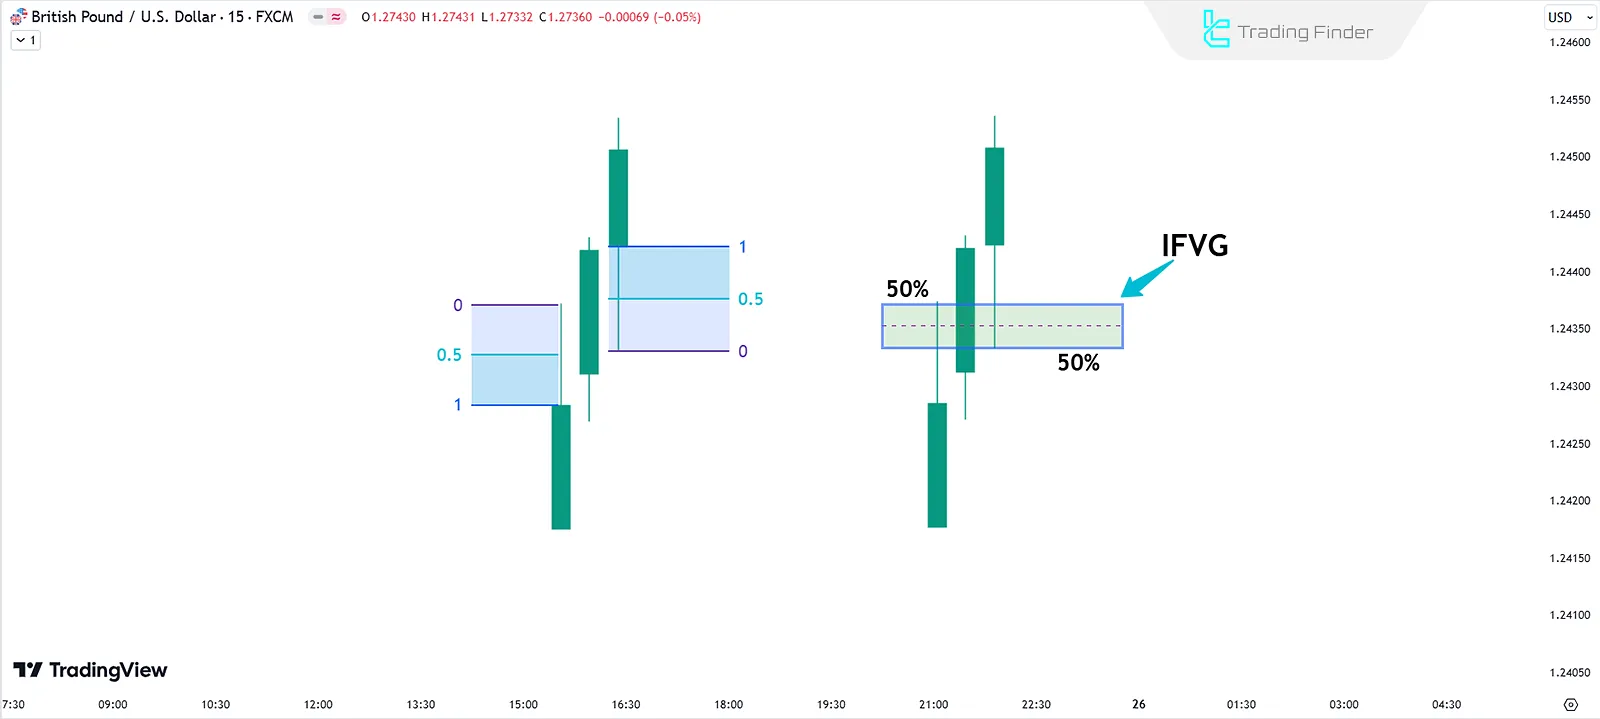
#3 Use Fibonacci Tool
To pinpoint the IFVG more accurately, apply the Fibonacci tool:
- Bullish pattern: Calculate 50% of the upper wick of the first candle and 50% of the lower wick on the third candle;
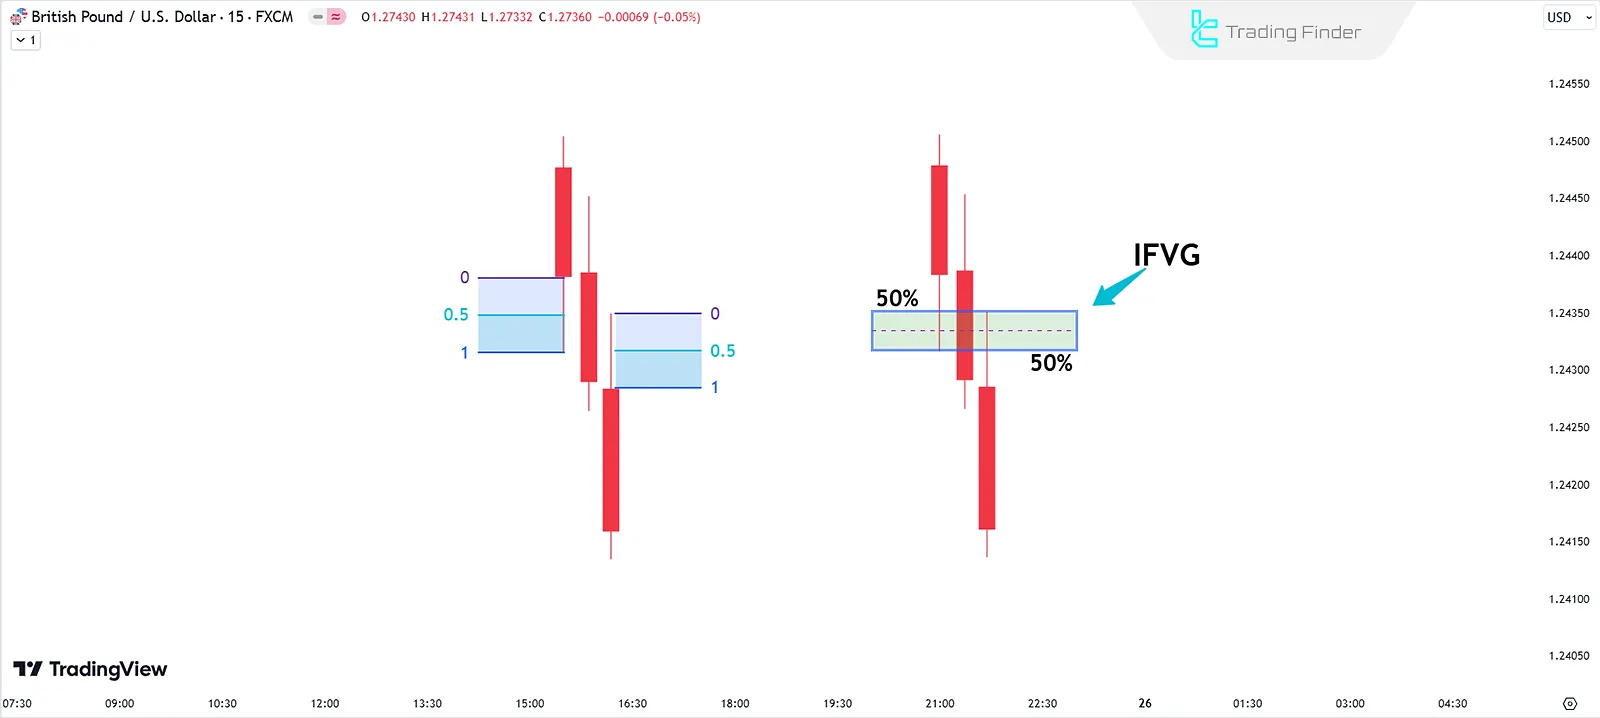
- Bearish pattern: Calculate 50% of the lower wick of the first candle and 50% of the upper wick on the third candle.
#4 Finalize the IFVG Identification
The gap between the calculated levels (using the Fibonacci tool) is defined as the IFVG. This zone serves as a favorable area for price reversal and helps in identifying market movements.
In the instructional video by the ICT Gems channel on YouTube, the method of identifying and trading with IFVG on the chart is discussed in greater detail, which interested individuals can make use of.
In the XAU/USD price chart, after a rapid decline, a strong bullish candle with a large body formed on the one-hour timeframe. This candle was considered the middle candle of the IFVG structure and served as the first sign of buyers entering the market.
In the next step, the two adjacent candles were examined; the upper wick of the previous candle and the lower wick of the next candle almost covered the body of the middle bullish candle. Therefore, no gap was visible at first, but the structure indicated a hidden price imbalance zone (IFVG).
To precisely define the zone, the Fibonacci retracement tool can be applied to the wicks of the first and third candles:
- The 50% level of the upper wick of the first candle was calculated;
- The 50% level of the lower wick of the third candle was also obtained.
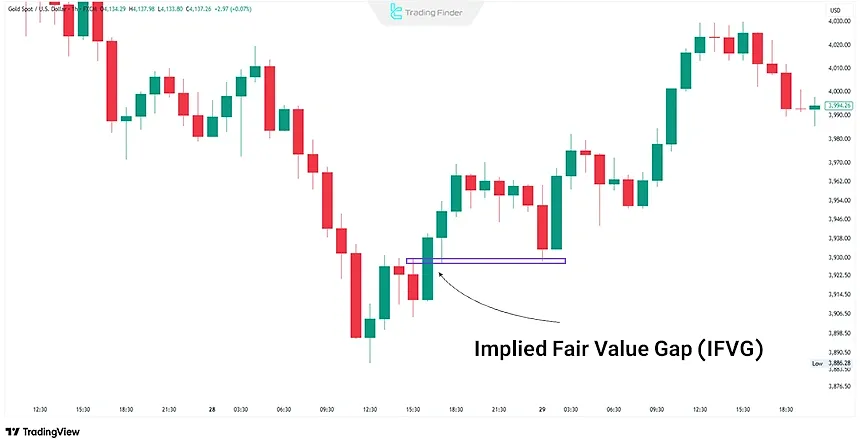
The distance between these two levels determined the IFVG zone. A few hours later, the price returned to this zone, absorbed sellers’ liquidity, and initiated a new bullish movement from the same area.
What is The Importance of IFVG in Trading?
The Implied Fair Value Gap (IFVG) has specific applications, including:
- Identifying hidden price adjustment zones that are not visible to most retail traders;
- Optimizing entry and exit points for trades;
- Enhancing the accuracy of trading strategies when combined with concepts like Order Blocksand market structure analysis.
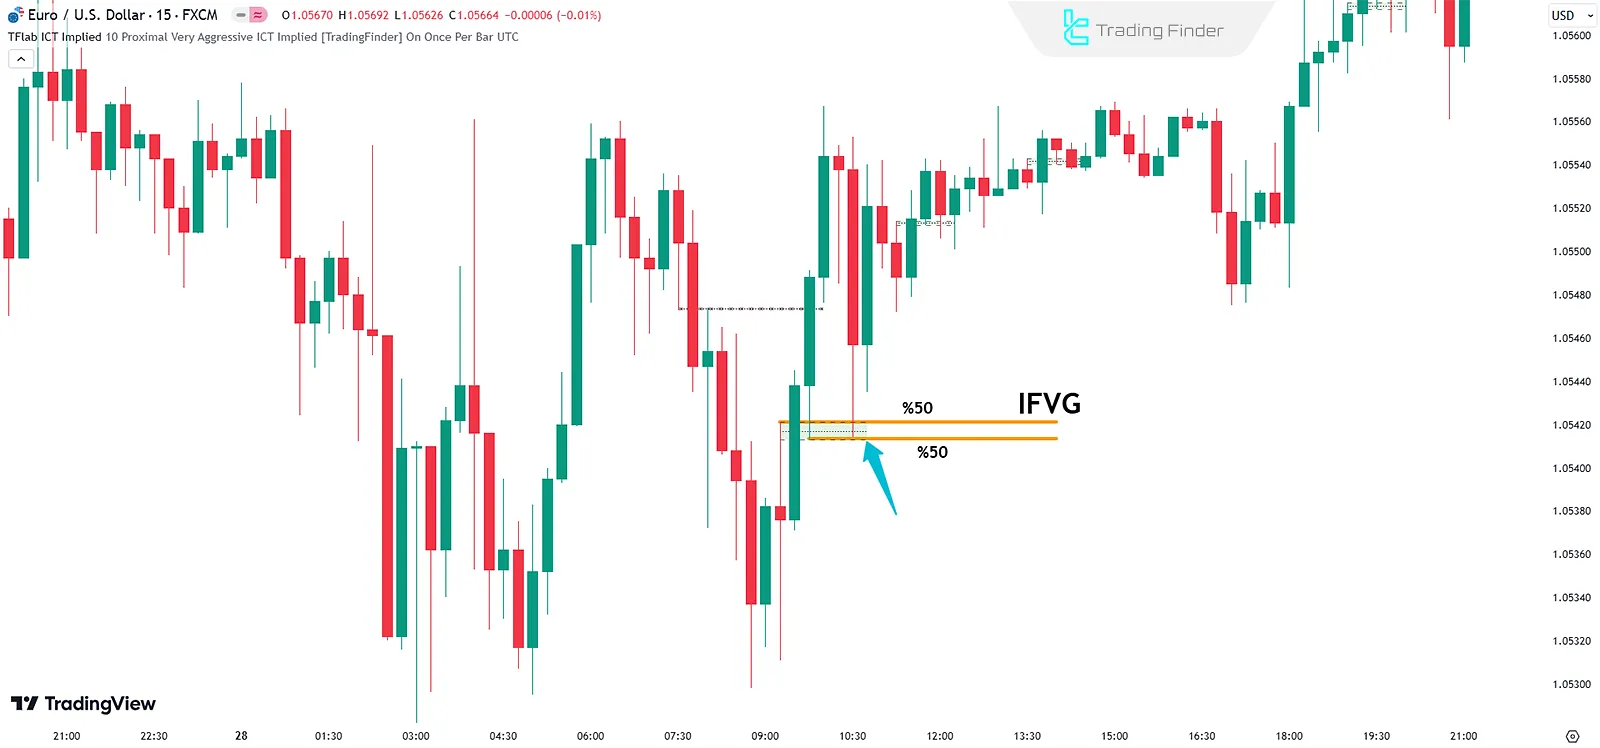
In the image below, another example of a bullish Optimized Fair Value Gap that has been filled with a price retracement can be seen.
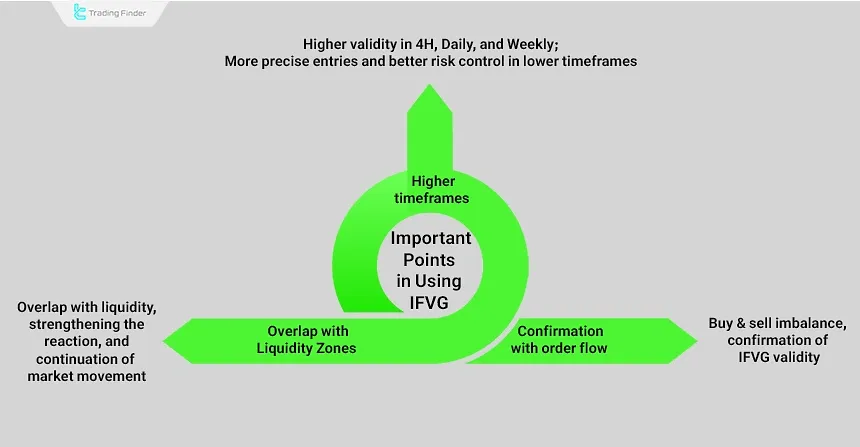
Important Points in Using IFVG
The strength of IFVG lies in its combination with timeframes, liquidity, and order flow, and for effective use of IFVG, observing the three principles below is essential:
- Higher timeframes: IFVG has greater validity in the 4H, Daily, and Weekly timeframes and reflects institutional order footprints; lower timeframes are used for more precise entries and risk control;
- Overlap with liquidity pools: The coincidence of IFVG with liquidity pools increases the likelihood of a stronger reaction and the continuation of movement in the dominant market direction; this condition often indicates the activation of smart liquidity;
- Confirmation with order flow: Examining order absorption or rejection and the imbalance between buying and selling volume (Delta Imbalance) can confirm the validity of the IFVG.
Indicator of Implied Fair Value Gap (Implied Fvg) in Metatrader
The Implied FVG indicator, or Hidden Fair Value Gap, is one of the precise tools within the ICT indicator set for MetaTrader, designed to identify invisible price gaps on the chart.
This indicator identifies a hidden Fair Value Gap by drawing two hypothetical lines at the 50% point of the wicks of adjacent candles, marking the zone between them. If the wicks of consecutive candles fully overlap, no such zone will form.
- Download the Implied Fair Value Gap Indicator for MT5
- Download the Implied Fair Value Gap Indicator for MT4
The main difference between Implied FVG and the standard FVG lies in the method of detecting the gap. In the classic model, a price gap is created when no movement occurs between the first and third candle; however, in the Implied version, only the gap covered by the wicks of adjacent candles is considered valid.
This distinction allows the indicator to identify more precise imbalance zones, which are commonly useful in liquidity analysis and price retracement scenarios.
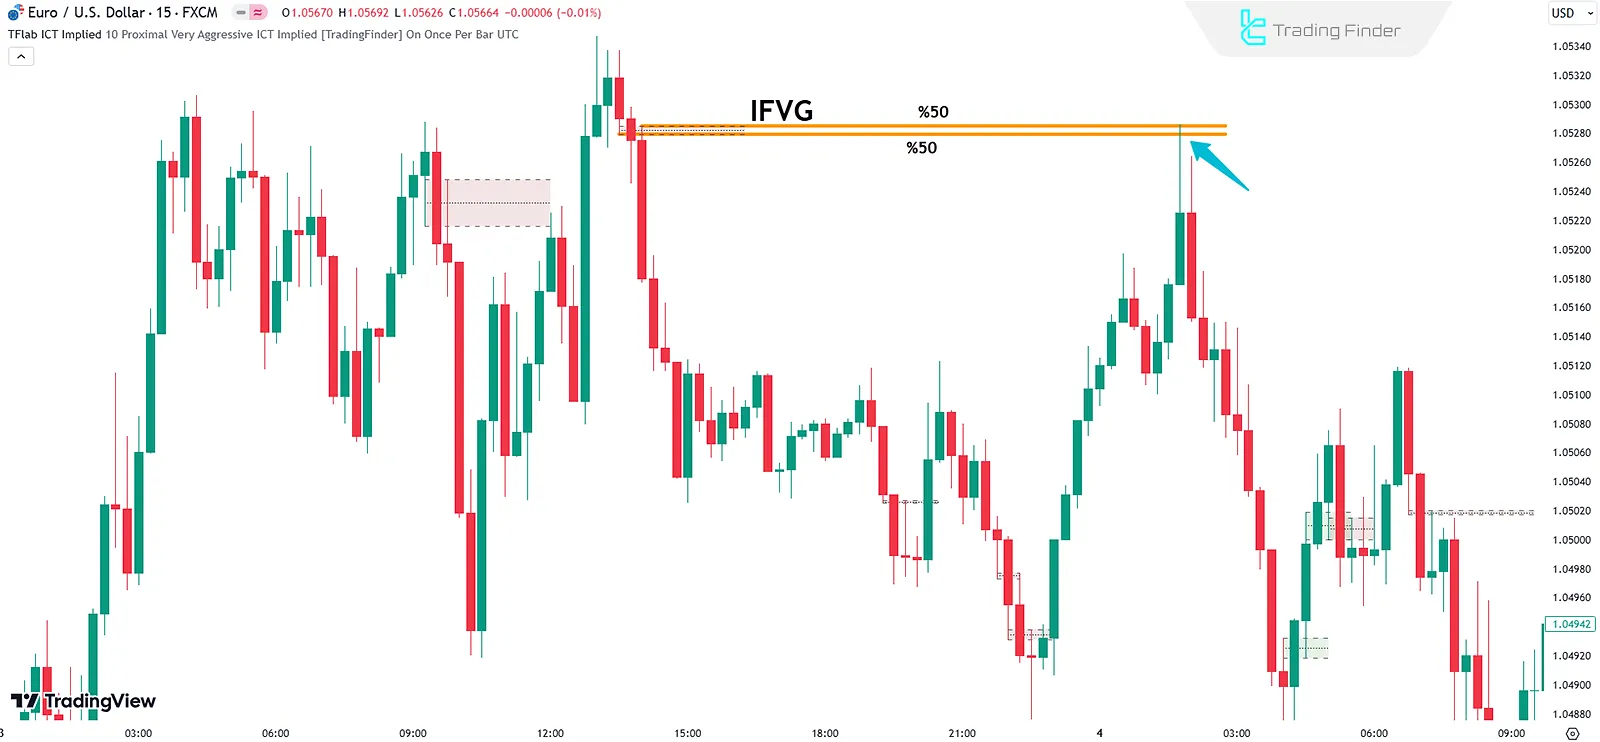
In a bullish scenario, such as the behavior of XAU/USD, it is often observed that whenever price returns to Implied FVG zones after an initial rally, a new bullish move begins following liquidity absorption within that area.
In other words, these zones act as market rest points or regions of renewed momentum and can serve as suitable areas for initiating buy trades.
In bearish conditions, similar to the behavior seen in currency pairs, when price returns to one of these gaps after an initial drop, the downward movement often resumes after collecting counter-orders. This reaction shows that Implied FVG can act as a reversal zone and serve as confirmation of trend direction.
The Implied FVG indicator is categorized under smart money and reversal tools in MetaTrader and is designed for professional traders in forex, crypto, stocks, and commodities. With a liquidity-based approach, it reveals hidden price zones and enables more precise decision-making in daily trading.
Conclusion
The ICT Implied Fair Value Gap (IFVG) is a concept within the ICT methodology that identifies hidden price imbalance areas.These zones are used as key points for trade entries and exits.
This type of fair value gap is identified by analyzing large candlesticks and observing the overlapping wicks of adjacent candles, offering an opportunity to capitalize on market structure changes.


