


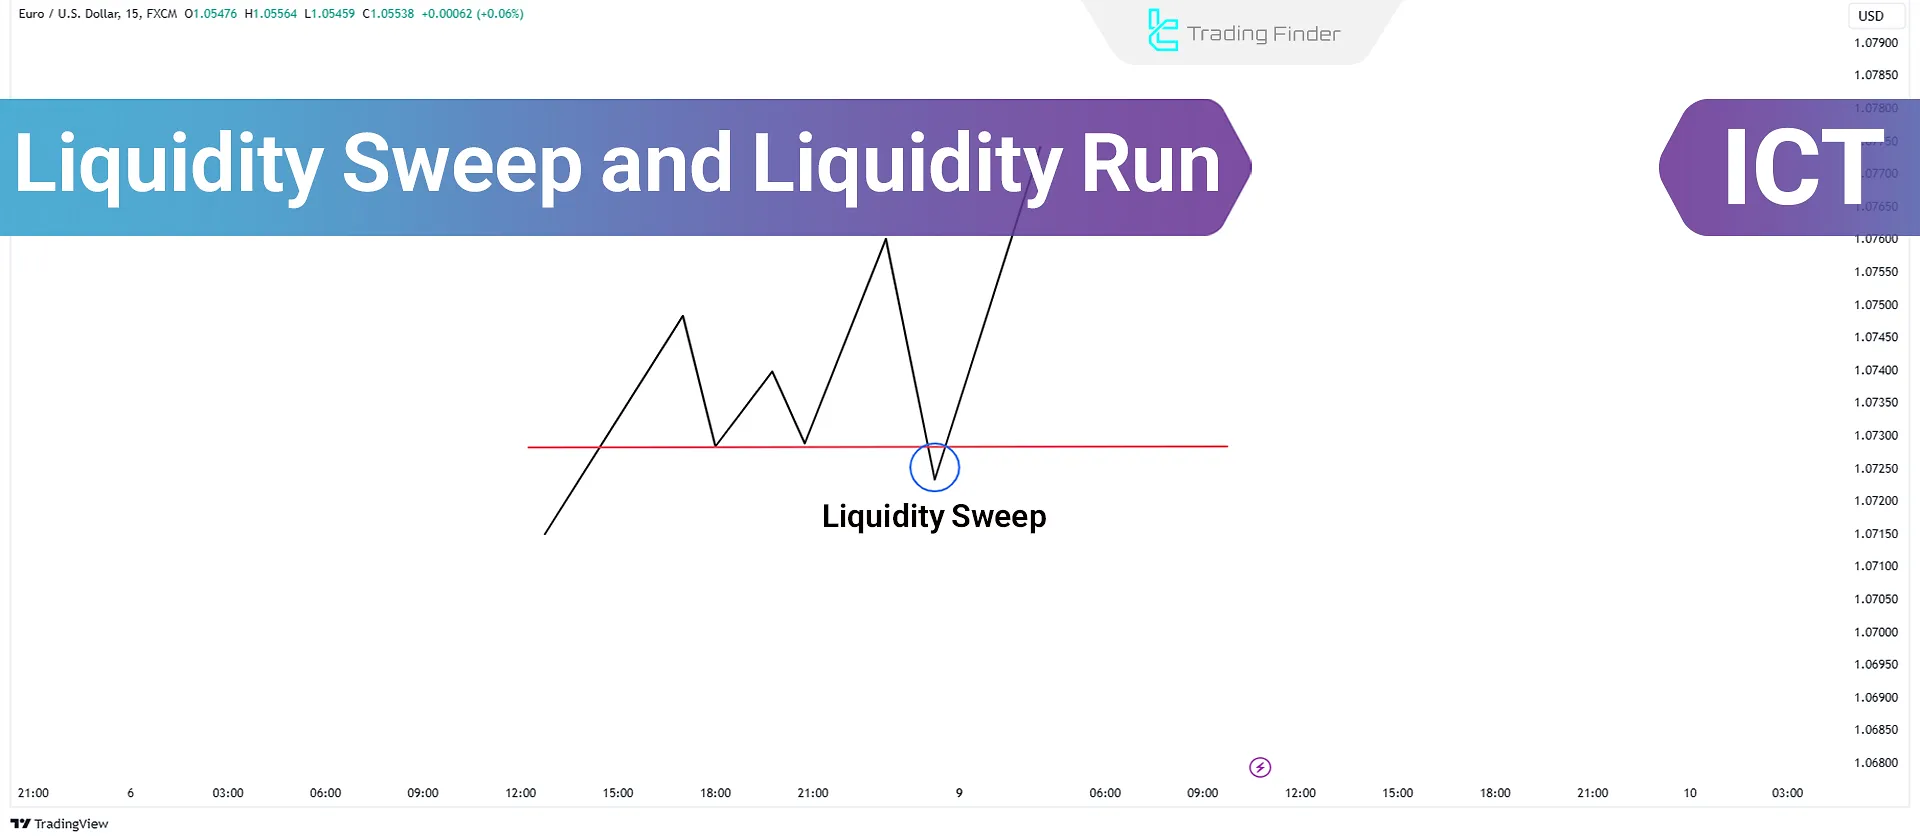
The liquidity sweep and run strategy in ICT style provides suitableentry and exit points by targeting liquidity at key levels and price reversal to the central zone.
This approach, by focusing on liquidity pools and price behavior around key highs and lows, enables accurate identification of false breakouts and valid continuation moves.
The combination of these two concepts provides a deeper understanding of liquidity cycles and their role in trend reversal or continuation.
A helpful guide on trading with ICT liquidity sweep vs liquidity run
What is Liquidity Sweep?
In the context of ICT, a liquidity sweep refers to a price movement aimed at attracting liquidity (including stop orders or pending orders). This typically occurs before a market trend reversal.
Liquidity collection training from the FXopen website:
The price may move towards lows and attract sell-side liquidity, but it may reverse without a sustained break below these lows.
Similarly, the price might move towards highs and attract buy-side liquidity but reverse without a sustained break above these highs.
How to Predict Liquidity Sweeps
To predict liquidity sweeps, pay attention to the specific factors and patterns in the market. These include:
- Identifying Key Areas: Equal highs and lows often fill with stop orders;
- Stop Order Examination: The market typically moves towards areas with significant buy or sell stop orders;
- Deceptive Price Movements: When the price nears an important level and quickly reverses, it might indicate a liquidity sweep;
- Trading Volume: A sudden increase in trading volume near key levels signals liquidity absorption;
- Candlestick Patterns: Look for reversal patterns such as pin bars or engulfing candles near liquidity levels;
- Post-Break Price Movement: A liquidity sweep is likely if the price breaks a critical level but fails to close above (bullish) or below (bearish);
- Market Behavior During Specific Times: Liquidity sweeps often occur during high-liquidity periods, such as London or New York market openings.
Educational video on liquidity grab and liquidity movement from the Trader Tips YouTube channel:
The Role of Premium and Discount in Identifying Valid Sweeps
In the ICT style, the validity of many sweeps is determined solely by examining their position relative to Premium and Discount zones. In each price cycle, the market forms a trading range.
The upper half of this range is considered Premium, and the lower half is considered Discount. This division determines where institutional entries are more likely to occur and in which area a sweep becomes meaningful.
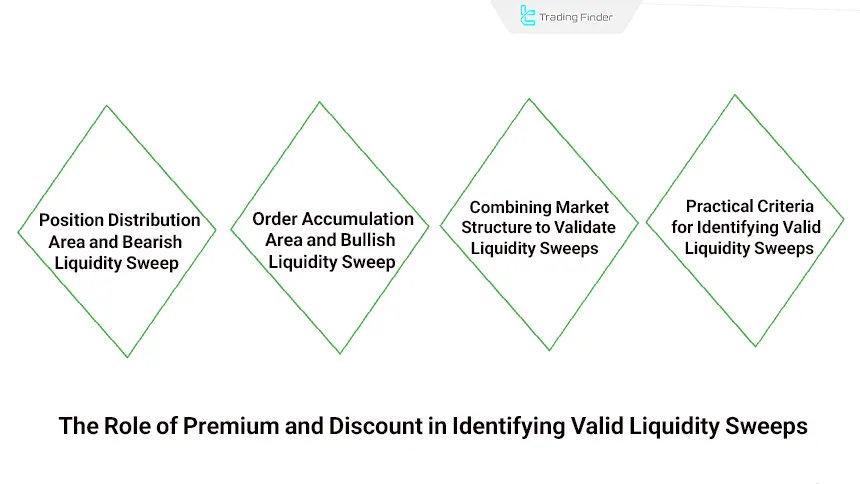
The Nature of Premium and the Area of Position Distribution and Bearish Sweep Formation
Premium is a zone where price is considered “expensive” for buying and “favorable” for selling. In this area, liquidity flow is often influenced by the following behavior:
- Liquidity collection above highs: the location of buyers’ stop-losses;
- Activation of Buy Stop orders: artificial increase in demand;
- Creation of favorable conditions for institutional selling: institutional entry at liquidity highs.
Premium sweeps are usually accompanied by the following characteristics:
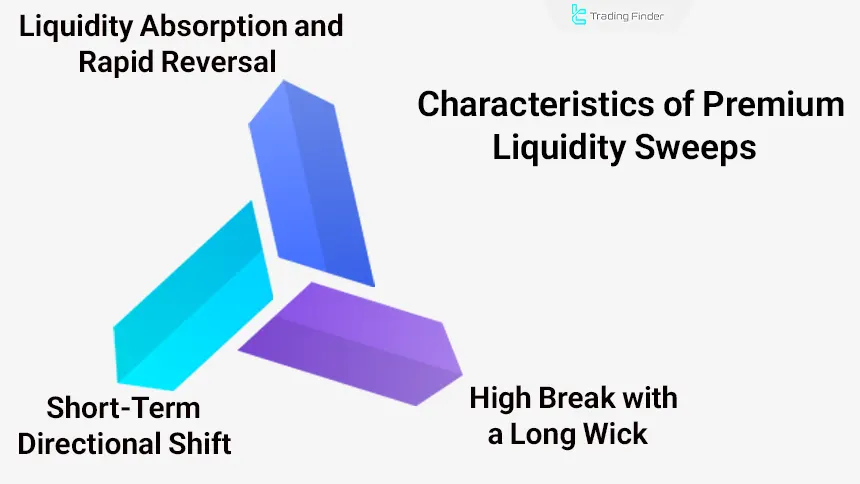
- Break of highs accompanied by long wicks
- Liquidity absorption and rapid reversal
- Short-term change in direction or the beginning of a deep correction
These sweeps play a “distribution” role and are often a prelude to a bearish move.
The Nature of Discount and the Area of Order Accumulation and Bullish Sweep Formation
Discount is a zone where price is considered “cheap” for buying. In this area, the decline of price toward lows is usually intentional, because:
- Buyers’ stop losses are located below lows: selling liquidity is provided;
- Activation of Sell Stops: selling pressure is strengthened;
- Completion of buy orders by major players: institutional entry at liquidity lows.
Discount sweeps have the following signs:
- Penetration below lows accompanied by a rapid reaction;
- Strong-bodied reversal candle;
- Price returning to the main valuation area.
These sweeps play an “accumulation” role and are considered the starting point of bullish moves.
Combining Premium/Discount with Market Structure to Validate Sweeps
A valid sweep forms when its location aligns with market structure. This alignment between structure and valuation reduces the probability of error. This alignment between structure and valuation reduces the probability of error.
- In an uptrend, a valid sweep usually occurs in “Discount” after liquidity has been collected from lows;
- In a downtrend, a reliable sweep forms in “Premium” after liquidity is hunted from highs;
- In tight ranges, a sweep in the half opposite to the expected move is more reliable.
Practical Criteria for Identifying a Valid Sweep in Premium or Discount
To confirm a sweep, several factors must be observed simultaneously. The combination of these factors indicates the presence of institutional orders and a valid sweep. The main criteria for identifying a valid sweep in Premium and Discount are:
- Price position relative to the midpoint of the range
- Presence of significant liquidity (Equal Highs / Equal Lows)
- Fast candlestick reaction
- Liquidity movement in the opposite direction of the initial move
- Price returning to the valuation area
Analytical Conclusion
Premium and Discount are not merely valuation tools; they are filters for identifying valid sweeps. A sweep without considering its position within these two zones is meaningless. A sweep in Premium is often a sign of order distribution and readiness for a bearish move.
A sweep in Discount usually indicates position accumulation and sets the stage for a bullish move. Therefore, analyzing price position relative to these two zones is an essential component in identifying institutional bias and sweep quality.
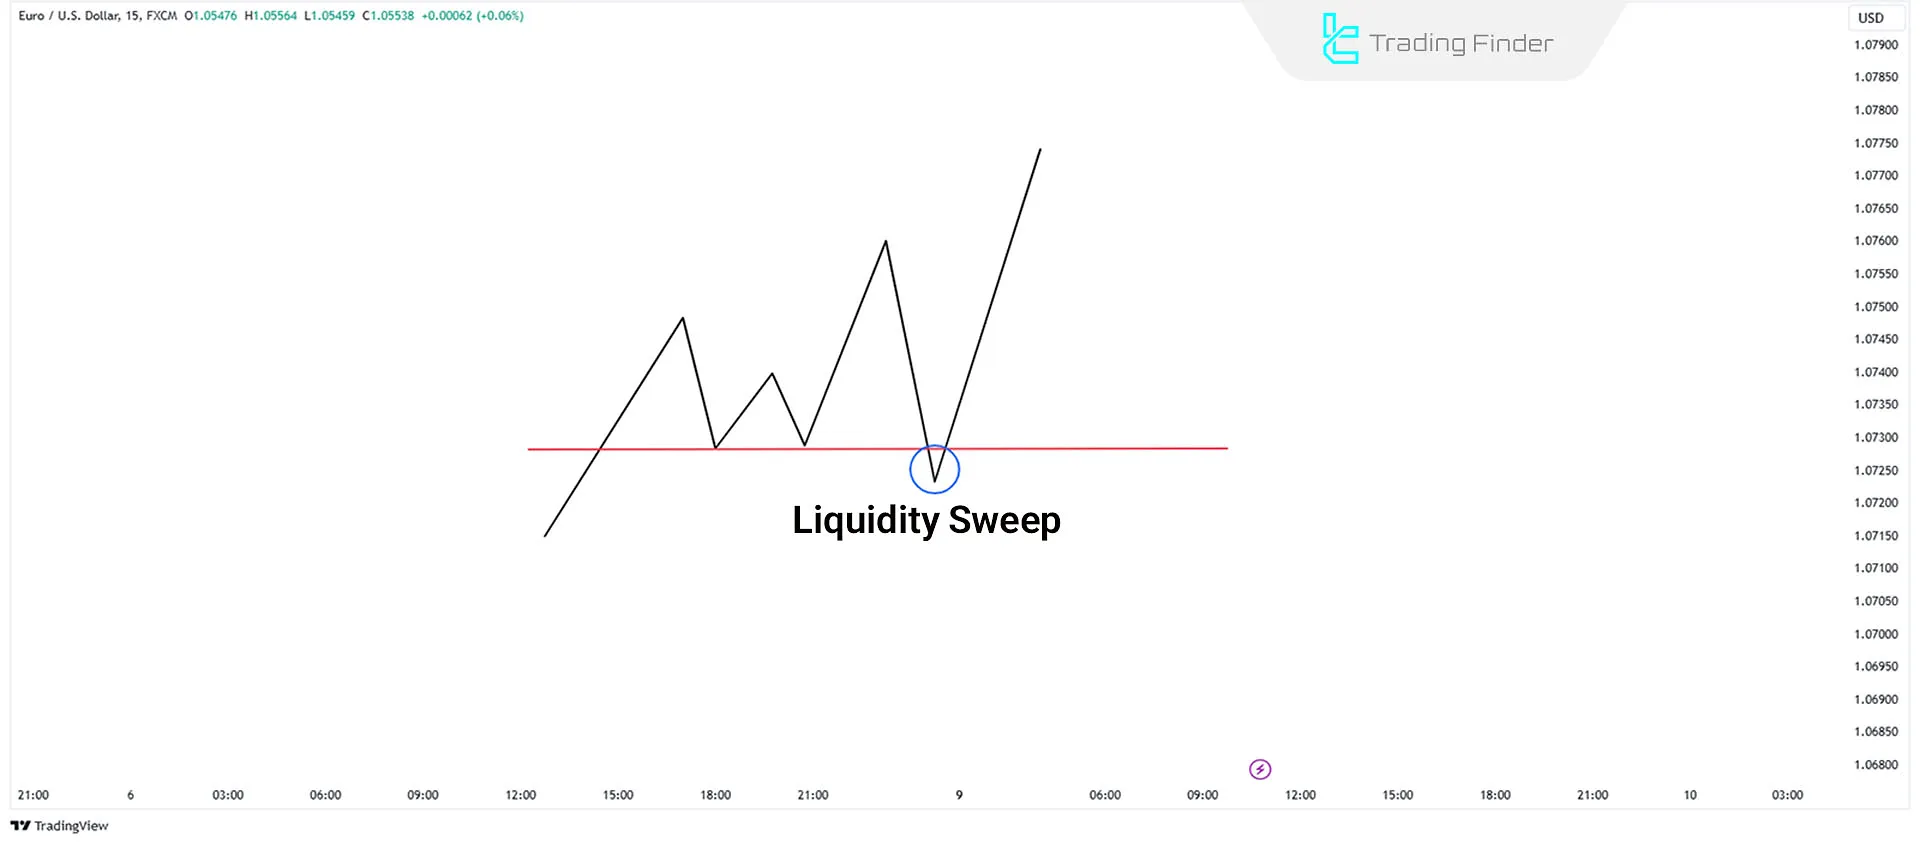
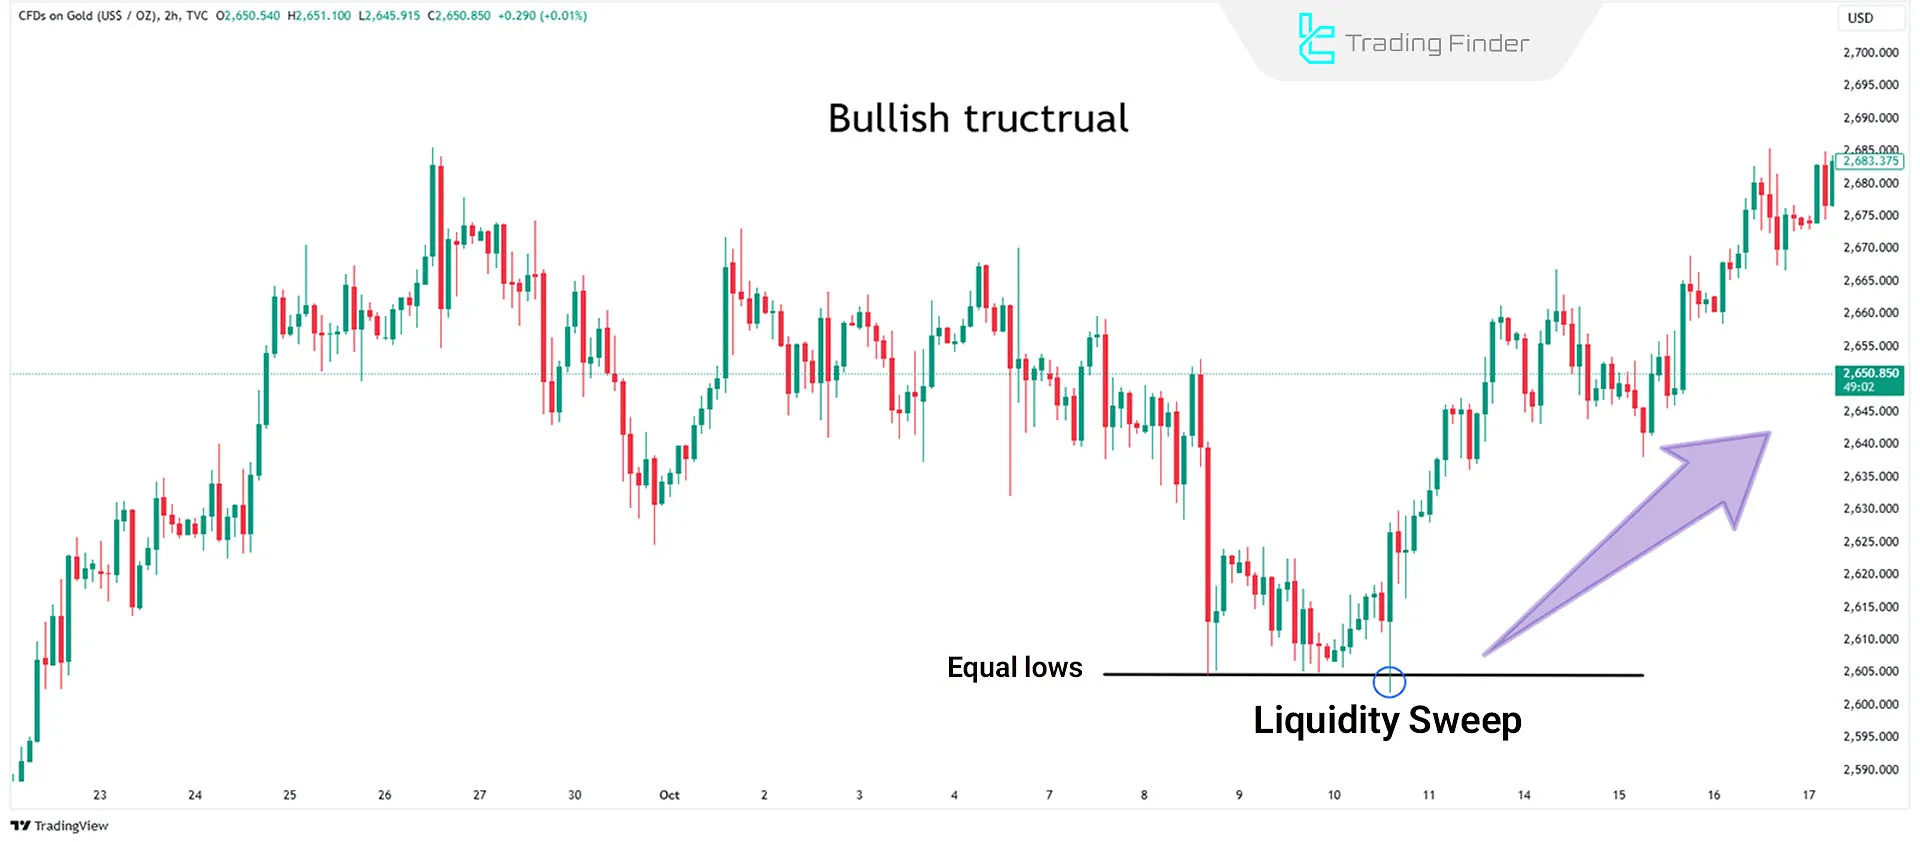
Example of buy trades during liquidity collection
If the market structure is bullish and equal lows form, a break below these lows followed by a rapid upward reversal can be an opportunity to enter a long trade.
The XAU/USD chart in the 2-hour timeframe demonstrates an uptrend in a liquidity sweep style.
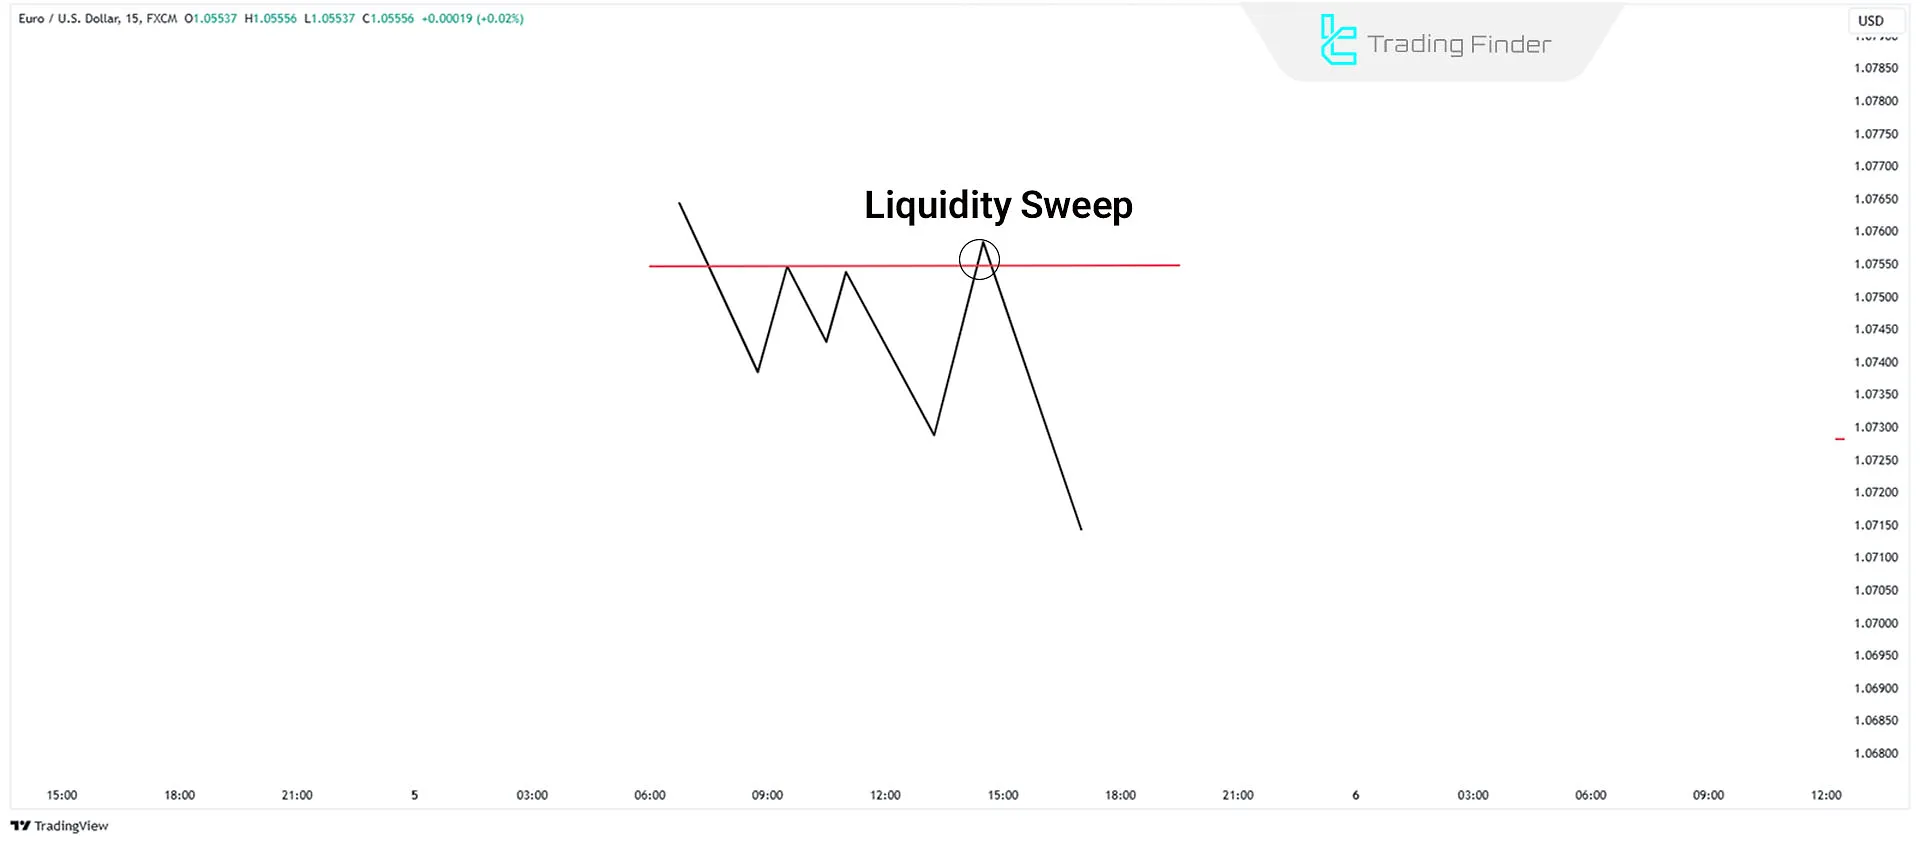
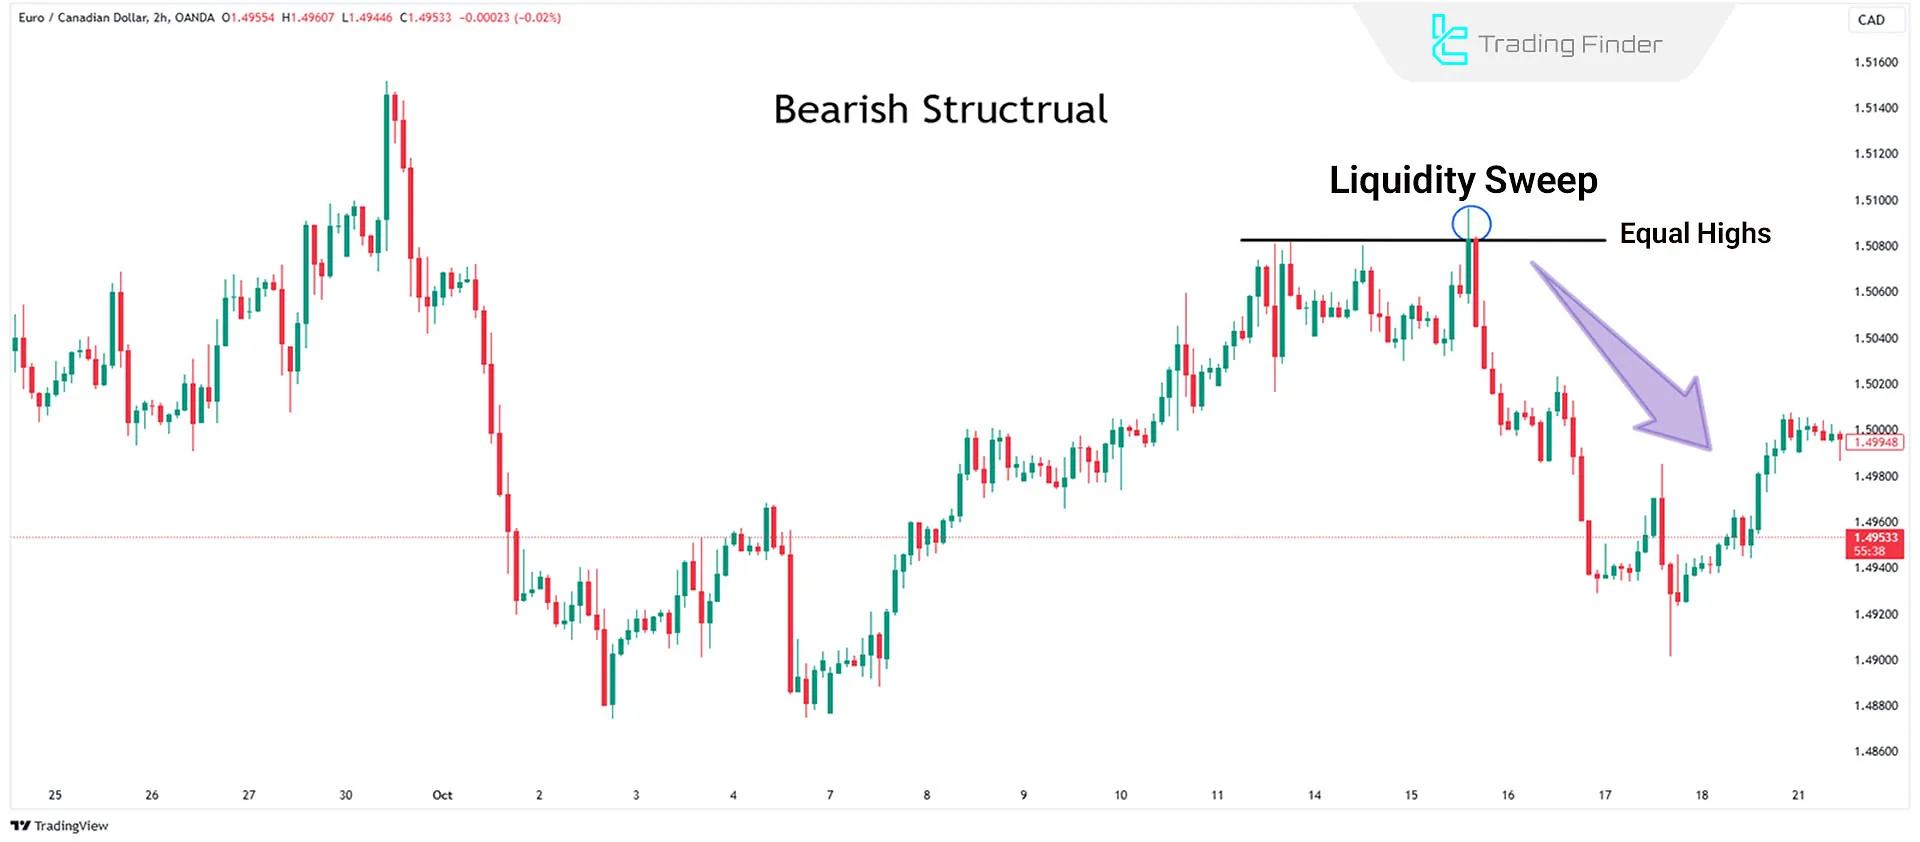
Example of sell trades during liquidity collection
If the market structure is bearish and equal highs form, a break above these highs followed by a rapid downward reversal can be an opportunity to enter a short trade.
The EUR/USD chart in the 2-hour timeframe demonstrates a downtrend in a liquidity sweep style.
The Role of Internal Market Structure (Internal Range Liquidity) in Sweep Formation
Internal Range Liquidity consists of a series of highs, lows, and micro-structures that form during short-term fluctuations and act as the primary source of stop collection prior to a sweep.
The market usually consumes this minor liquidity first in order to create sufficient space for the entry of large orders. It then moves toward more significant structural liquidity outside the range, and after absorbing it, signals a new direction with a strong displacement.
A valid sweep forms when both internal and external liquidity have been consumed; therefore, precise analysis of price behavior within the range determines the quality and probability of a sweep.
What is Liquidity Run?
A liquidity run occurs when the price moves in the primary trend direction, targets liquidity in forex and continues without reversal.
In a bullish market, the price targets the previoushigh, absorbs liquidity, and creates a new high. This phenomenon is called Break of Structure.
In a bearish market, the price targets the previous low, absorbs liquidity, and creates a new low.
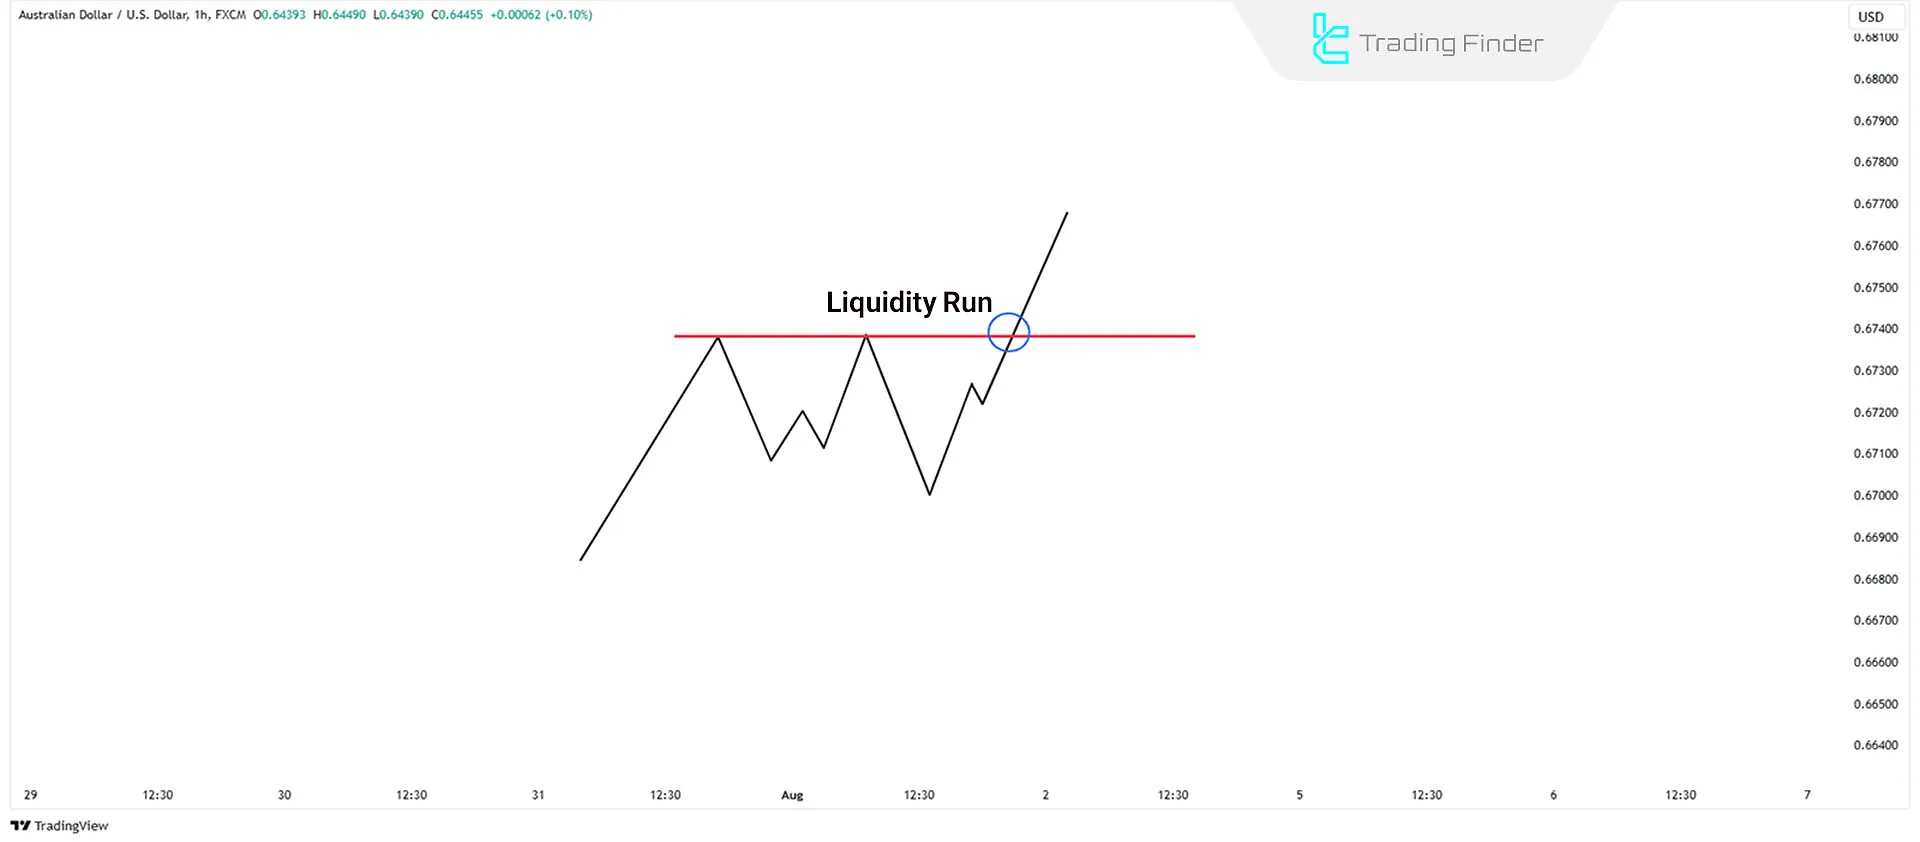
Buy Trades in Liquidity Runs
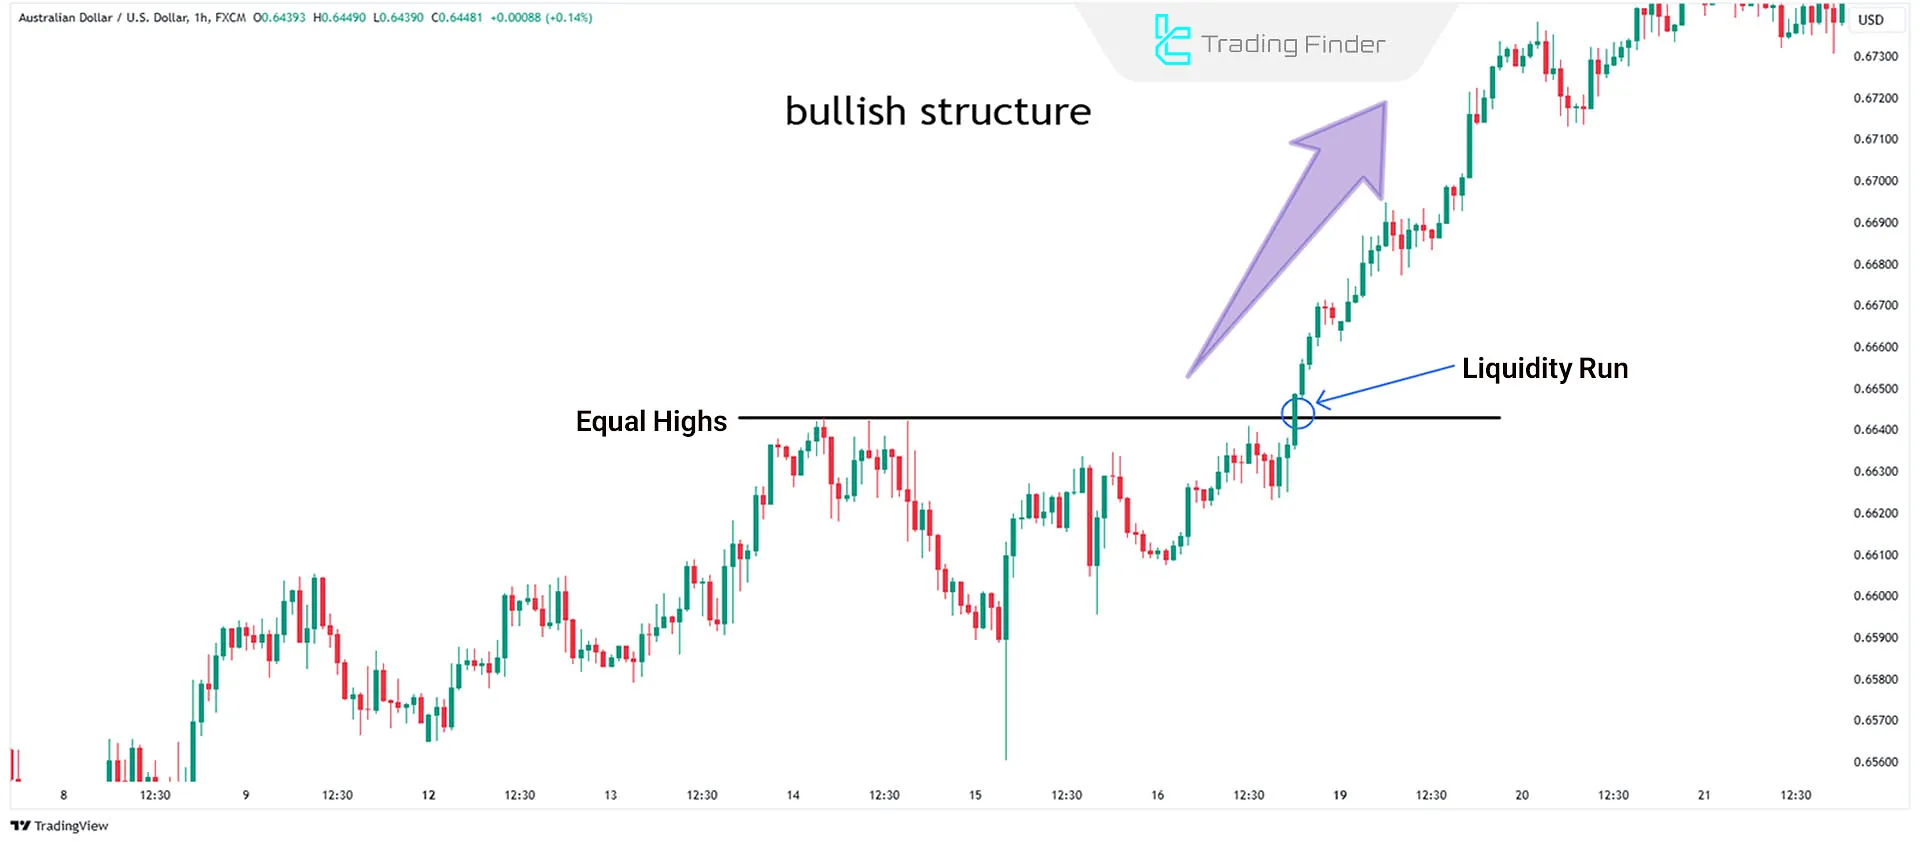
If the market is bullish and equal highs form, the price may reach the previous high, absorb its liquidity, and continue the uptrend to create a new high.
This presents a long trade opportunity. The AUD/USD chart in the 1-hour timeframe demonstrates an uptrend in a liquidity run style.
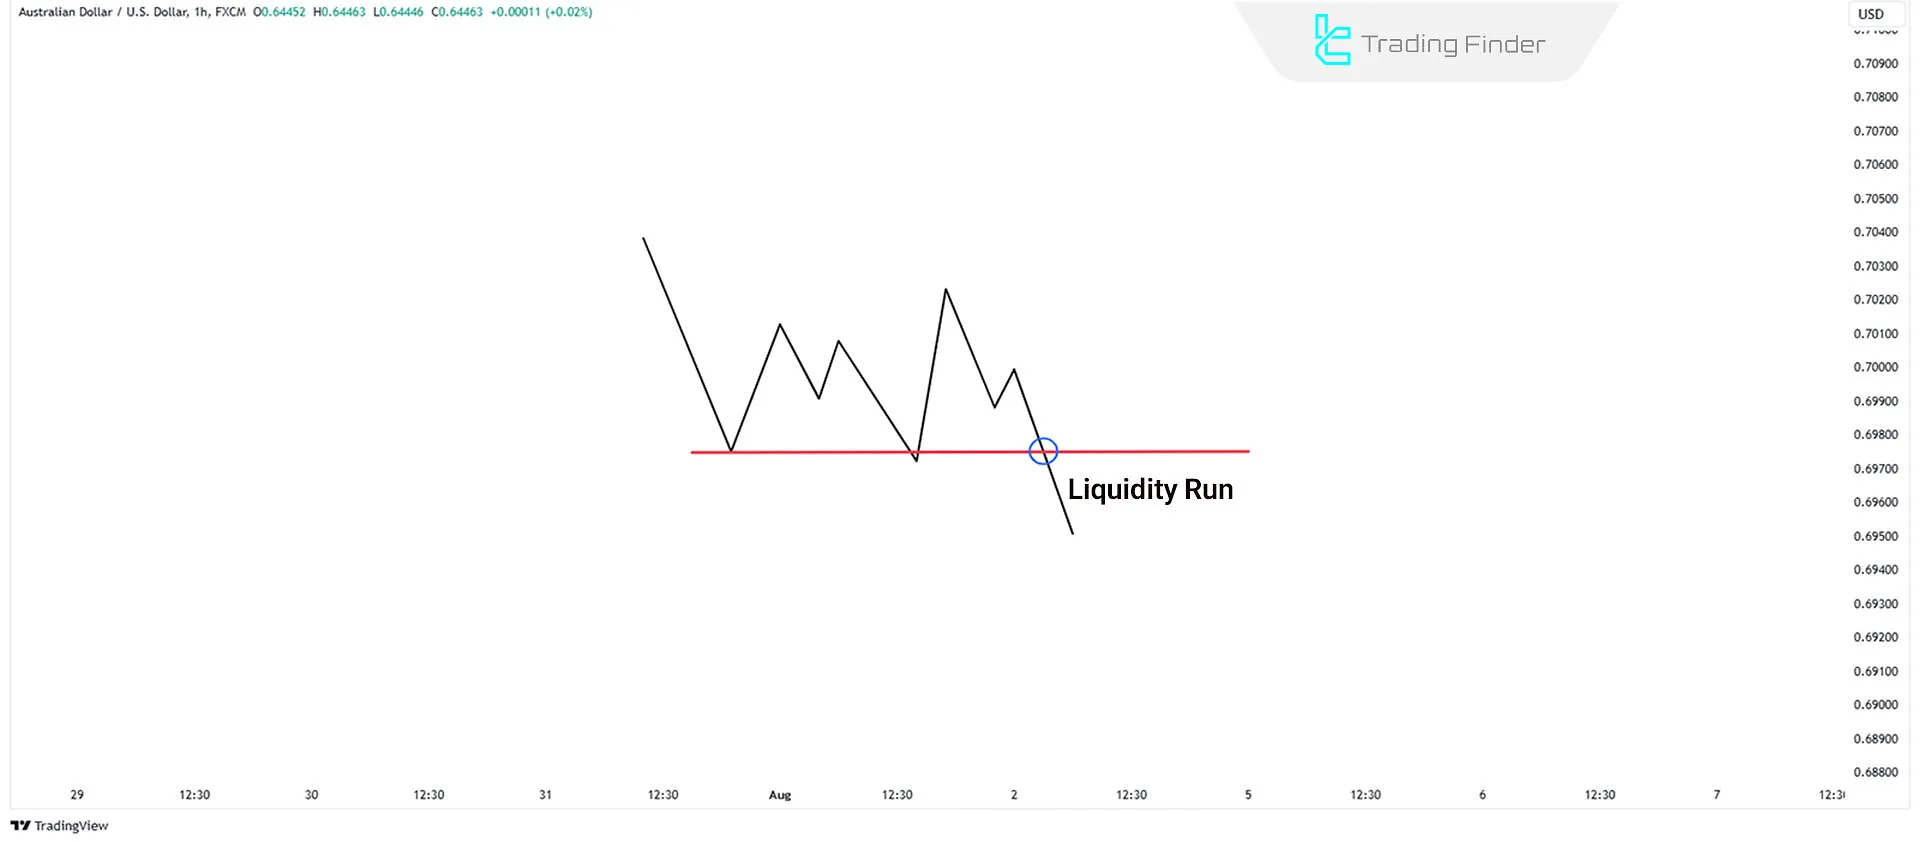
Sell Trades in Liquidity Runs
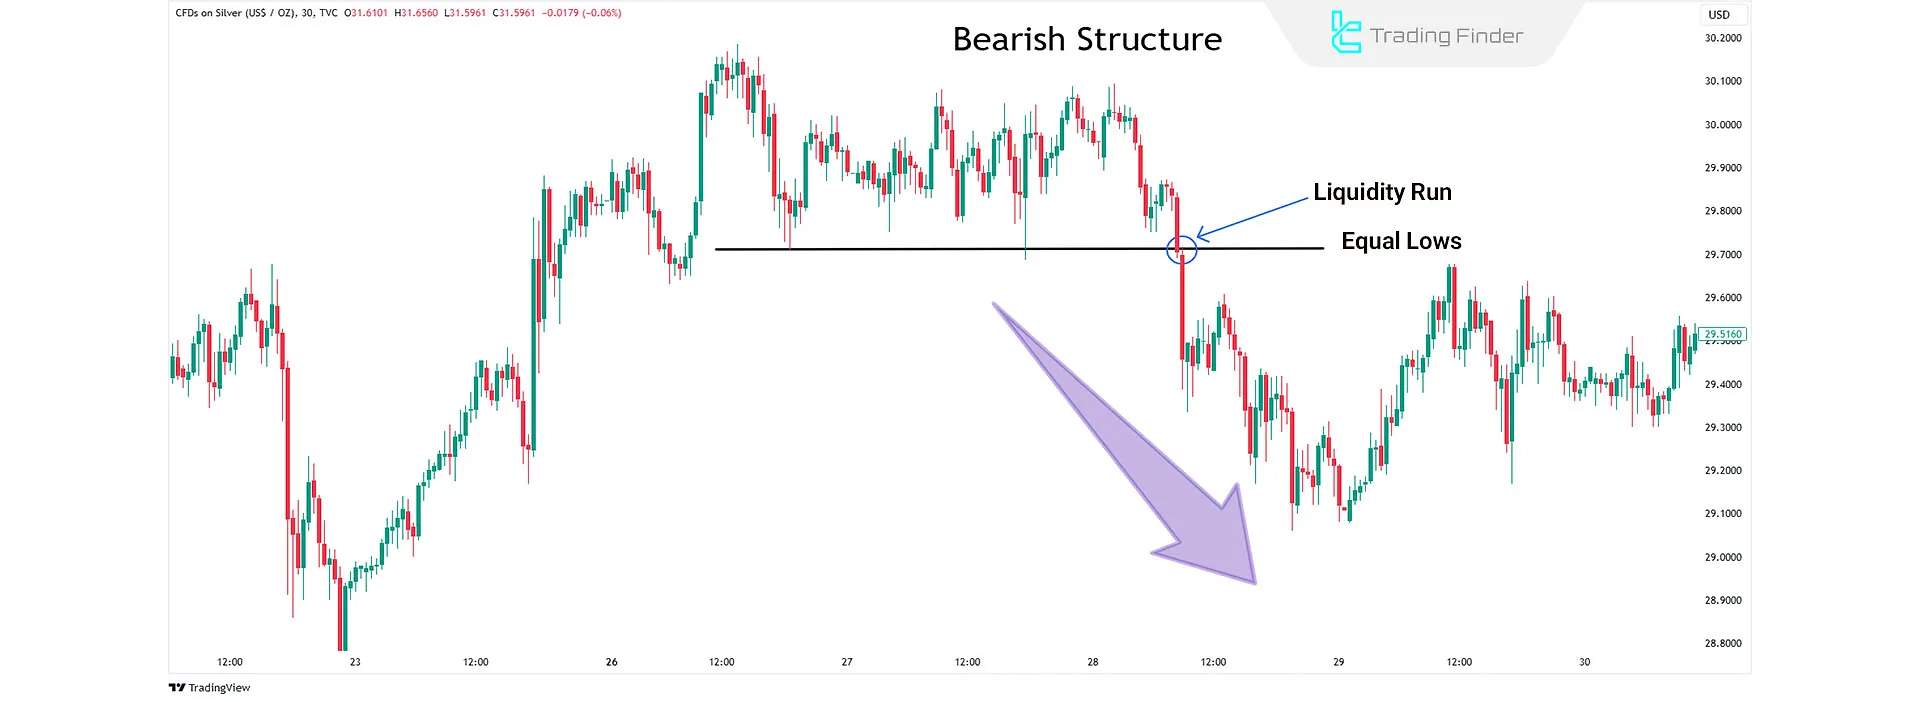
If the market structure is bearish and equal lows form, the price may reach the previous low, absorb its liquidity, and continue the downtrend to create a new low.
This presents a short trade opportunity. The XAG/USD chart in the 30-minute timeframe demonstrates a downtrend in a liquidity run style.
Difference Between Liquidity Sweep and Liquidity Run
The table below shows the differences between Liquidity Run and Liquidity Sweep:
Criterion | Liquidity Sweep | Liquidity Run |
Price Movement Goal | Attracts liquidity and reverses direction | Attracts liquidity and continues in the trend direction |
Market Structure | Can occur in both bullish and bearish trends | Typically occurs during trend continuation |
Price Movement Post-Event | Reverses direction post liquidity absorption | Continues moving in the same direction |
Indicators | Sharp, short-term price changes near liquidity zones | Gradual and consistent movements in trend direction |
Trading Strategy | Enter counter-trend trades (e.g., buy near lows after a sweep) | Enter trend-following trades (e.g., buy after a breakout) |
Liquidity Collection Scanner Indicator
The liquidity collection scanner is an advanced analytical tool based on identifying the “Liquidity Sweep” process and analyzing price behavior around structural areas.
By analyzing valid highs and lows and identifying points where pending orders and traders’ stop-losses are concentrated, this scanner aims to highlight zones where the probability of a reversal or continuation move is high.
The core nature of the tool focuses on liquidity depletion and filtering false breakouts; therefore, a significant portion of market noise is removed, providing the user with clearer output.
The scanner’s functionality is built on three main components: identifying key swings, defining the reaction zone, and evaluating price movement beyond the swing level.
First, swing points are identified-levels that typically contain the stop-losses of many traders and act as the primary source of liquidity. Next, a zone is defined between the swing point and the lowest or highest open or close price of the candle.
This zone usually represents the market’s first attempt to stabilize after the initial break, and price behavior within it serves as the main clue for distinguishing a sweep from a genuine breakout.
In the next stage, price reaction to this zone is evaluated. If the break of the swing level is merely for liquidity absorption and price fails to hold above the level, the probability of a reversal increases. Educational videos on using the liquidity scanner:
The presence of a confirmation candle with a small body or a weak continuation pattern indicates weakness on the dominant side and generates an entry signal.
The scanner’s output is typically presented in the form of visual markers along with a table displaying the real-time status of symbols. This table includes trend direction, percentage change, timeframe, and the time of the last signal.
The tool’s settings allow full control over market structure periods, the distance between the swing and the signal, and the method of identifying reversals. Users can also customize the number of monitored symbols, table display style, and alert patterns.
Overall, by combining market structure, liquidity, and candlestick behavior, this scanner extracts low-risk entry zones and optimizes the trader’s decision-making process. Download link for the Liquidity Collection Scanner Indicator:
Conclusion
The concepts of Liquidity Sweep and Liquidity Run in ICT style and Smart Money are crucial for understanding liquidity behavior.
These concepts are demonstrated differently depending on market conditions and the type of trend (bullish or bearish). Combining these two strategies can help identify optimal entry and exit points.
This combination provides a clearer picture of the intent and directional bias of major market participants. It also significantly increases the probability of successful trading decisions by reducing errors in identifying false breakouts.


