


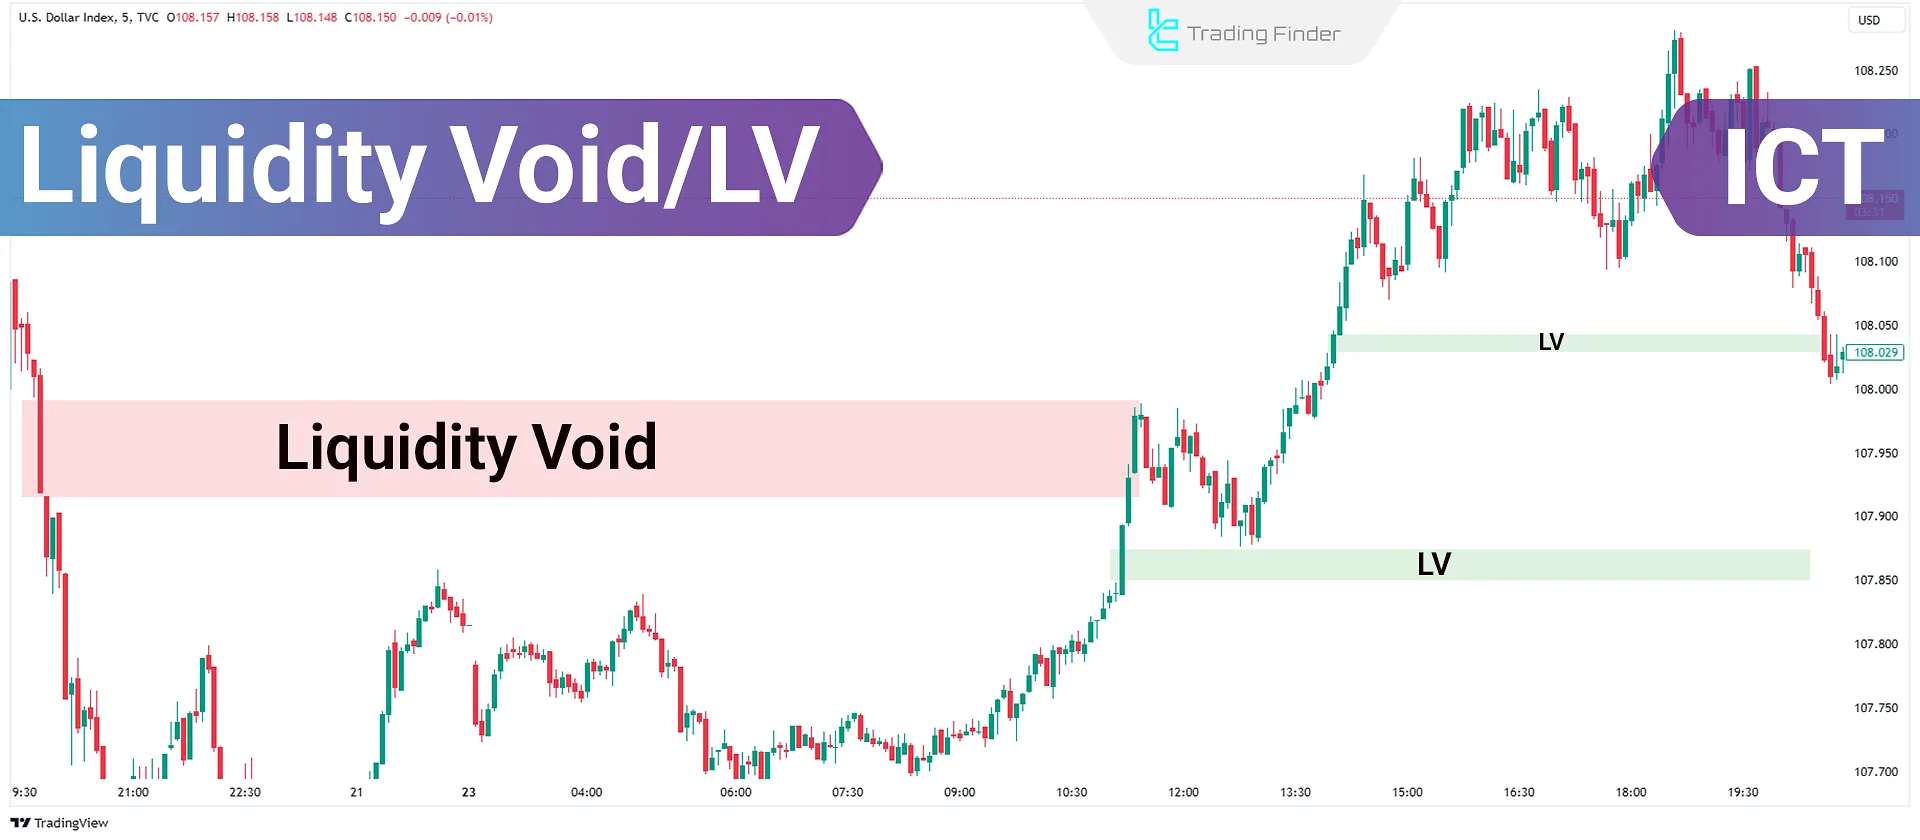
Liquidity Void (LV) refers to a situation where there are insufficient orders to fill a rapid price movement within a specific timeframe. This phenomenon is often considered an indication of strong market movements and a lack of sufficient buyer or seller participation in that area.
In such conditions, price moves without forming an intermediate retracement and leaves behind clear evidence of a strong imbalance in order flow. This area is often later identified as a price return zone, as the market tends to revisit levels it moved through rapidly in order to restore balance.
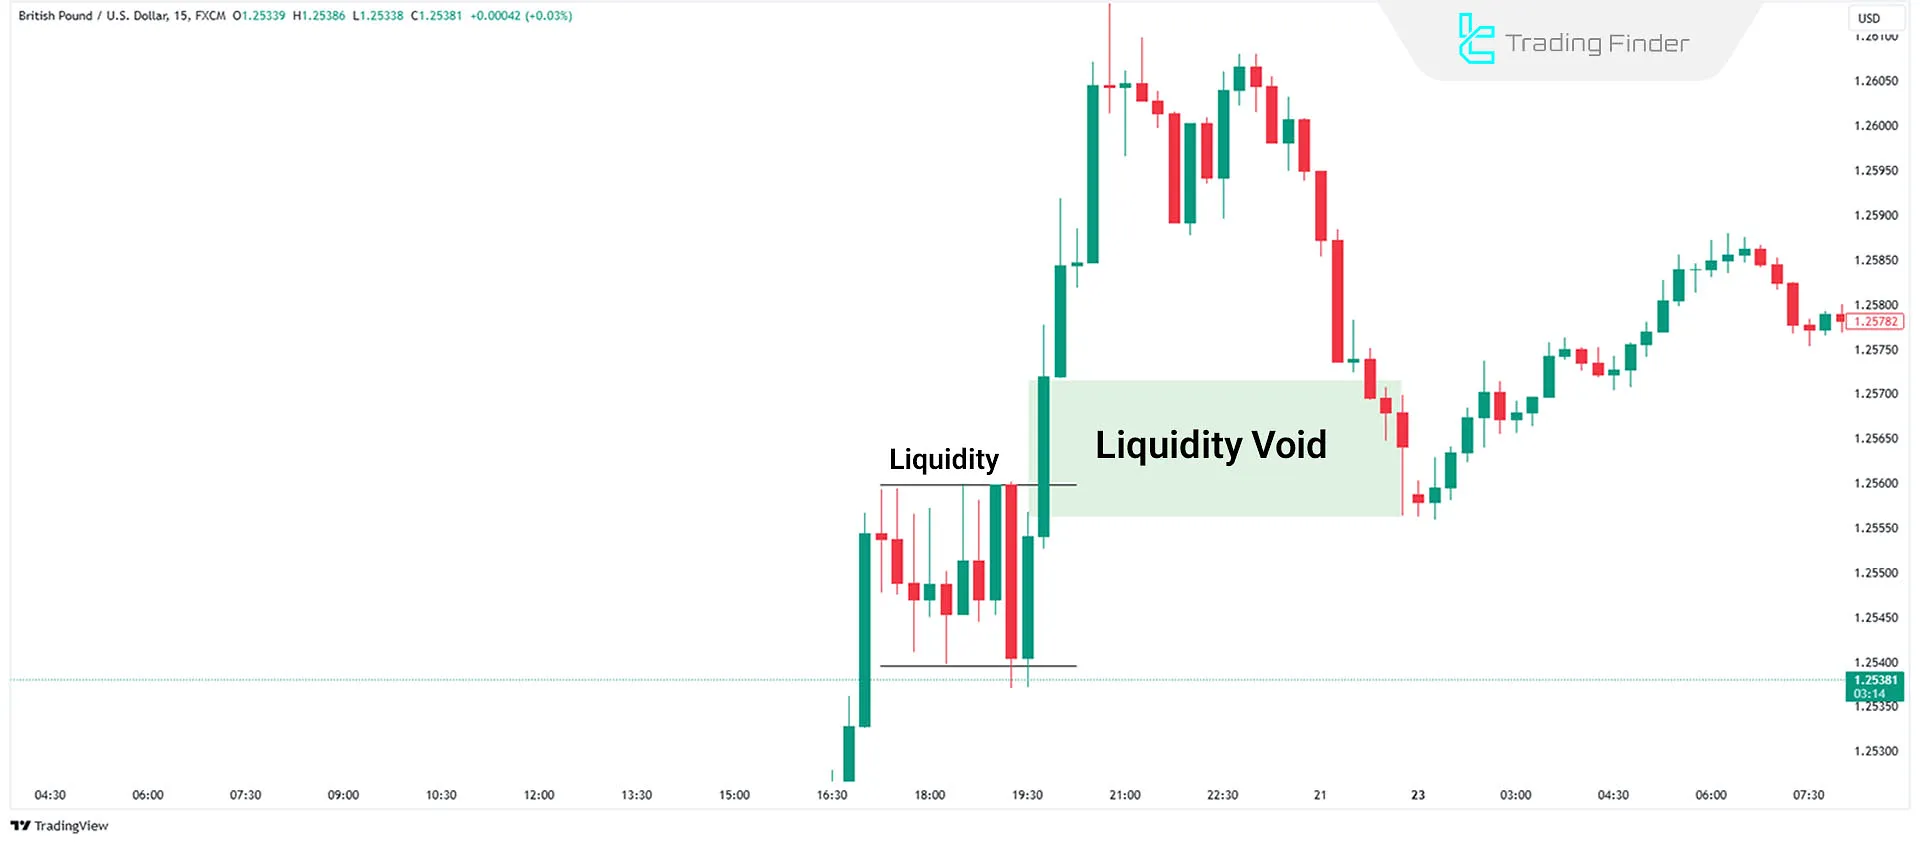
What is Liquidity Void in Forex Trading?
In financial markets, "liquidity" means the presence of active buyers or sellers, and "void" means the absence or lack thereof.
Liquidity void in the ICT style occurs when the price breaks out of a consolidation phase and moves aggressively in one direction without returning or forming shadows in the previous candles' range. This imbalance between buyers and sellers is known as the ICT liquidity void.
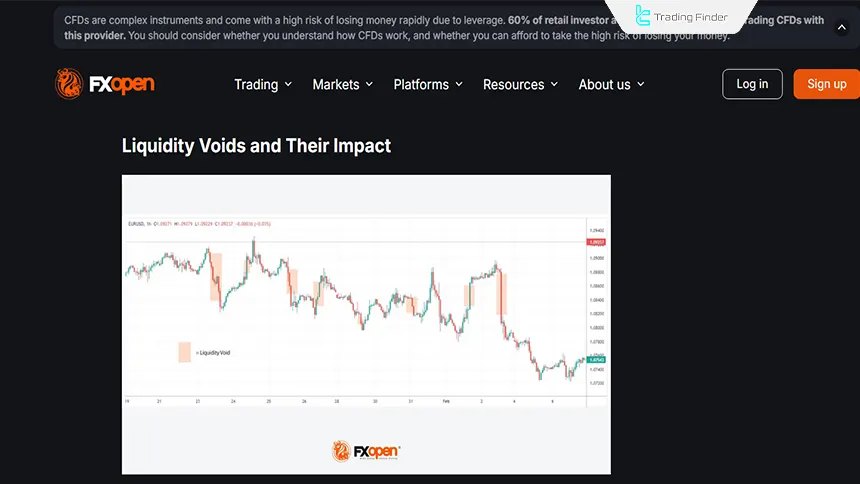
Training on using liquidity voids from the FXOpen website:
Advantages and Disadvantages of Liquidity Voids
A liquidity void is one of the key structures in smart money analysis that can both create trading opportunities and involve significant risk.
Examining the advantages and disadvantages of this pattern allows traders to gain a more precise understanding of price behavior in imbalance zones. The table of advantages and disadvantages of liquidity voids:
Advantages | Disadvantages |
Rapid identification of price imbalance zones and the ability to accurately analyze smart money behavior | The possibility that price does not return to the void and the gap remains unfilled for a long period |
Providing low-risk trading opportunities after price returns to the CE area or the midpoint of the void | Risk of premature entry if market structure confirmation is missing or an invalid MSS forms |
Indicates institutional volume-driven moves and the strength of order flow in one direction | Higher risk in highly volatile markets with low-quality voids |
Helps identify the price delivery path and the market’s next targets | Requires high experience to distinguish a valid void from ordinary FVGs |
Compatibility with ICT strategies such as FVG, Order Block, CHoCH, and MSS | In ranging or low-volume markets, voids quickly become invalid or generate false signals |
Applicable on higher timeframes for analyzing long-term liquidity flow | Ineffectiveness of small voids on lower timeframes due to heavy candle noise |
Key Characteristics of a Liquidity Void
A liquidity void is an area where price moves rapidly without creating balance between buy and sell orders. Educational video on using liquidity voids from the Fortune Talks YouTube channel:
This phenomenon usually occurs after the entry of heavy institutional order volume or a rapid price departure from a consolidation range. The most important characteristics of a liquidity void include:
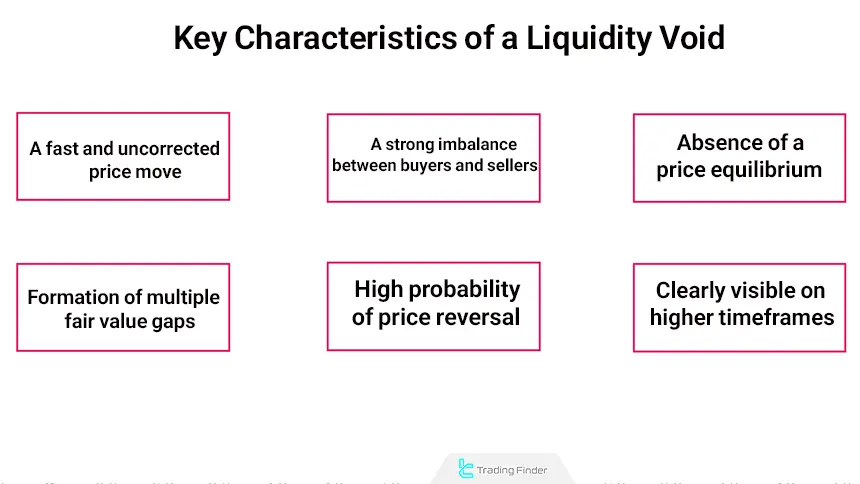
Fast and Uncorrected Price Movement
In a liquidity void, candles are usually formed with long bodies and without intermediate retracements. The lack of trading reactions within these candles indicates insufficient liquidity in the market.
This type of movement typically signals the involvement of large institutional orders that do not allow any form of retracement or price testing to develop.
Severe Imbalance Between Buyers and Sellers
In this situation, one side of the market (buyers or sellers) completely dominates the order flow. The result of this imbalance is a strong price movement in one direction without significant resistance.
This condition indicates that the market is in the process of “price delivery” toward the next liquidity pool and that the power-move phase has been activated.
Absence of a Price Equilibrium
In a normal move, price retraces part of the path; however, in an LV no retracement occurs along the way. This feature shows that the market did not have the opportunity to rebalance or fill resting orders.
The lack of a return to the mean indicates rapid price transfer within an imbalanced structure and is usually later compensated by a deep correction.
Formation of Multiple Fair Value Gaps
Each liquidity void usually contains several consecutive FVGs. This indicates that a large volume-driven move has created multiple imbalance zones in succession.
The presence of these sequential FVGs confirms that the order flow was heavy and continuous, and that the market was influenced by a one-sided institutional move.
High Probability of Price Returning to Fill the Liquidity Void
Although a full fill of the void is not guaranteed, the market usually returns at least to its midpoint. This return is recognized as the market’s attempt to restore balance in traded volume and is often the best area for identifying entry setups.
Clearly Visible on Higher Timeframes
On higher timeframes such as H1, H4, and Daily, liquidity voids are more clearly visible and gain greater validity. This high clarity indicates that the formation of the void was driven by heavy institutional orders and decision-making rather than retail trader behavior.
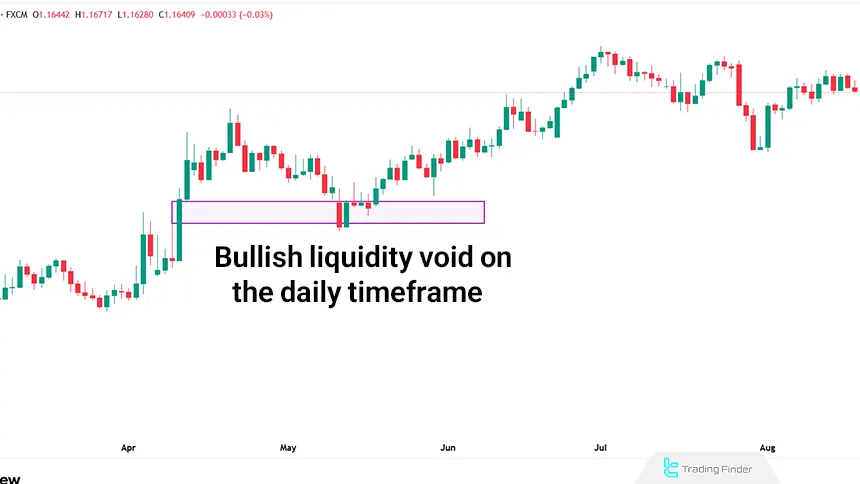
How to Trade Liquidity Void in Bullish Market
A bullish liquidity void occurs when the price breaks out of a consolidation range (a narrow price fluctuation zone) and moves strongly upward, absorbing sell-side liquidity.
Insufficient sell-side liquidity causes the price to surge upward and creates an imbalance in the market, which is called a "bullish liquidity void."
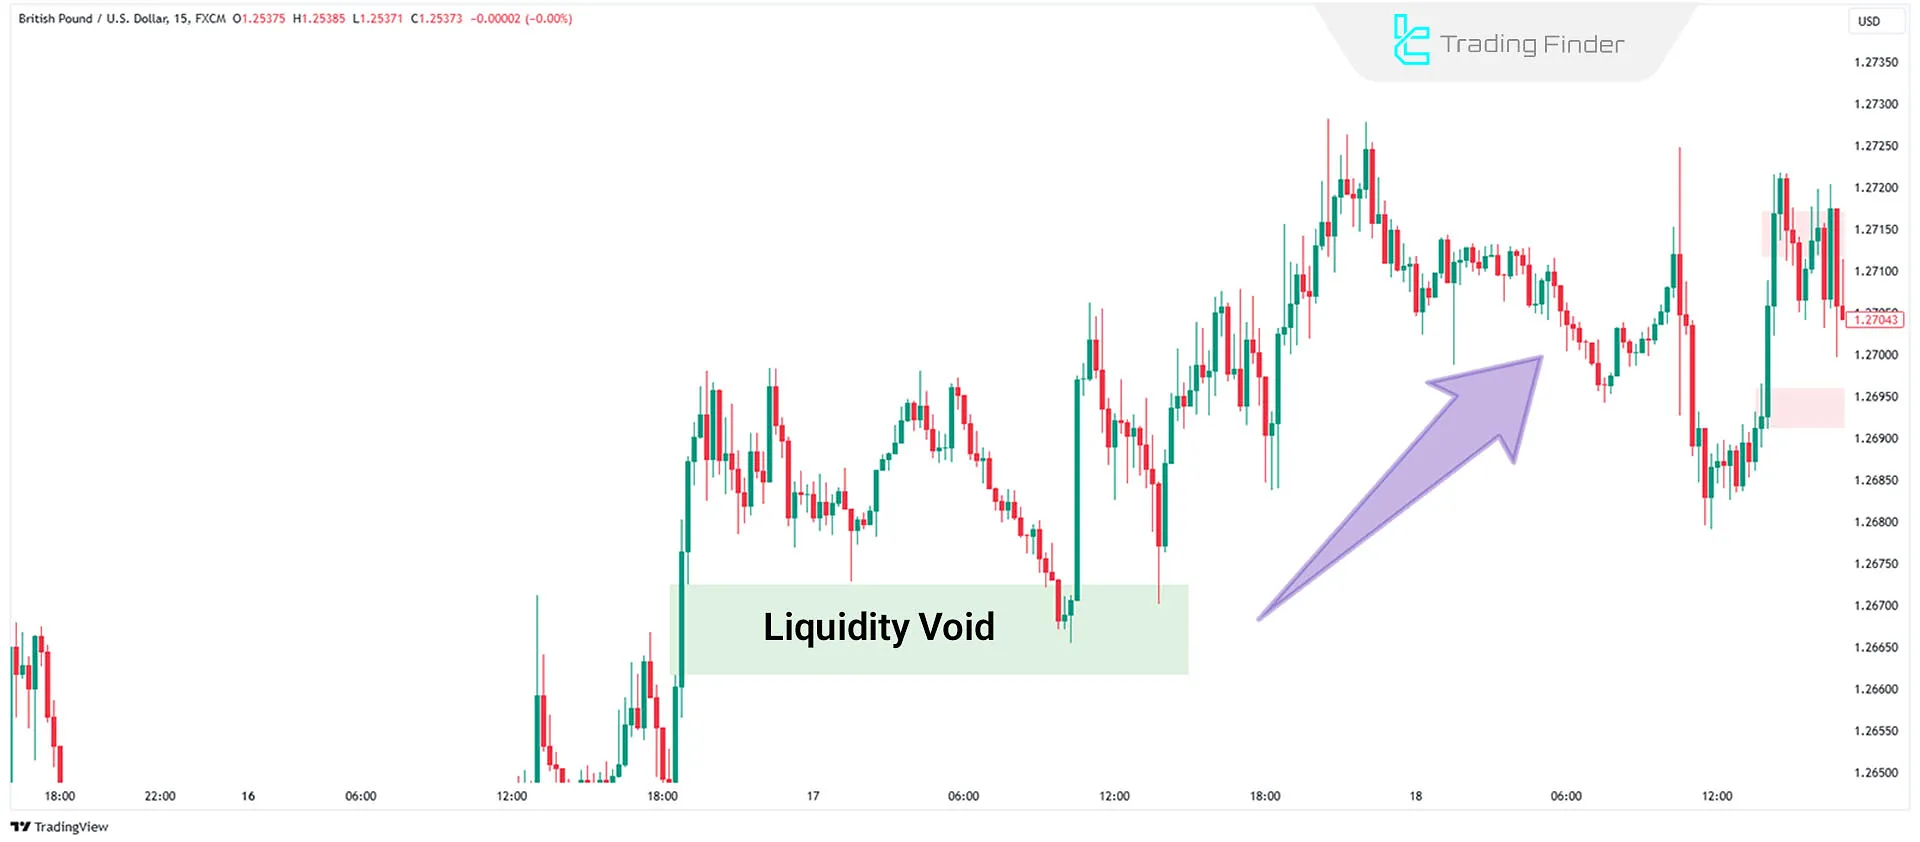
Bullish Liquidity Void Example
On the GBP/USD chart, a liquidity void is identified on the left side of the chart an area where price moved rapidly without balance between buyers and sellers. After some time, this void was targeted by the new market structure, and price returned toward it.
The purple arrow shows that as the market retraced toward the void, part of the imbalance was filled, and a notable price reaction formed in that area.
- Market Analysis: First, determine whether the market is bullish or bearish;
- Bullish Market: In a bullish market, the price usually retraces downward to fill the liquidity void, after which the upward move resumes. In these conditions, you can find buy setups within the void;
- Support Level: A bullish liquidity void in an uptrend is a strong support level.
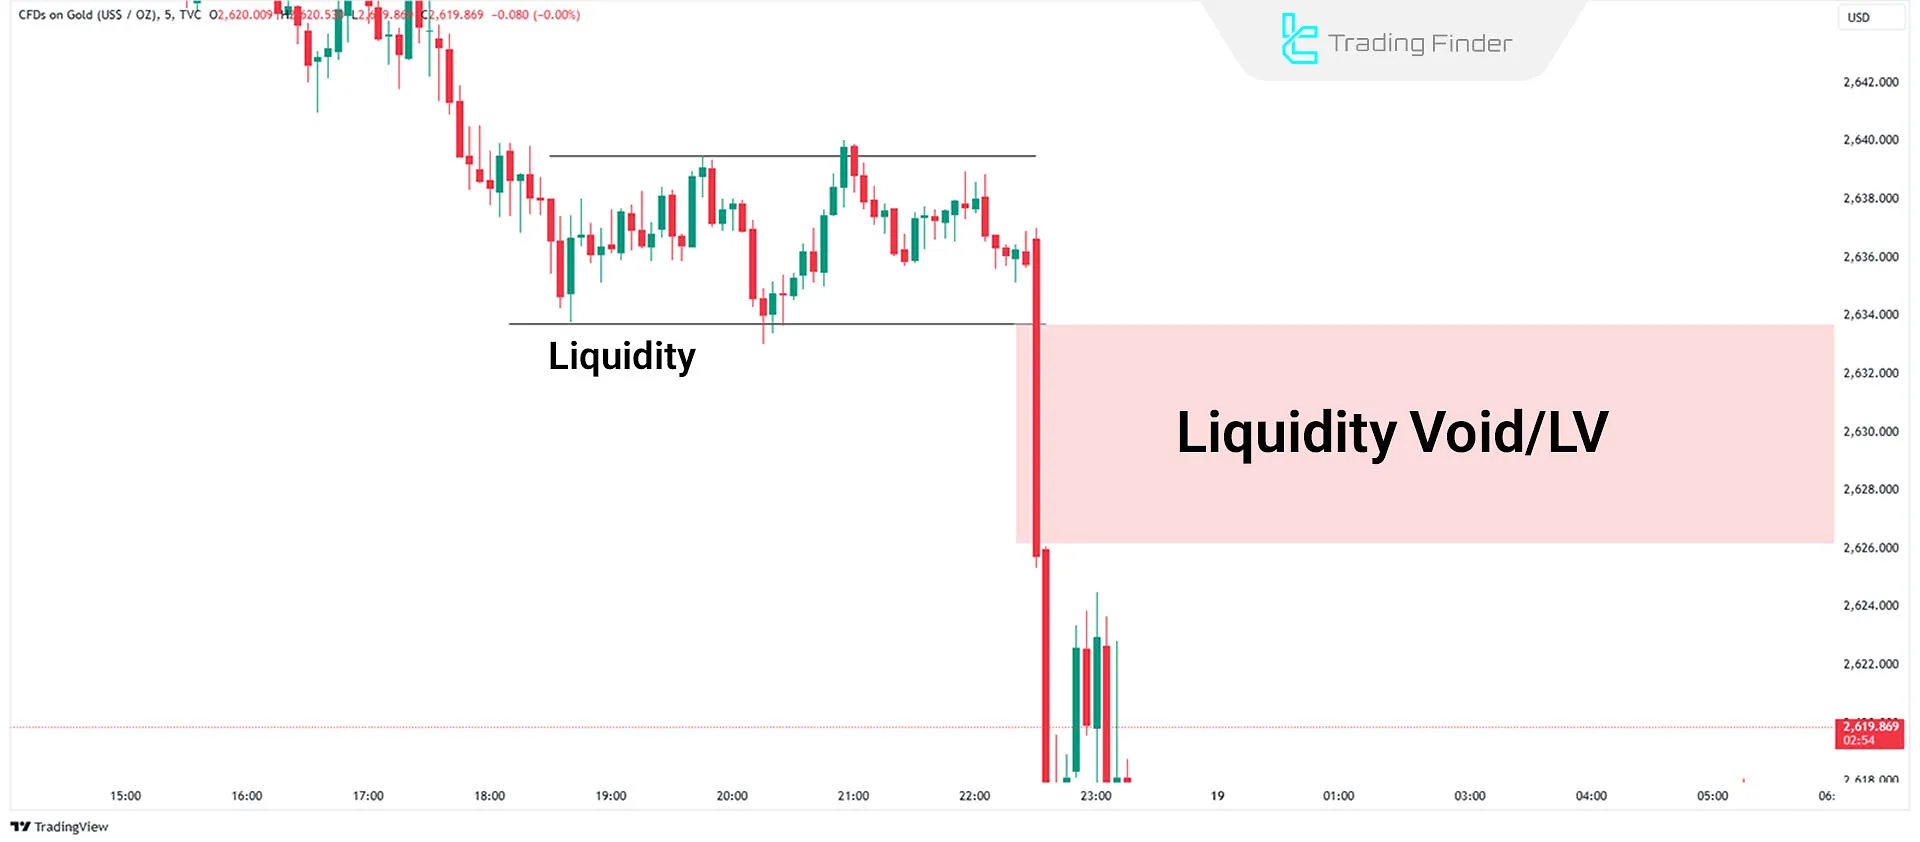
How to Trade Liquidity Void in bearish Market
A bearish liquidity void occurs when the price breaks strongly downward from a consolidation phase with large candles, absorbing buy-side liquidity.
This void occurs due to the absence of sufficient buy-side liquidity. The price moves downward without returning, creating an imbalance in the market.
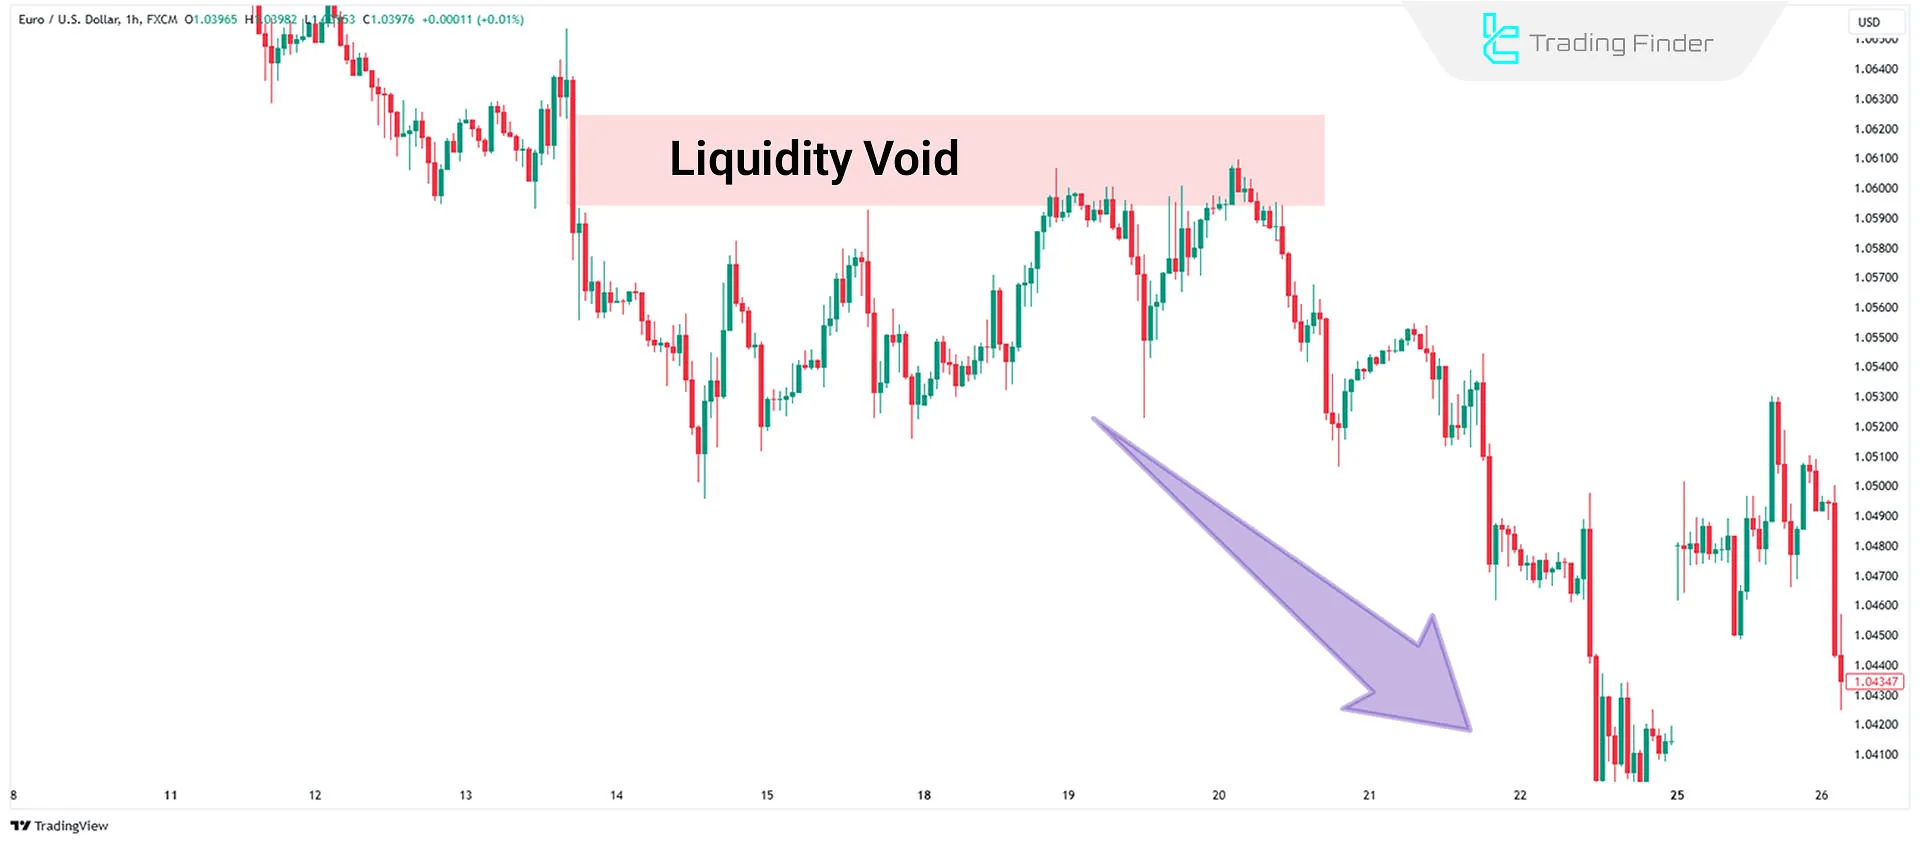
Bearish Liquidity Void Trade Example
On the EUR/USD chart, a large liquidity void is identified at the top of the chart-an area where price previously moved through rapidly without forming balance. After the formation of this void, the market continued its bearish move, and selling pressure is clearly visible in the chart structure.
The purple arrow indicates that after completing part of the bearish move, price still shows a tendency to fill the remaining void, and this area may act as a potential return destination in the future. Three key points for bearish trading using a liquidity void:
- Market Structure: First, determine the market trend (bullish or bearish);
- Bearish Market: In a bearish market, the price usually retraces upward to fill the liquidity void before resuming its downward In these conditions, you can look for sell setups within the void;
- Resistance Level: A bearish liquidity void in a downtrend is a strong resistance level.
Application of Liquidity Voids Alongside Liquidity Zones
Liquidity Zones and Liquidity Voids are two complementary concepts in the ICT market structure that, when used together, provide a clear picture of price destination, smart money behavior, and the market’s movement path.
Each liquidity zone represents an area where resting orders and stop losses are concentrated, while a liquidity void reflects rapid price movement and a lack of active participation from traders.
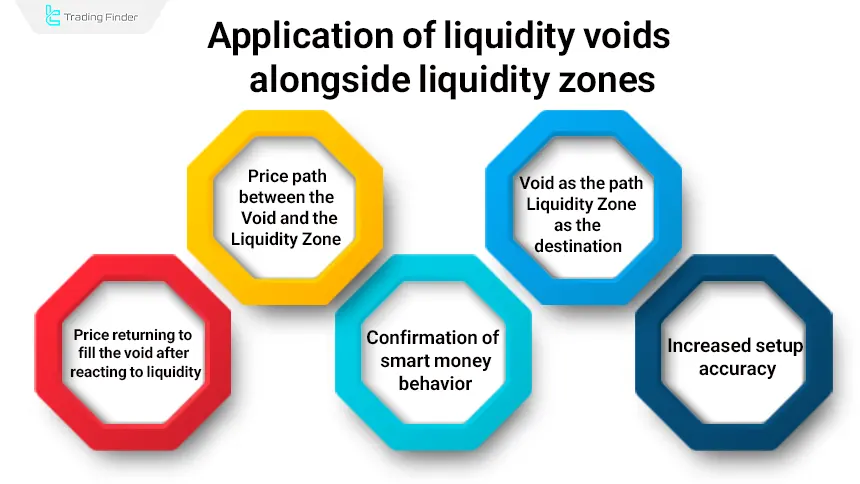
The Price Movement Path Between the Void and the Liquidity Zone
Price typically moves from a low-liquidity area (Void) toward a high-liquidity area (Liquidity Pool), as the market’s primary objective is to fill orders located within liquidity pools. A liquidity void drives price rapidly toward the next liquidity pool.
In this process, void areas act as low-resistance paths, allowing price to move through them with higher speed and lower volatility.
The Role of the Void as the Path and the Liquidity Zone as the Destination
In the ICT structure, a liquidity void mainly represents the price delivery path, while liquidity zones are considered points of pause or price interaction. A trader achieves the highest accuracy when they are able to align this path (Void) with the destination (Liquidity Zone).
This alignment allows the trader to follow price movement step by step and identify potential reaction zones in advance. The more aligned the path and destination are with trend structure and order flow, the higher the probability of success for the trading scenario.
Price Returning to Fill the Void After Reacting to a Liquidity Zone
After price reaches a liquidity pool and absorbs liquidity, it usually returns to the previous void to restore balance. This return often creates an ideal trading opportunity, especially when the void overlaps with an FVG or an Order Block.
In such conditions, market structure indicates that after liquidity is taken, price needs to fill the imbalance, which increases the likelihood of a revisit to the void area.
Confirmation of Smart Money Behavior Through Combining Void and Liquidity Zone
When a liquidity zone is broken and a new void is formed simultaneously, this combination usually signals strong institutional activity and the beginning of a new phase. Traders use this combination to identify accumulation, repricing, or distribution phases.
This structure shows that the market is shifting its liquidity priorities and that order flow is being transferred to an area that requires filling. In such a scenario, smart money footprints are clearly traceable, and the next price direction can be predicted with greater accuracy.
Increased Setup Accuracy Through the Overlap of Void and Liquidity Zone
When a void is located near a liquidity pool, the probability of a strong price reaction in that area increases. This overlap typically provides the best conditions for identifying low-risk setups such as “CE Entry”, “FVG Return” or “OB Reaction”.
The presence of a void near a liquidity pool indicates that the market has not yet filled part of the imbalance while sufficient order volume is available to generate a reaction.
This combination clarifies the price movement path and potential turning point, allowing the trader to execute more precise entries.
Do Liquidity Voids Always Get Filled?
There is no specific timeframe for filling or rebalancing a liquidity void. The price may fill the void immediately or return to fill it days later.
Is Filling a Liquidity Void Guaranteed?
No, there is no guarantee that a liquidity void will be filled. The price may continue without returning to the previous liquidity void or create new voids.
Price behavior depends on market conditions, structure, and liquidity flow.
Liquidity Void Indicator
The FVG+Void indicator is a specialized tool in the ICT and smart money style, designed to identify Fair Value Gaps (FVG) and price voids.
By accurately detecting imbalance zones, this indicator analyzes the structure of price movement and enables traders to identify key reversal or trend-continuation points with greater precision.
One of the key features of this tool is displaying the percentage of FVG consumption. When price enters an imbalance zone and begins consuming the remaining orders, the indicator shows the consumed portion both numerically and visually.
This feature provides deeper insight into liquidity behavior and allows the analyst to better assess the strength or weakness of market moves. Educational videos on using the liquidity void indicator:
The FVG+Void tool is capable of identifying both bullish and bearish imbalances as separate zones and displays both types of FVG as colored rectangles on the chart. This visual structure allows traders to view the most important price action zones directly on the chart without the need for manual drawing.
In addition, this indicator can detect invalid FVGs and remove them from the chart; as a result, the trader works only with valid and reliable zones. One of the standout advantages of this tool is the ability to adjust the indicator’s behavior according to the trading style, including aggressive, defensive, or normal modes for FVG detection, defining how invalid zones are handled, and configuring candle evaluation levels.
This advanced customization helps traders adapt the display of imbalance zones based on their personal strategy. With features such as displaying FVG consumption levels, distinguishing between valid and invalid zones, and automatic detection of price voids, the FVG+Void indicator is an efficient tool for market structure analysts, especially users of the ICT style.
By simplifying the process of identifying imbalances, this tool increases analysis speed and significantly improves a trader’s accuracy in determining key price zones.
Overall, FVG+Void is a powerful tool for professional traders seeking a deeper understanding of price behavior and liquidity flow. Liquidity Void Indicator Download Links:
Differences Between Liquidity Void (LV) and Fair Value Gap (FVG)
A liquidity void is a larger pattern that encompasses several fair value gaps. Some of the key differences between these two models are as follows:
Pattern | Liquidity Void (LV) | Fair Value Gap (FVG) |
Definition | An area with rapid movements and imbalance in trading volume | A gap between candles due to price imbalance |
Cause | Lack of liquidity and volume in the market | Strong price movements and mismatched orders |
Appearance on Chart | Long, rapid candles with no price retracement | Gap between the high and low of candles |
Purpose in Technical Analysis | Filling the gap to rebalance liquidity | Identifying areas for price reversal or trend continuation |
Signs | Sharp decrease in trading volume and rapid price movement | Visible gap between candles |
Conclusion
Liquidity voids occur when the price moves rapidly and aggressively without retracement or balance in trading, creating an imbalance between buyers and sellers.
Although these voids can be used as trading opportunities, there is no guarantee that they will be filled or rebalanced, as it depends on market conditions. Use this concept in combination with structural changes for better analysis and confirmation.


