


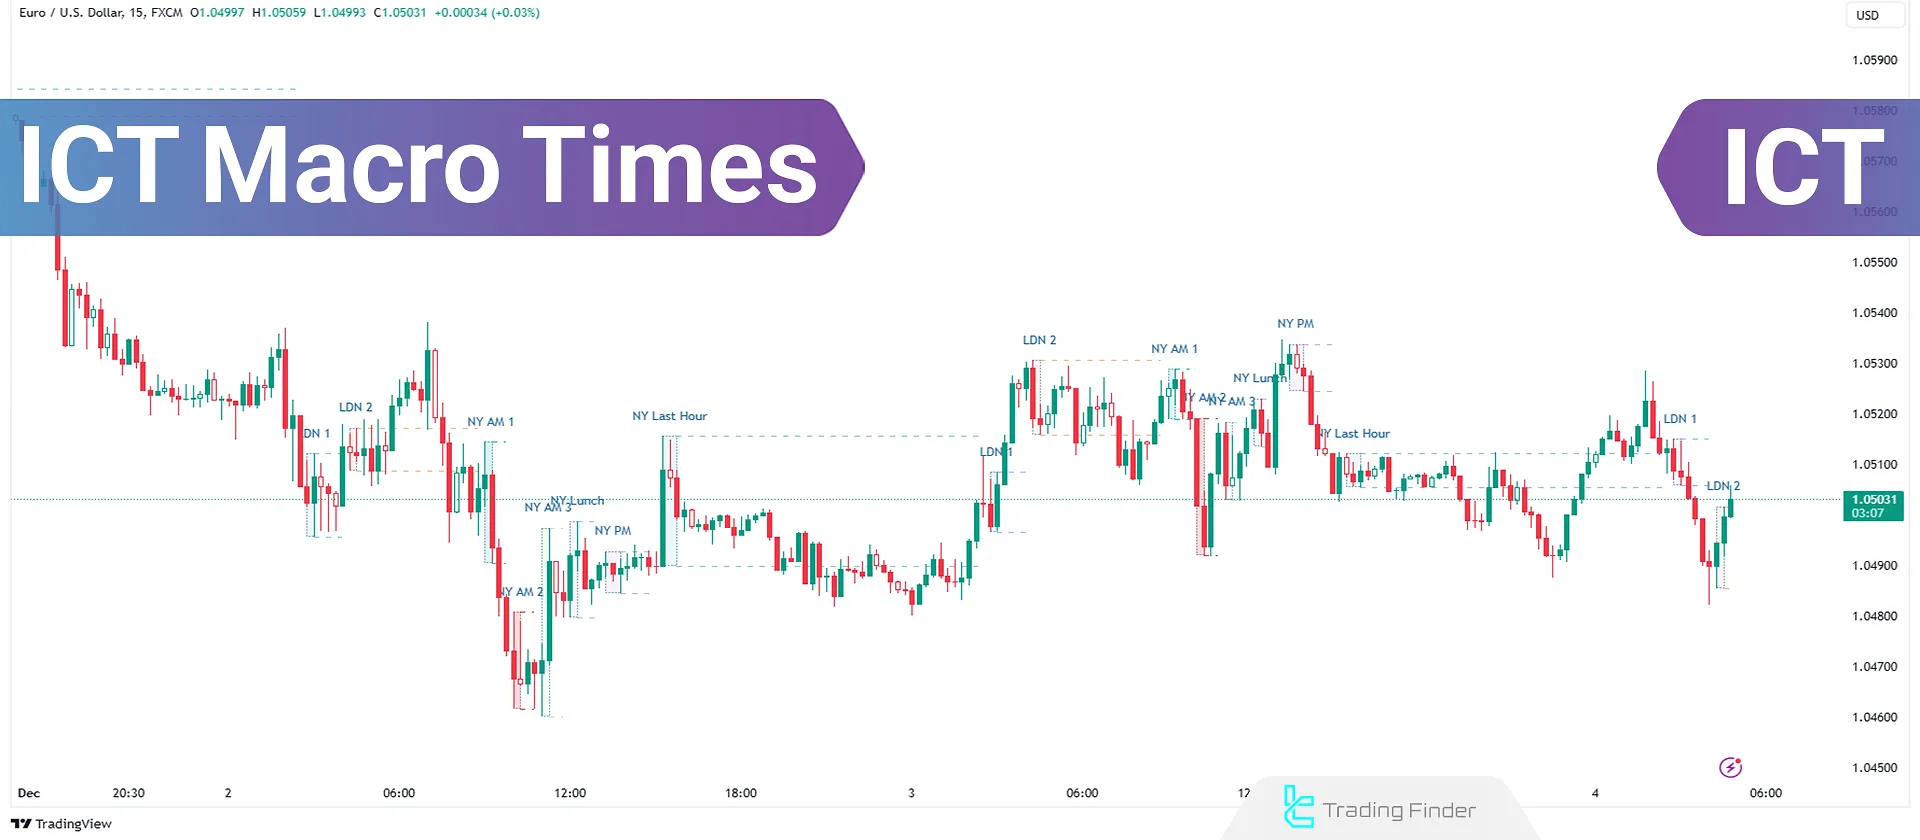
ICT Macro Times refer to short time intervals during which the algorithm seeks liquidity to fill Fair Value Gaps (FVG) and address price imbalances. The Macros are brief instructions followed by trading algorithms to locate liquidity, inefficiencies, and imbalances in the market.
These algorithmic behaviors are also studied under broader frameworks of ICT macro analysis.
Macros typically occur in 20-minute intervals, focusing primarily on the first 20 minutes of the New York session's trading hours. These events happen during the London session, New York's morning, noon, and evening sessions.
What Are ICT Macro Times?
ICT macro times are short periods within the trading day during which the activity of liquidity-driven algorithms reaches its peak. Based on structural research, during these intervals the market reorganizes liquidity, corrects pricing inefficiencies, and adjusts order flow.
These periods usually coincide with the opening or overlap of major sessions such as the London and New York sessions, where large-scale institutional order flow enters the market and can trigger a shift in the price movement phase.
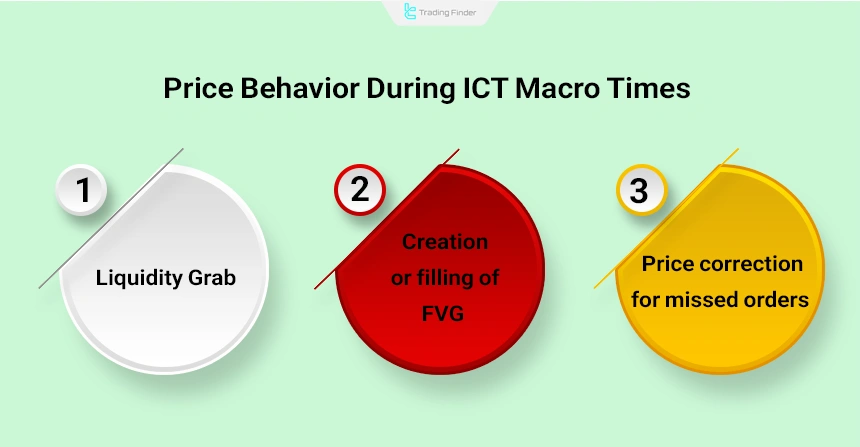
The duration of macro periods is typically around 15 to 20 minutes and serves as a probabilistic timing signal for identifying the start of tradable movements. During these times, the market usually displays one of the following three behaviors:
- Liquidity Grab
- Creation or filling of an FVG
- Price correction for unfilled orders
These behaviors allow ICT-style traders to capture explosive and directional market moves with greater accuracy.
ICT Macro Times in EST and GMT
As shown in the table below, each macro aligns with one of the major sessions. These windows form the explosive points of the market, where daily highs and lows, reversal structures, or strong trending moves are usually created.
In the table below, all ICT Macro Times are displayed in both EST and GMT time zones:
ICT Macros | EST Time | GMT Time |
London Macro | 02:33 AM to 03:00 AM | 06:33 AM – 07:00 AM |
London Macro | 04:03 AM to 04:30 AM | 08:03 AM – 08:30 AM |
New-York AM Macro | 08:50 AM to 09:10 AM | 12:50 PM – 01:10 PM |
New-York AM Macro | 09:50 AM to 10:10 AM | 01:50 PM – 02:10 PM |
New-York AM Macro | 10:50 AM to 11:10 AM | 02:50 PM – 03:10 PM |
New York Lunch Macro | 11:50 AM to 12:10 PM | 03:50 PM – 04:10 PM |
New York PM Macro | 01:10 PM to 01:40 PM | 05:10 PM – 05:40 PM |
New York Last Hour Macro | 03:15 PM to 03:45 PM | 07:15 PM – 07:45 PM |
Best Timeframe for ICT Macros
Given that ICT Macros consist of short time windows, lower timeframes are better suited for trading using ICT Macros.
You can use the 15-minute timeframe to determine direction and identify liquidity or price imbalance. To execute trades, you should use shorter timeframes such as 5 minutes, 3 minutes, or 1 minute.
This multi-timeframe approach forms a practical understanding of ICT Macro Timeframes.
Example of Choosing the Best Timeframe in ICT Macros
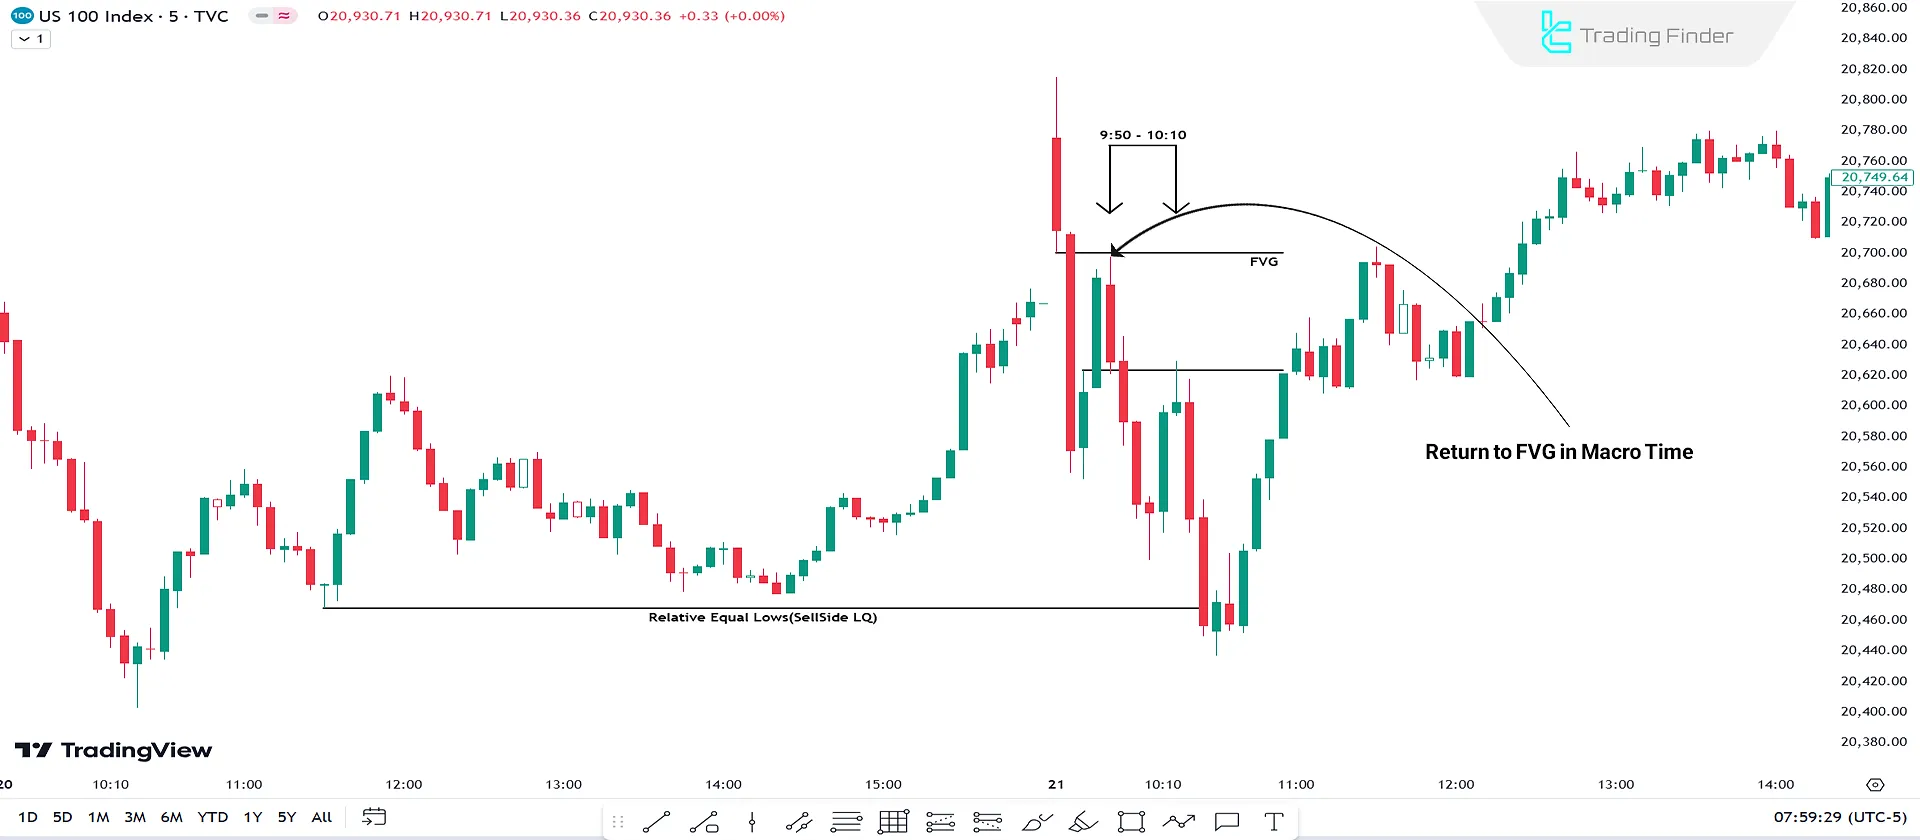
Suppose that in the 9:50 to 10:10 New York macro scenario, the analysis begins from the 15-minute timeframe; price is located near the previous day’s high and a bearish FVG remains open, therefore the daily bias turns bearish.
Next, on the 5-minute timeframe, a few minutes before the macro begins, a sharp bullish spike occurs and liquidity above the Asian high is collected.
Then, upon moving into the 1-minute timeframe, after a Liquidity Grab, a bearish structure shift is observed along with the formation of a small FVG.
At this point, a sell entry during the filling of that same FVG is logical, and the target is set on the London session liquidity. For a deeper understanding of ICT Macro Times, you can refer to the ICT Macro Time tutorial article on writofinance.com.
Advantages and Disadvantages of Trading in ICT Macro Times
Trading during ICT Macro Times creates a competitive advantage for many intraday and scalper traders.
Like any other trading framework, this approach has its own strengths and weaknesses, and understanding these features provides a realistic view of market behavior during these windows.
Advantages | Disadvantages |
Time clarity and reduced mental fatigue | Need for high skill and fast decision-making |
Formation of valid setups such as Silver Bullet | FOMO and rushed entries in short time windows |
Heavy liquidity inflow and explosive movements | Low volatility on some days and no formation of a trading setup |
Ability to capture the day’s move with low risk | High sensitivity to time conversions (DST/Time Zone) |
Improvement in trading discipline | – |
Best Time to Trade ICT Macros
The New York AM Macro is considered the best time to trade, as it encompasses the volatility of the New York market and its overlap with the London session. Additionally, most news releases occur during this time.
If you are interested in trading stock futures or indices, the NY-AM macros from 09:50 to 10:10 are ideal, and the New York stock market is also open during this time.
As a result, the first New York morning macro is considered the golden trading window of the day due to three key factors:
- Overlap of the London and New York sessions;
- Opening of the U.S. stock market and the inflow of heavy liquidity;
- Release of most major economic news.

Key Characteristics of the Main Macros for Trading
In the ICT style, each macro follows its own algorithm, and during these windows the market targets specific liquidity.
Understanding the temporal characteristics of these macros increases the analyst’s ability to identify potential price movements, common setups such as the Silver Bullet, and the reaction after a liquidity grab, making the study of market behavior more precise.
- 09:50 - 10:10 EST: Offers the potential for Silver Bullet setups and targets liquidity after stop hunts;
- 10:50 - 11:10 EST: A favorable time to target liquidity;
- 11:50 - 12:10 EST: Useful for liquidity targeting, particularly if earlier macros haven't cleared liquidity;
- Avoid trading during the lunch hour (12:00 - 1:30 PM EST.)
In the educational video from the fullviewtrading channel, further explanations are provided regarding ICT Macro Times and how to trade during these time windows, and those interested can refer to it for more information.
Impact of Daylight-Saving Time on ICT Macros
Daylight Saving Time (DST) in the United States works in such a way that the clock moves one hour forward in the spring and shifts one hour back in the fall to return to standard time
If your country does not observe Daylight Saving Time, ICT Macro Times may shift by one hour based on your local time. However, if your country follows Daylight Saving Time, there is no need to worry about this.
Therefore, to avoid any confusion, regardless of where you live, it is recommended to use New York local time as your reference time.
Best Currency Pairs for ICT Macros
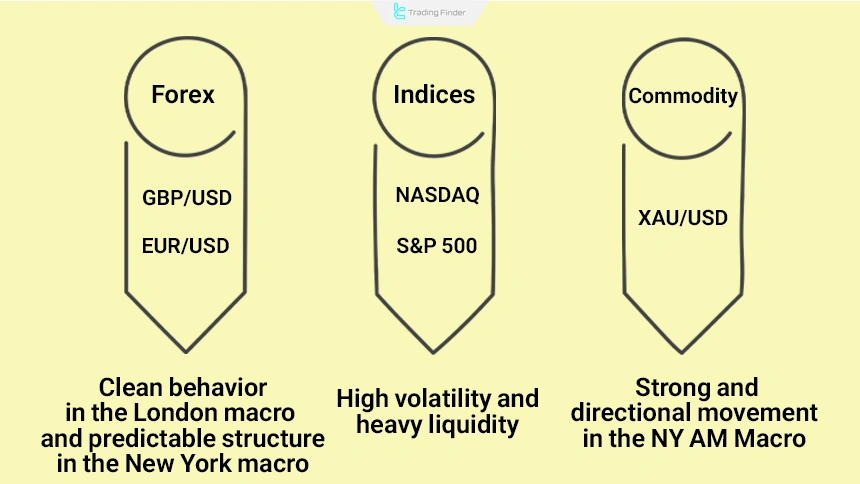
The ICT Macro strategy was initially developed and tested by Michael Huddleston (ICT) on indices like NASDAQ (NQ Futures) and E-mini (S&P 500), and it proved highly effective.
Over time, traders began applying the ICT Macro strategy to forex markets and metals, achieving excellent results.
Today, ICT Macros are effective in trading major currency pairs likeGBP/USD and EUR/USD and precious metals like XAU/USD (Gold).
How Do We Trade Based on ICT Macros?
ICT Macro Times are not complete trading strategies on their own, but they can be added to your trading strategy to maximize profitability. For example, combining ICT Macros with the Market Maker Buy/Sell Model (MMXM), Silver Bullet setup, or Fair Value Gaps (FVG) can enhance your approach.
The primary objective in macro trading is to identify liquidity pools, inefficiencies, and imbalances in the market, which can create opportunities for traders to enter their setups.
Having a daily bias can be helpful, but it is not essential for success in macro trading. Instead, traders should focus on specific time windows and setups that signal major market movements.
To trade based on macros, you must learn to trade them by focusing on price movement from imbalance toward liquidity within specific time windows. For example, traders should look for Fair Value Gaps (FVG) during macro windows.
Identify an FVG between 9:50 and 10:10 for a trade entry and target a liquidity pool.
Types of Liquidity for ICT Macros
ICT Macros can target various types of liquidity, including the following:
- Previous Day High/Low Liquidity (PDHL/PDLL): Targets the highest or lowest price from the previous trading day;
- Previous Session High/Low Liquidity: Focuses on the extremes of the prior trading session;
- 15-Minute Chart High/Low Liquidity: Targets established highs or lows on a 15-minute chart;
- Previous Week High/Low Liquidity: Tracks the highest or lowest price from the prior week;
- Opening Gaps (NWOG/Old Week): Trades involving gaps from the opening of the current or prior week;
- Relative Equal Highs or Lows: Targets liquidity around equal highs or lows on the chart.
Common Mistakes in Trading ICT Macros
Macros last only about 20 minutes, and price flow during this interval moves with high momentum, a clear direction, and sometimes deceptive movement; even a small mistake in these moments can lead to a wrong entry or missing the setup.
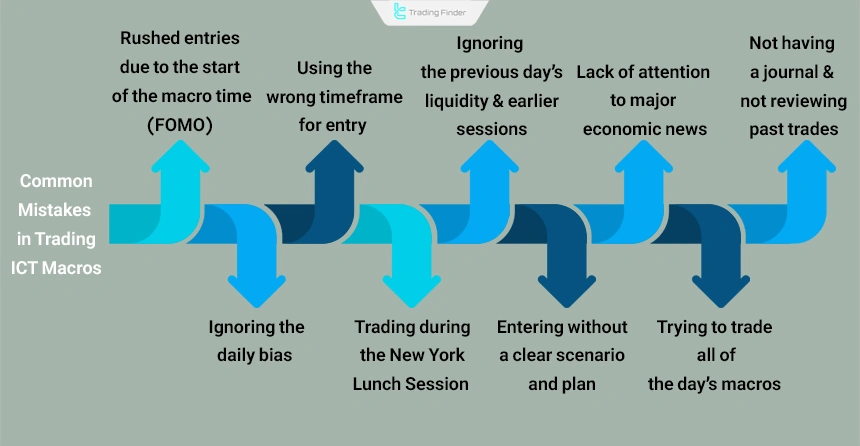
Below are the common mistakes traders make within the ICT Macros structure:
- Rushed entry just because the macro window has started (FOMO);
- Ignoring the Daily Bias;
- Trading during the New York Lunch Session (low liquidity);
- Using the wrong timeframe for entry (instead of M1–M3);
- Overlooking the previous day’s liquidity and prior sessions;
- Entering without a scenario and a clear plan;
- Not paying attention to major economic news;
- Trying to trade every macro of the day;
- Not having a journal and not reviewing past trades.
ICT Macro Indicator in MetaTrader and TradingView
The ICT Macro Indicator is a specialized tool for Inner Circle Trader (ICT) style traders, designed to identify the market’s critical time zones.
- ICT Macro Indicator for TradingView
- Download ICT Macro Indicator for MetaTrader 5
- Download ICT Macro Indicator for MetaTrader 4
This tool runs on the TradingView platform and provides a precise view of price behavior during key periods by plotting Kill Zone boxes and real-time labels. Below are its features and capabilities:
- Automatic detection of the London and New York sessions with dynamic alignment to Daylight Saving Time (DST) changes;
- Flexible configuration of time windows based on UTC, local time, or New York time;
- Accurate display of the high and low of Kill Zone ranges with dotted lines to define price reaction boundaries;
- Full support for M1 to M30 timeframes for scalping, daily, and intraday strategies;
- Broad compatibility with financial markets including forex, cryptocurrencies, and international indices;
- Advanced graphical design with clear visual boxes for instant identification of time phases;
- Stable performance synchronized with live data structures on TradingView.
This indicator reveals influential time windows so that the trader can identify liquidity fluctuations, Fair Value Gaps (FVG), and price reactions in critical zones.
For example, on a 5-minute currency pair chart, after an FVG forms within the Kill Zone, price fills the gap and moves into a strong bullish trend.
It offers color customization for London Macro and New York Macro zones across sessions, the ability to enable or disable time windows, and precise adjustment of ranges according to the user’s analytical style.
The ICT Macro Indicator is one of the key tools for ICT traders; by displaying strategic time windows and liquidity fluctuations, it makes trading decisions more accurate and more targeted.
For TradingView users, this indicator serves as a golden point for timing entries and exits.
Conclusion
ICT Macro Times are powerful tools for traders to pinpoint specific timeframes to locate liquidity and capitalize on price imbalances. ICT Macros allows traders to set precise entry and exit points and benefit from market volatility.
Combining ICT Macros with other trading strategies like the Market Maker Buy/Sell Model (MMXM) enables traders to identify high-probability setups and exploit low-resistance liquidity runs (LRLR).


