


The Market Maker Buy Model (MMBM) is a trading pattern within the ICT methodology that describes how price moves from a bearish key zone to a bullish key zone within PD Arrays.
By understanding this structure, traders can identify precise entry points and set tight stop losses, offering a framework for effectively capitalizing on price movements.
What is the ICT Market Maker Buy Model?
This model demonstrates how the price transitions from a bearish state, influenced by selling pressure, to abullish state, where buyers dominate the market. It enables traders to analyze trend changes and price direction with greater precision.
Key Considerations Before Using the ICT Market Maker Buy Model
- The market should exhibit an upward trend in higher timeframes (e.g., daily or weekly), with prices moving toward higher levels;
- Liquidity should target higher levels, with previous highs serving as price objectives;
- A short-term bearish move typically occurs in lower timeframes (e.g., 15 or 30 minutes) before reaching key zones on higher timeframes, setting the stage for an upward continuation.
Components of the ICT Market Maker Buy Model
The Market Maker Buy Model consists of the following components:
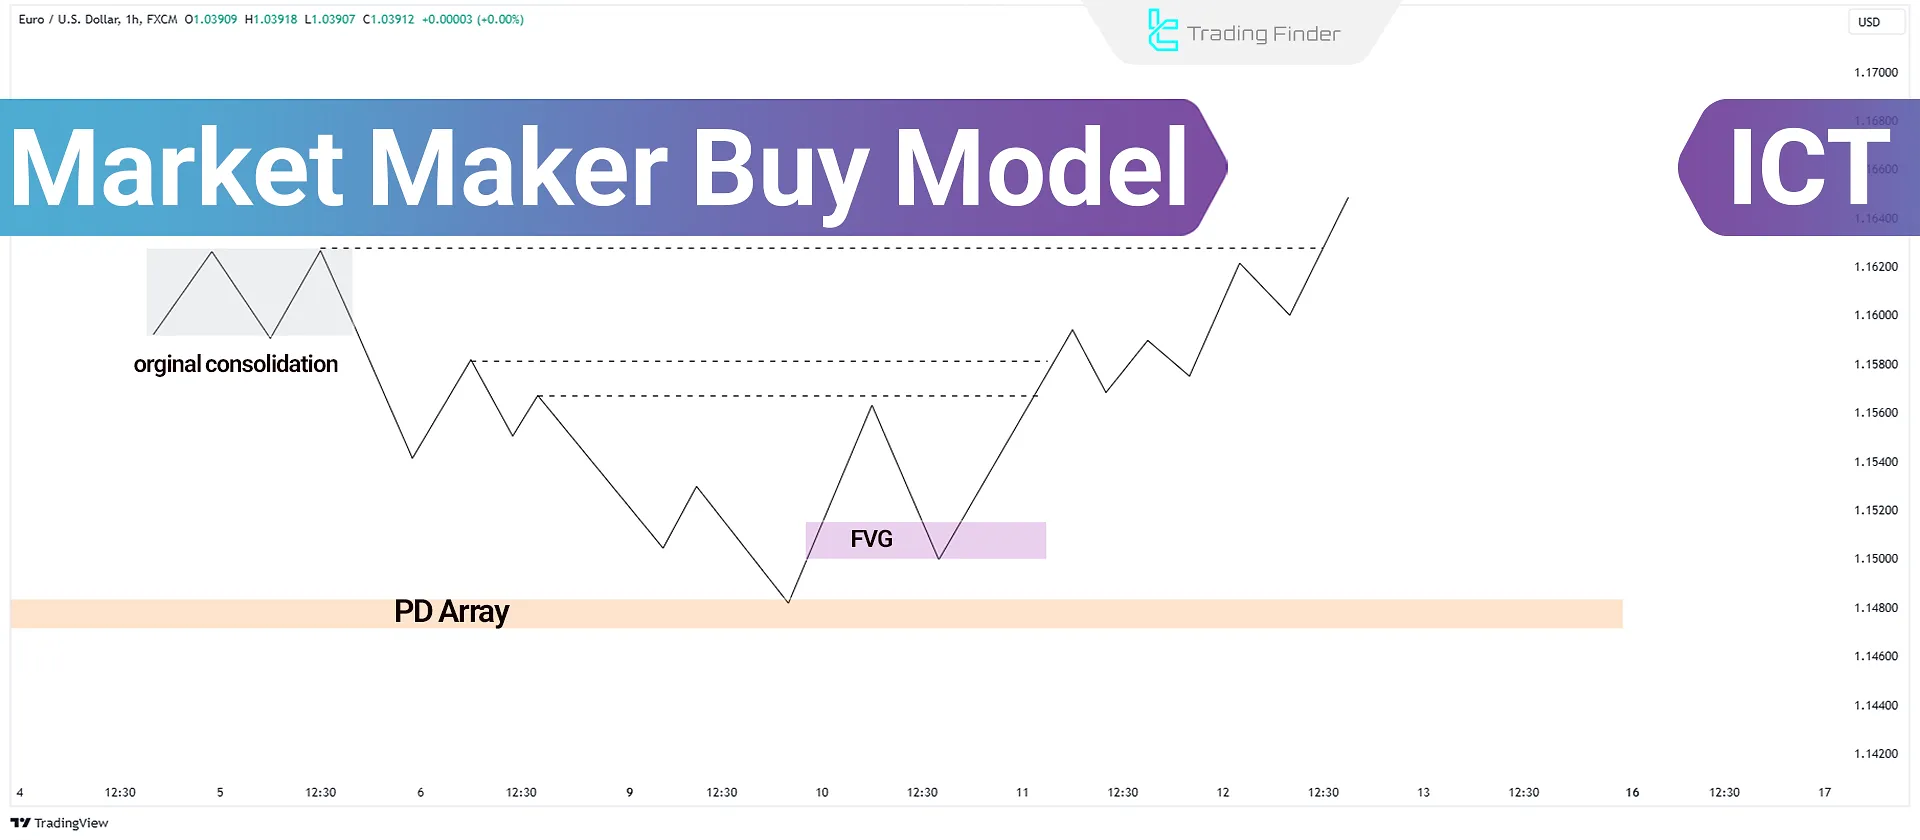
Consolidation Phase
Price oscillates within a range defined by upper and lower levels, known as the initial range or consolidation zone.
Lower High Formation
Price creates Lower Highs during a downward movement. These levels act as liquidity points when the price begins to rise.
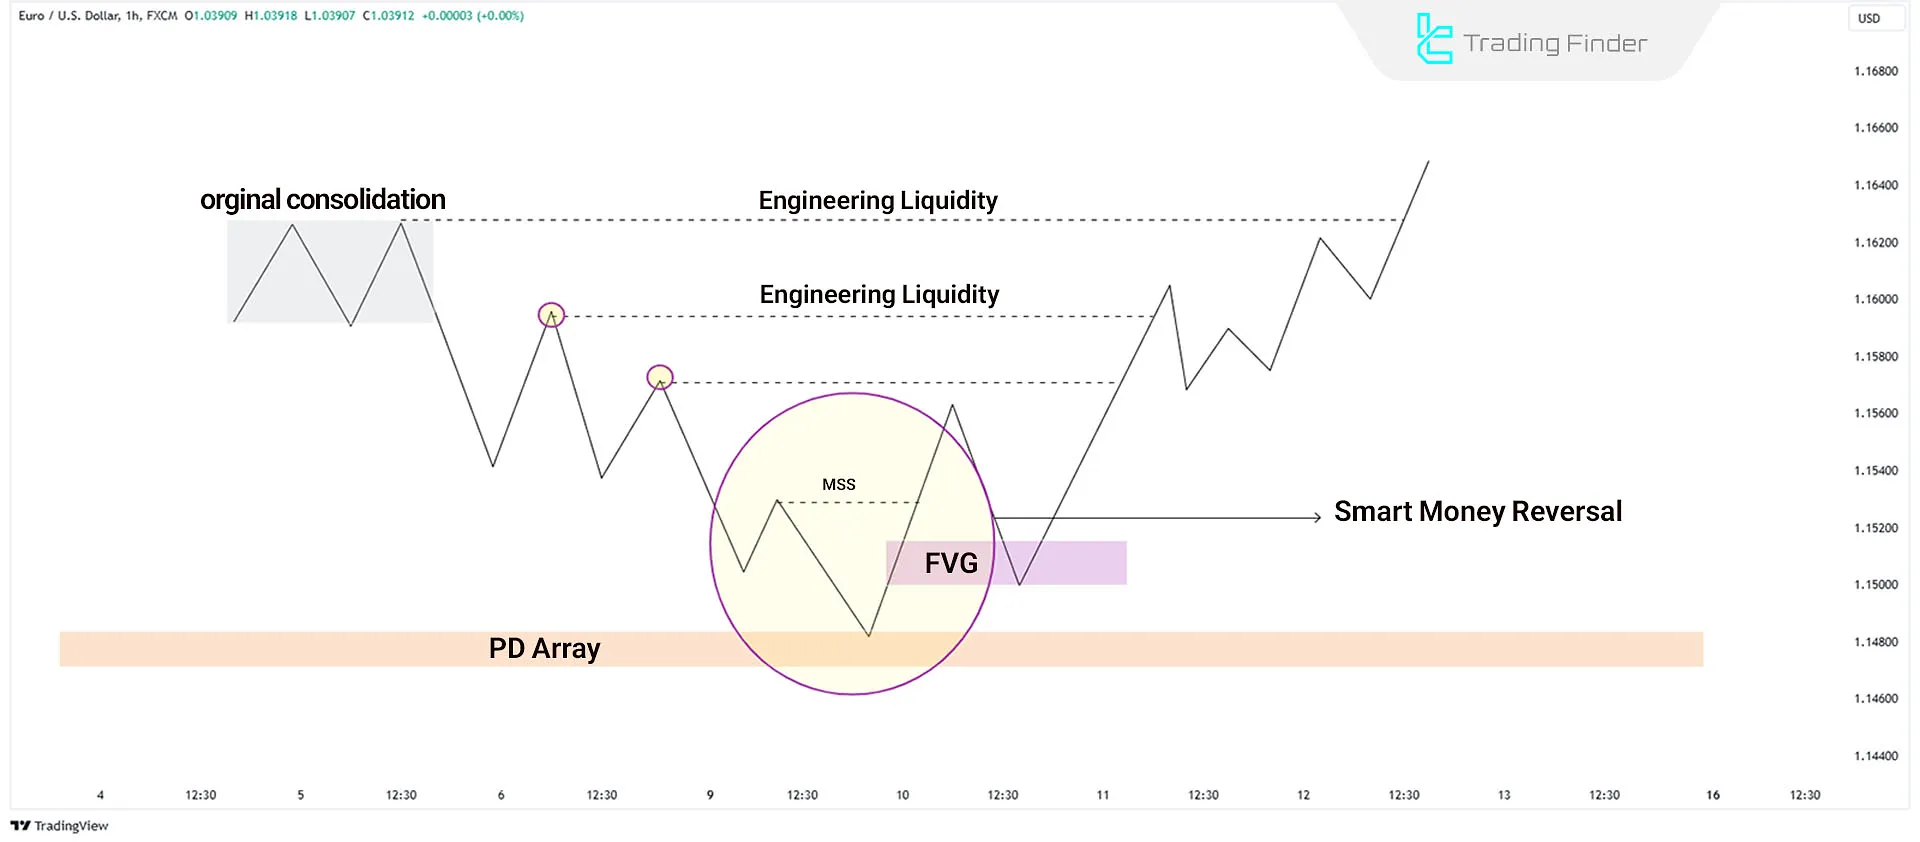
Trend Reversal
The trend shifts upon reaching a key higher-timeframe level (e.g., PD Array). The market transitions from theSell Side to the Buy Side.
Liquidity Capture
Price absorbs liquidity from previous highs formed during consolidation. Subsequently, the price retraces to the initial range.
Key Zones
- Fair Value Gaps (FVGs) are included to identify imbalanced zones for optimal entries;
- Liquidity zones, such as previous day highs and lows (PDH/PDL), are critical trading points.
How to Trade Using the Market Maker Buy Model
Follow these steps to trade with the Market Maker Buy Model:
#1 Identify a Bullish Market Structure
Analyze higher timeframes to confirm an uptrend with Higher Highs and Higher Lows.
#2 Locate Liquidity Above the Current Price
Identify previous highs with liquidity above the current price, as the price often moves toward these zones.
#3 Wait for a Sell Program in Lower Timeframes
In lower timeframes, wait for a temporary bearish move to pull the price back into the Bullish PD Array of the higher timeframe.
#4 Confirm Bullish Reversal in Higher Timeframes
Upon reaching the higher timeframe’s bullish zone, wait for a Break of Structure(BOS) and SMT Divergence to confirm the upward trend.
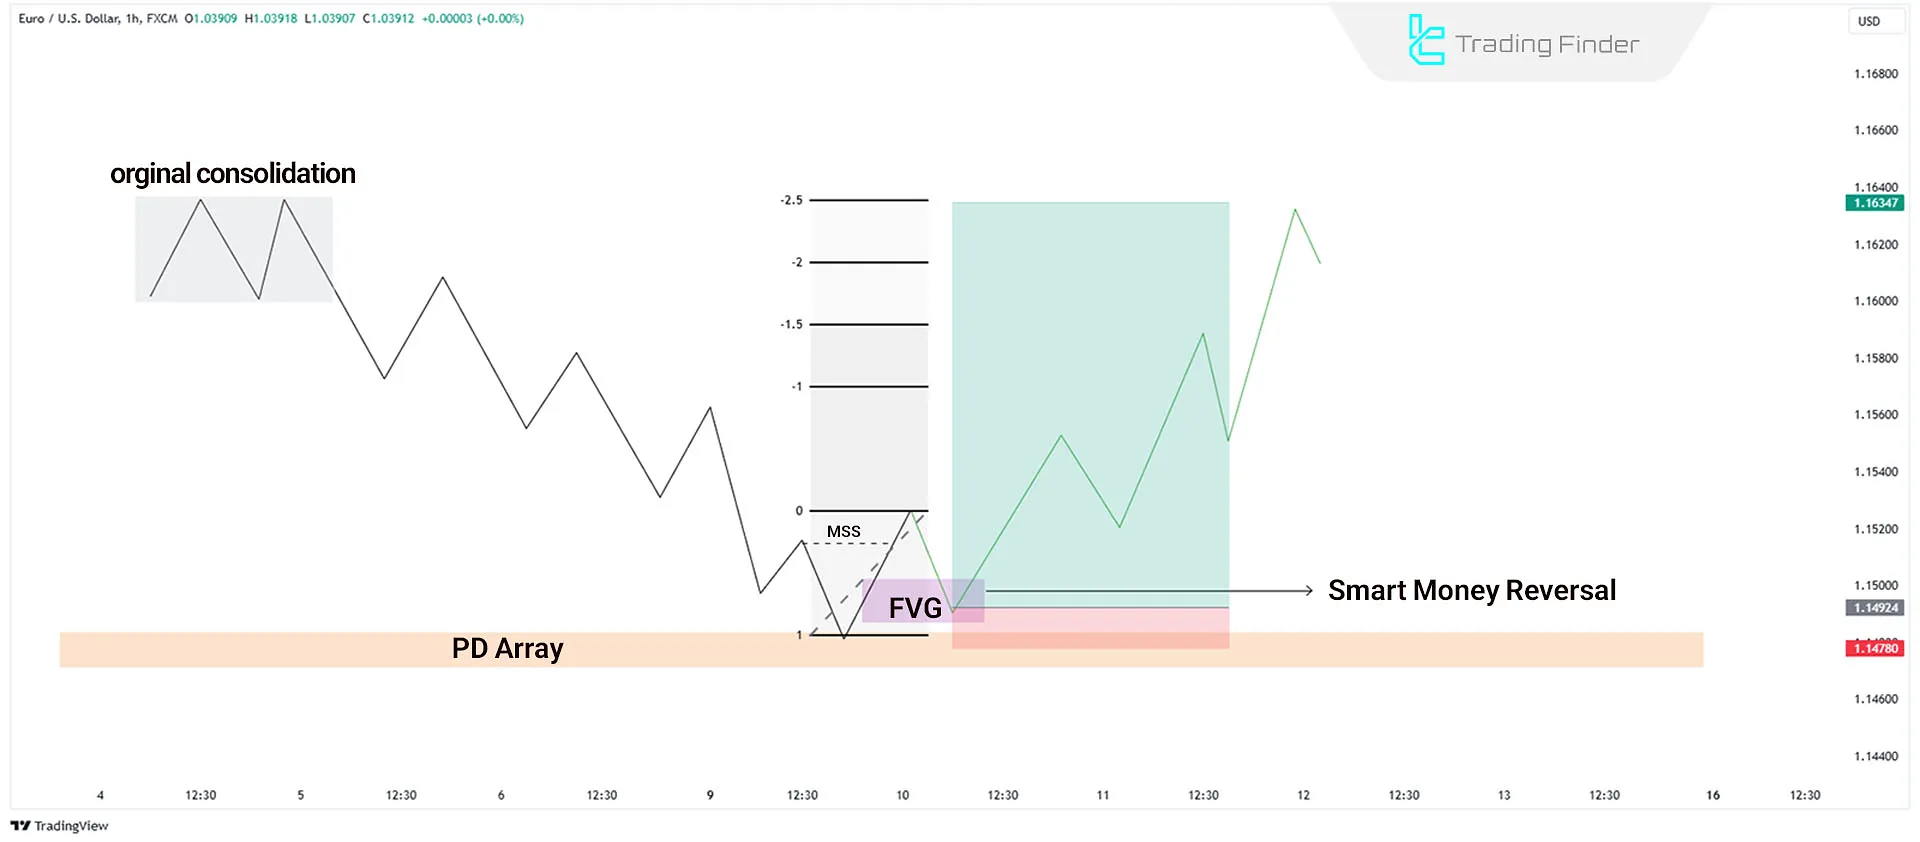
#5 Enter a Buy Trade
Enter a buy trade after price returns from an FVG and confirm a Bullish Break of Structure.
#6 Set Stop Loss
Place your stop loss 10 to 20 pips below the last swing low before the Break of Structure.
#7 Set Profit Target
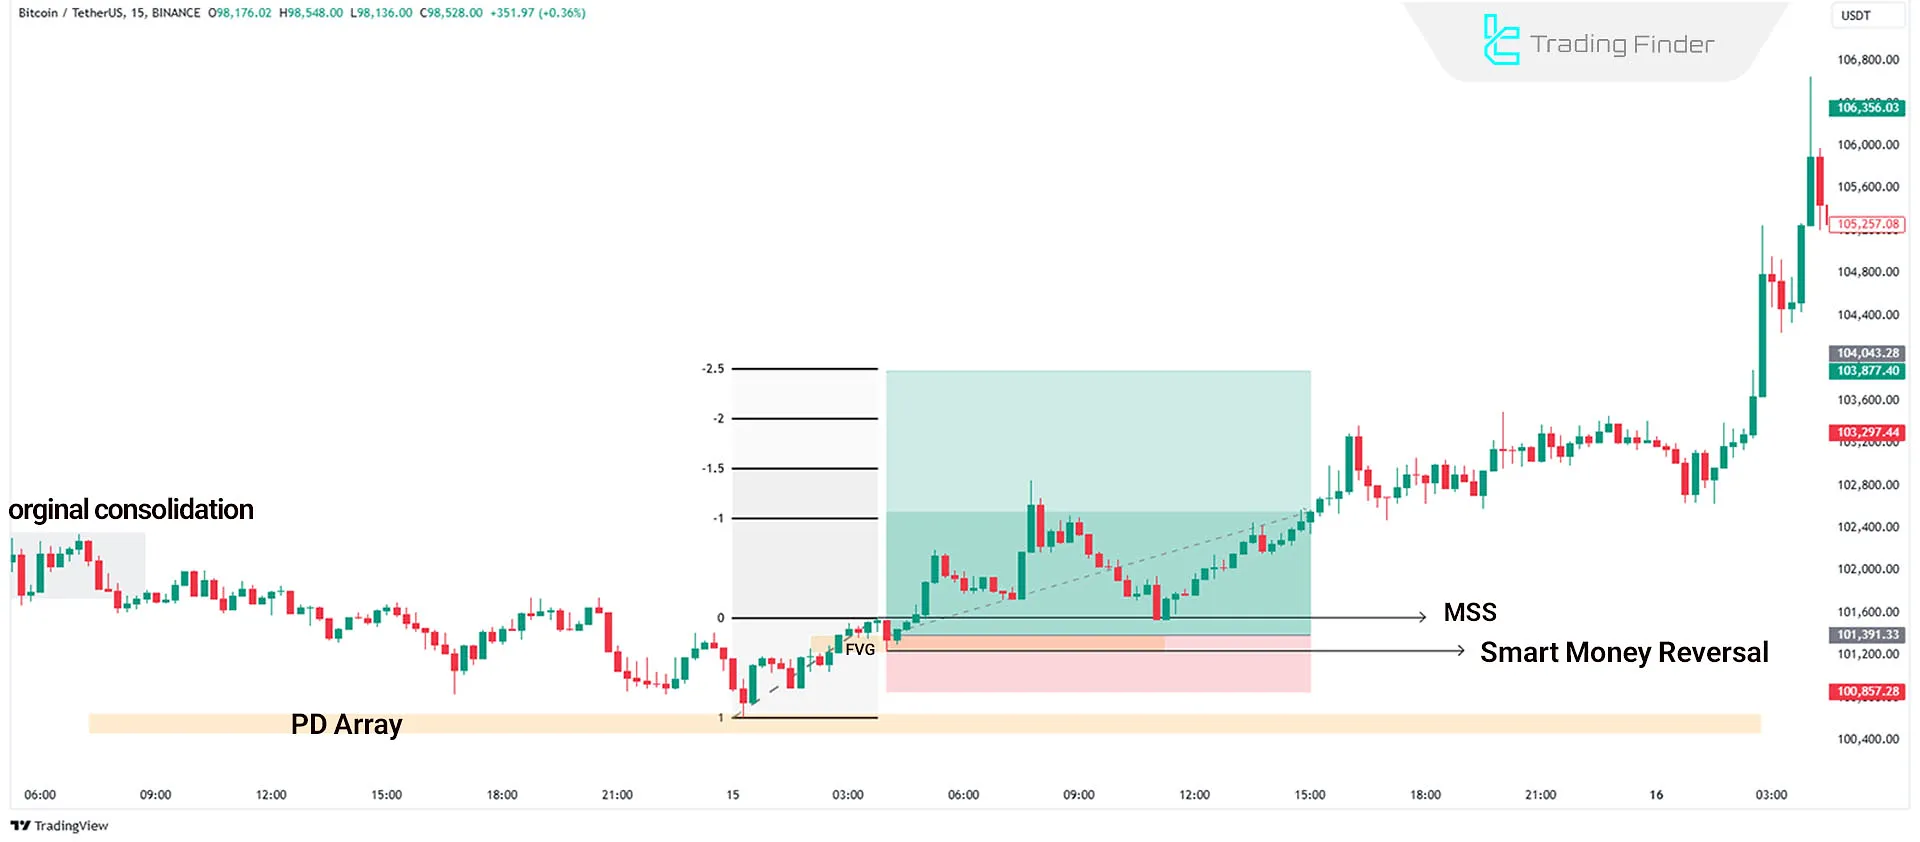
Use Fibonacci retracement from the lowest Smart Money Reversal point to the highest Break of Structure point with 1 to -2.5 settings.
Alternatively, previous highs or higher-timeframe liquidity levels can be used as profit targets.
Conclusion
The ICT Market Maker Buy Model is a trading strategy that analyzes the bullish market structure, identifies key liquidity zones, and enters trades at pivotal levels like the Fair Value Gap (FVG).
By leveraging Market Structure Shifts (MSS) and robust risk management techniques, traders can minimize risk and optimize results.


