


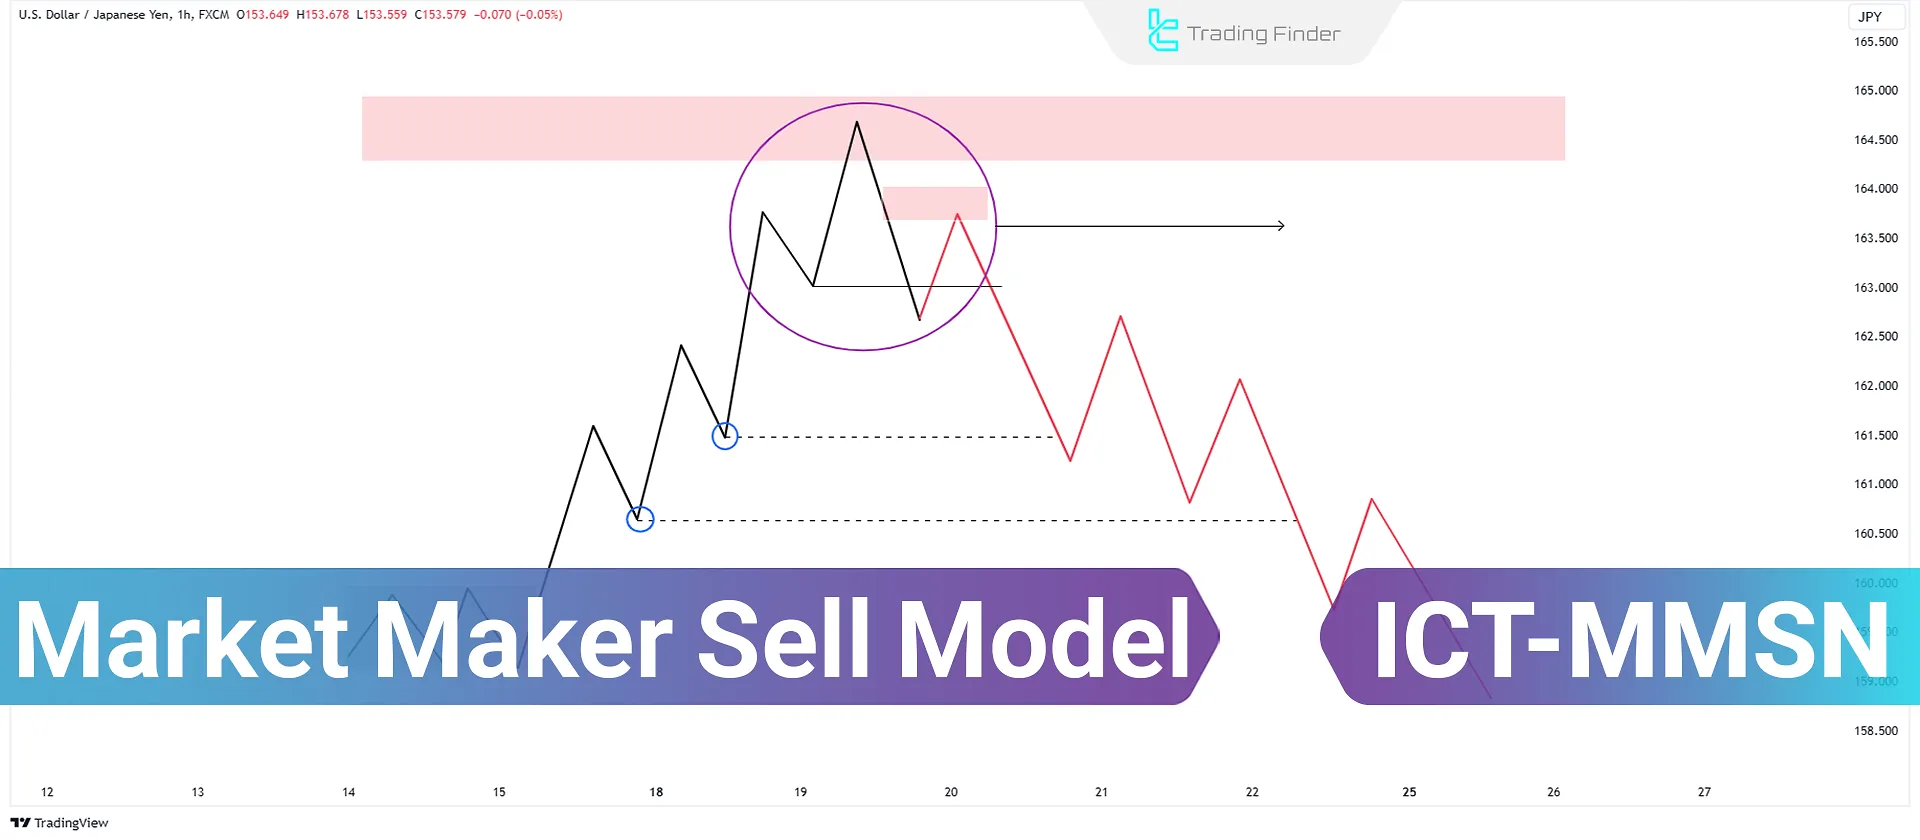
ICT Market Maker Sell Model (ICT MMSM) is a trading structure that explains how price transitions from one key bearish PD Array to another key bullish PD Array. This model provides a clear framework for price movement, allowing for precise trade entries and smaller stop-loss levels.
As a result, the trader can choose the precise entry zone at the moment of liquidity transfer, place the stop loss at the minimum possible distance relative to the array, and manage the trade based on the market maker’s logic of accessing liquidity.
What is the ICT Market Maker Sell Model?
This model illustrates how price moves from a bearish condition influenced by selling pressure toward a bullish condition [entry points for buyers].
It helps traders better understand trend shifts and price movement dynamics.
Training video on using the market-maker model from the YouTube channel TTrades:
What are the Components of the ICT Market Maker Sell Model?
In the market-maker sell model, the key zones act as the main pillars of decision-making and define the price path at each stage of the cycle. These zones are the points where smart money enters or exits, and where market behavior becomes the most clear.
Components of the market-maker sell model:
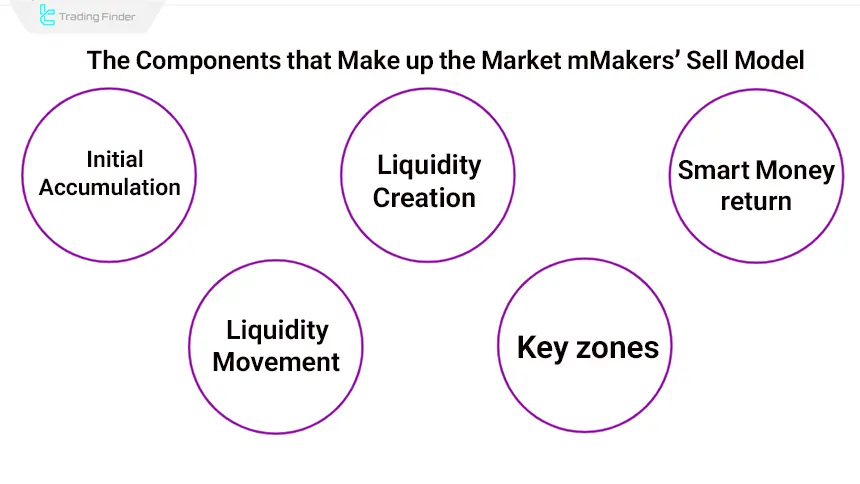
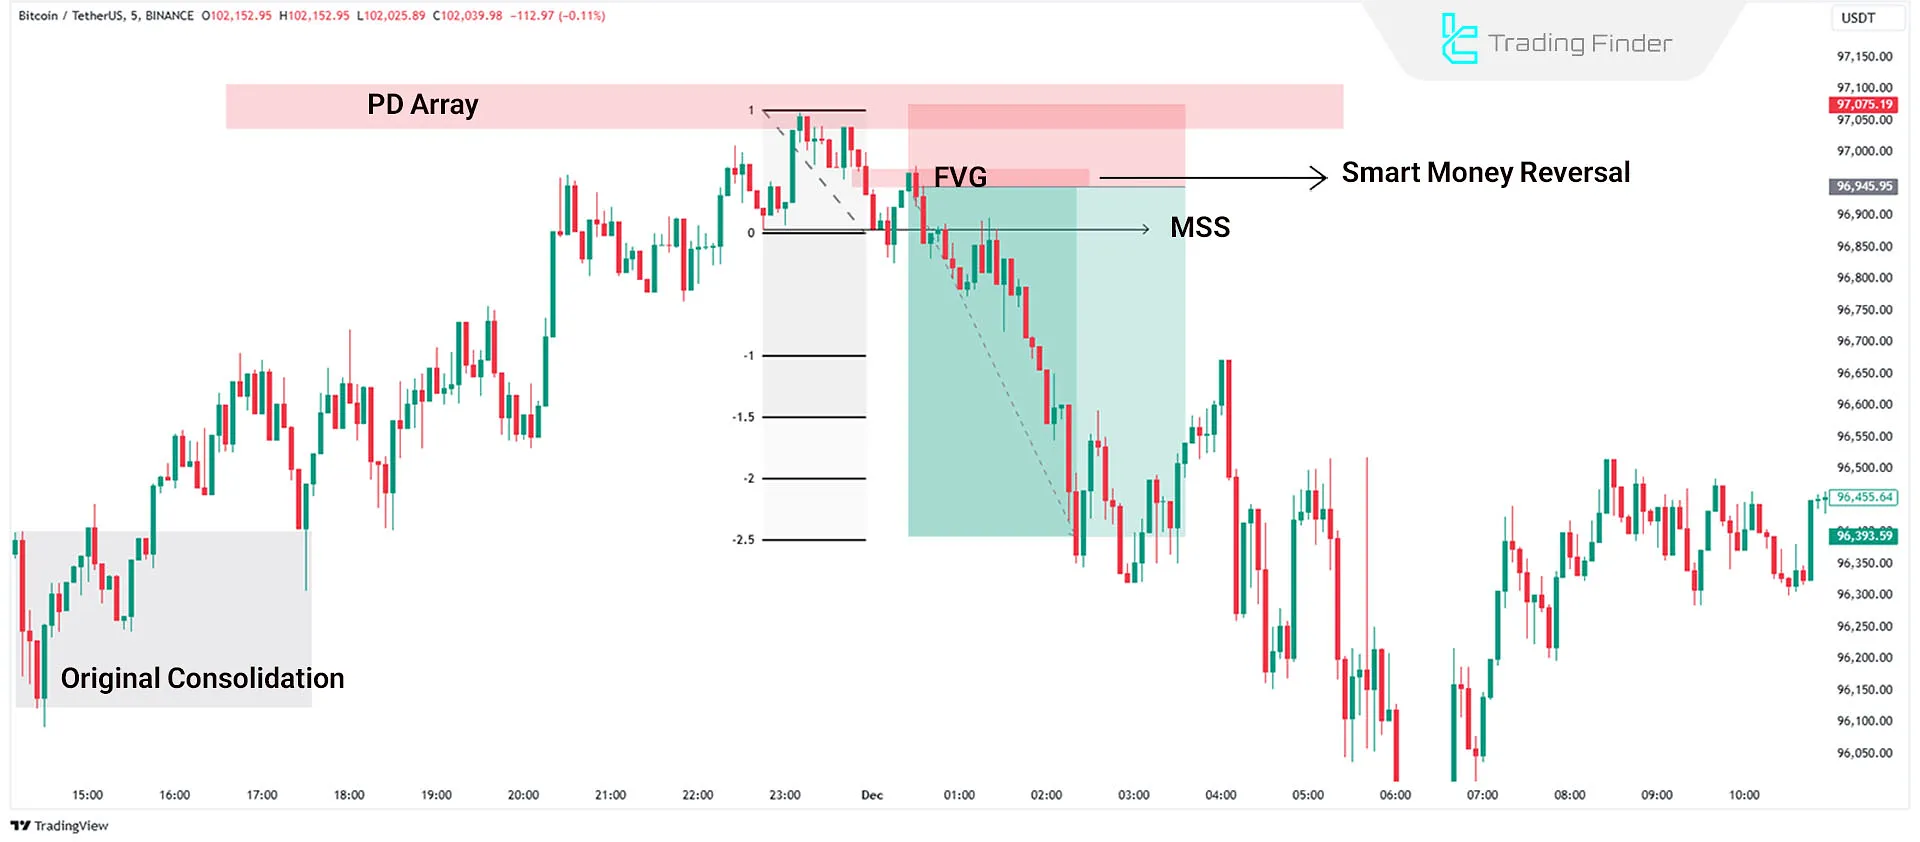
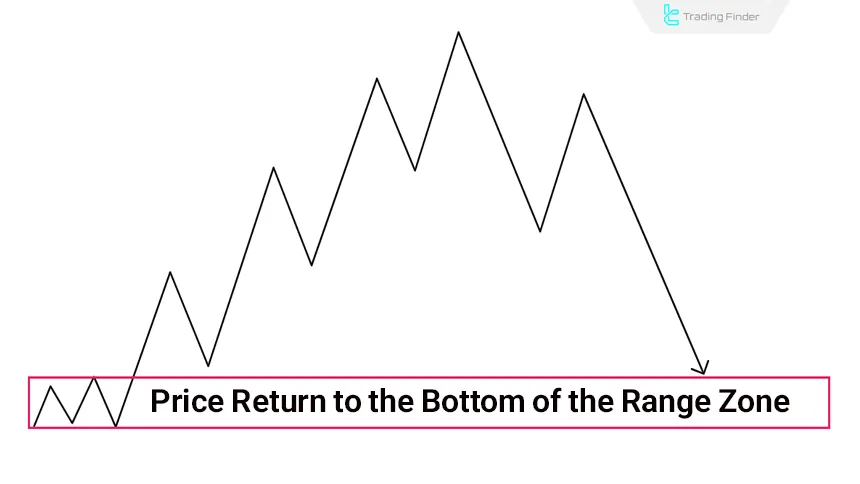
#1 Original Consolidation
Price oscillates within a defined range, forming a consolidation or range-bound market. This phase usually indicates a temporary balance between buy and sell orders and serves as a point for liquidity accumulation and preparing the market for the next directional move.
#2 Engineering Liquidity
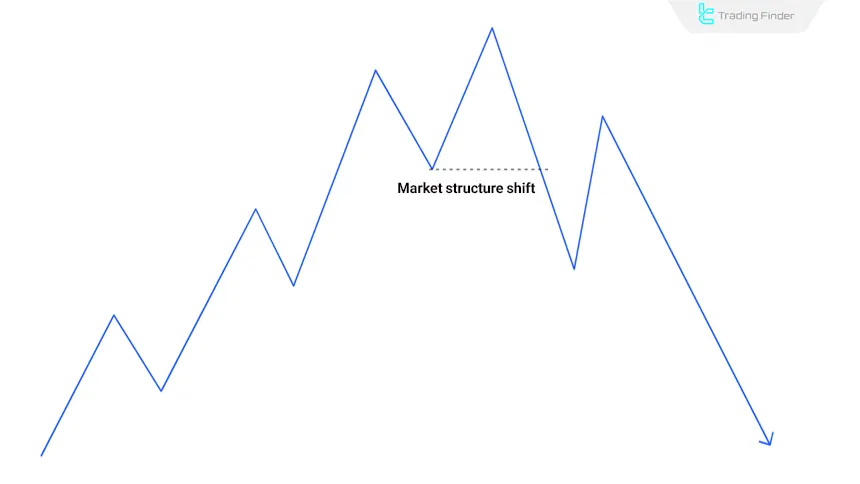
Price forms higher lows (HLs) during an uptrend, creating liquidity points for future downward moves. Each lower high is usually a cluster point for buyers’ stop losses, and in the bearish phase after the MSS, these levels are taken out step by step to maintain the downward momentum.
#3 Smart Money Reversal
When price reaches an important zone on the higher timeframe, such as a PD array, the market direction changes and shifts from the buy side to the sell side.
This area typically includes structures with dense liquidity, providing the conditions necessary for a strong reaction or the beginning of a reversal trend.
#4 Liquidity Hunt
Price sweeps old lows created during liquidity engineering and returns to the original consolidation range.
This retracement is the final part of the liquidity-taking cycle in the sell model and is usually accompanied by a reduction in bearish momentum. In this area, the market enters a new equilibrium phase, creating the conditions for the formation of the next structure or trend.
#5 Key Zones
Key zones on the chart are areas where the highest concentration of orders and price reactions occur, and they act as market decision-making points. Key zones in the market-maker sell model:
- Fair Value Gap (FVG): Imbalance zones for optimal trade entry
- Liquidity Levels: Key liquidity areas, such as previous highs and lows
How to Trade Using the ICT Market Maker Sell Model?
For a correct understanding of the market-maker sell model (MMSM), it is necessary to follow a set of analytical steps coherently and step-by-step.
This process starts with examining market structure on the higher timeframe and continues through precise entry, risk management, and setting profit targets. Training on using the market-maker sell model from the Writo-Finance website:
The main goal of this approach is to align with the smart money flow and avoid emotional or counter-trend entries. Important rules for using the market-maker sell model:
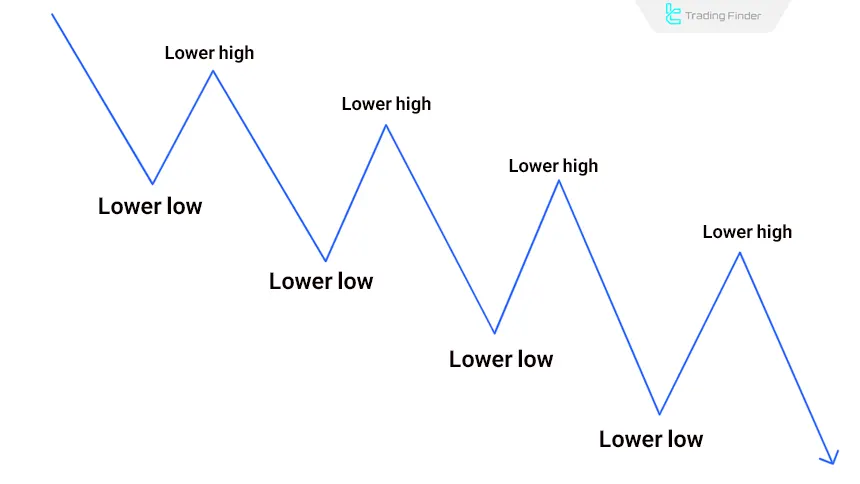
#1 Identify the Bearish Market Structure
In higher timeframes, confirm the market is forming lower highs (LH)and lower lows (LL), indicating a bearish trend. These bearish structures define the dominant market direction and increase the likelihood of continuation on the lower timeframes.
#2 Locate Liquidity Below the Current Price (Liquidity Draw)
Identify previous lows where liquidity resides; Price often moves toward these levels to capture liquidity. These zones are where buyers’ stop losses and pending orders accumulate, and they act as natural price targets during corrective or trending moves.
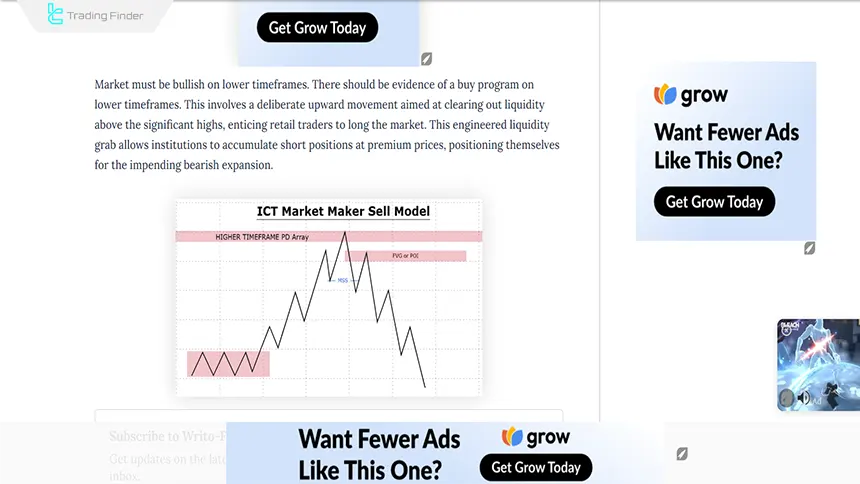
#3 Wait for a Buy Program in Lower Timeframes
In lower timeframes, wait for a temporary bullish move that pushes the price into a significant bearish PD Array in the higher timeframe.
This pullback is usually the result of the market’s need to fill imbalances or to retest a strong supply zone, and it represents the best opportunity to align the entry signal with the prevailing direction.
When price reaches this zone, the likelihood of buy-side liquidity being activated and the main bearish move beginning increases significantly.
#4 Confirm Bearish Bias in Higher Timeframes
When the price reaches a bearish zone in higher timeframes, wait for Market Structure Shift (breaking of lows) and SMT Divergenceto confirm bearish movement.
This simultaneity usually indicates weakening buyer strength and the activation of sell-side liquidity.
When a low is broken along with behavioral divergence between the two assets, the probability of the start of a strong bearish move increases significantly.
#5 Enter the Sell Trade
Enter a sell trade after the price retraces upward and a market structure shift confirms the bearish trend.
This pullback is usually the final stage of buy-side liquidity absorption and is considered the best point to align with the prevailing trend. With the confirmation of the bearish structure break, entering in this zone provides lower risk and a higher probability of success.
#6 Set Stop Loss
Place your stop-loss 10 to 20 pips above the last swing high, before the market structure shifts. This area is usually where liquidity accumulates, and placing the stop above it prevents the stop loss from being triggered prematurely.
#7 Define Profit Target
Use the Fibonacci tool to measure from the highest point of the Smart Money reversal to the lowest point of the market structure shift (settings: 1 to -2.5). Alternatively, previous lows can be considered as potential profit-taking levels.
In addition to these factors, the overlap of Fibonacci levels with liquidity zones or price gaps (FVG) can make target setting more precise and increase the probability of a price reaction within the selected areas.
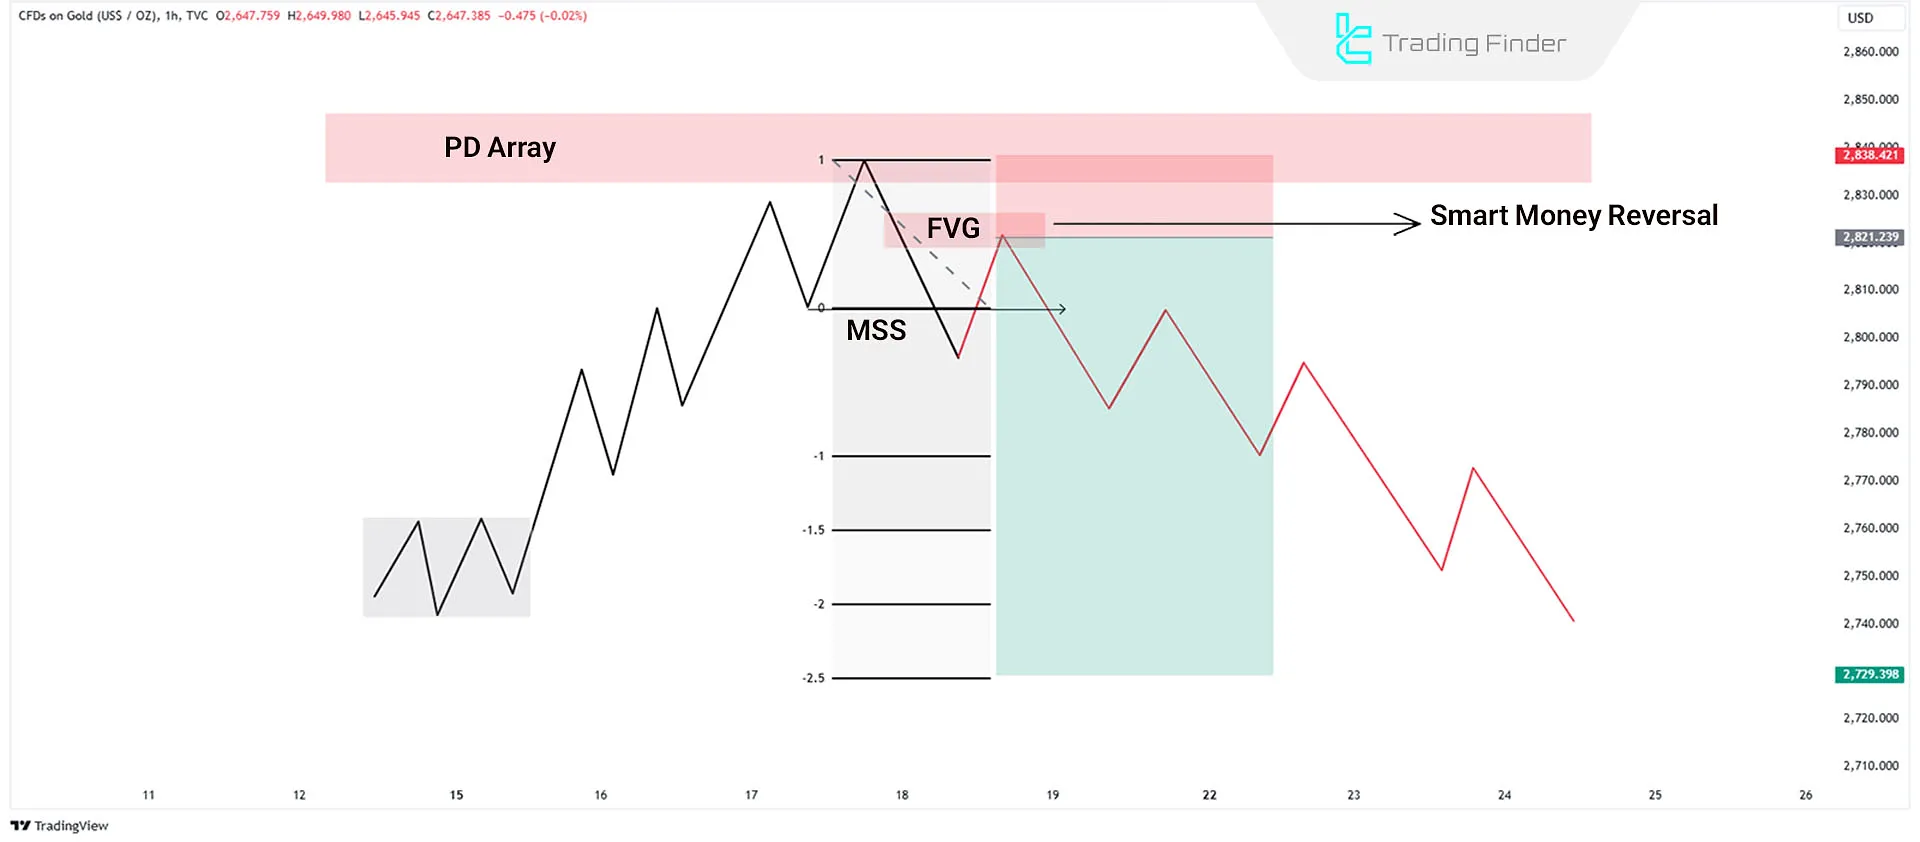
market maker sell model example
A 5-minute Bitcoin (BTC) chart shows a bearish market shift as market makers enter sell positions. The PD range at the top of the chart is identified as a heavy-liquidity zone, and after being tapped, price enters a reversal phase by creating an FVG.
The structure break confirms the beginning of bearish momentum, and after collecting liquidity, the price follows a deeper downward trend.
How to Identify the Market Maker Sell Model on the Chart
Identifying the Market Maker Sell Model is based on analyzing structural sequences, liquidity displacement, and observing price behavior within premium zones. This model is valid only when each phase is confirmed by chart data.
Educational guide for identifying the Market Maker Sell Model:
Initial Range Liquidity
At the beginning of the model, price trades inside a tight range a zone where buy-side liquidity accumulates at the top and sell-side liquidity at the bottom. This range acts as the initial liquidity pool and serves as the main reference point for liquidity draw at the end of the Sell Model.
Engineered Liquidity in the Bullish Leg
During the bullish phase, a structure of highs and clusters of stop-losses forms, creating layered liquidity. These layers are gradually taken out in the bearish leg after the market structure shift (MSS), providing the energy that fuels the downward move.
Additionally, the compression of liquidity around unmitigated highs acts as a magnet for price, guiding it until full liquidation of these levels is complete.
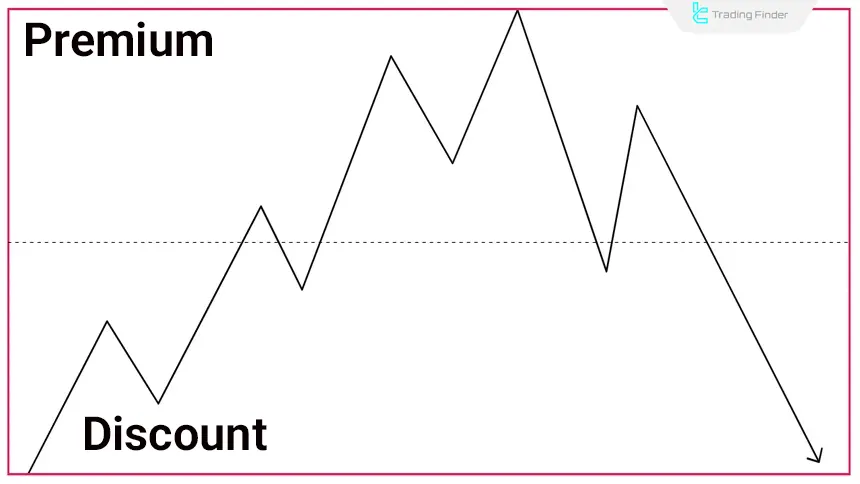
Buy-Side Liquidity in the Premium Zone
In the “Premium” areas, new highs form and the stop-losses of sellers, along with breakout traders’ buy orders, accumulate. This zone becomes a point of liquidity grab that often marks the beginning of price reversal and the formation of a bearish structure.
At this stage, confirming factors such as volume divergence, weakening momentum, or the formation of an MSS pattern increase the probability of a reversal scenario and the start of the distribution phase.
Liquidity After Market Structure Shift
Following a confirmed market structure break, price moves toward the liquidity layers beneath the HLs and removes them step-by-step. This continuous liquidity draw reinforces bearish momentum and prevents deeper retracements.
Simultaneously, the formation of new imbalance zones and their partial mitigation creates a clearer bearish path, organizing price behavior around Sell Order Blocks in a consistent and predictable manner.
Final Liquidity Target
The Market Maker Sell Model concludes when price reaches the lows of the initial range or a significant higher-timeframe Low. This zone is the final liquidity pool, and once cleared, the market typically enters a reversal phase or establishes a new range.
At this point, signs such as order-flow divergence, decreasing candle range, or the formation of Equal Lows may indicate full liquidity displacement and preparation for a reversal by the dominant market participant.
Market Maker Sell Model Indicator
The Market Maker Model indicator (MMXM) is an analytical tool designed based on liquidity logic and market structure. Its purpose is to detect points where the market maker drives price toward liquidity collection and then reverses structure.
This indicator focuses on CHoCH, BOS, FVG, and behavioral patterns of buyers and sellers to highlight conditions in which a trend reversal and the beginning of a new price movement may occur.
Its foundation is tracking order flow and price reactions within imbalance zones areas where the market maker commonly seeks to take liquidity before the main move begins. Training videos:
In its operation, MMXM first identifies FVG zones and tracks price action inside them. If price takes liquidity above key highs or below key lows and then forms a strong CHoCH or CISD candle, the indicator registers a potential structural shift.
Afterward, the return of price to the same-side FVG where the break occurred is considered a potential entry zone. Long and Sell signals are displayed with green and red arrows, while purple arrows highlight liquidity grabs and structural shifts.
This logic aligns exactly with the Market Maker Sell Model:
first a liquidity sweep above highs, then a bearish CHoCH, followed by a return to the bearish FVG for a sell entry.
The MMXM indicator visually marks this sequence liquidity grab, structure shift, and finally a Sell signal during the retracement.
Thus, this indicator is a highly aligned and practical tool for traders using the Market Maker Sell Model, visually presenting high-probability entry zones. Download links:
- Market Maker Model Indicator for MetaTrader 4
- Market Maker Model Indicator for MetaTrader 5
- Market Maker Model Indicator for TradingView
Key Notes Before Using the ICT Market Maker Sell Model
Before the main bearish move begins, the market typically shows a series of technical and behavioral signals across different timeframes. These signals indicate the market maker’s effort to collect liquidity and prepare the structure for the upcoming decline.
Three key points for using the Market Maker Sell Model:
- Bearish Market Structure in Higher Timeframes: The broader market (daily or weekly) must exhibit bearish trends to support price declines;
- Bearish Daily Bias or Liquidity: Daily price direction should align with bearish targets, such as lower liquidity levels (e.g., previous lows);
- Temporary Bullish Moves on Lower Timeframes: Before reaching higher timeframe bearish zones (e.g., PD Array), the price may exhibit temporary bullish retracements on smaller timeframes like 15 or 30 minutes. These moves often precede thecontinuation of the larger bearish trend.
Conclusion
The ICT Market Maker Sell Model is a trading strategy based on analyzing bearish market structures, identifying liquidity, and entering trades at optimal zones like the Fair Value Gap.
This ICT strategy reduces risk and improves trading outcomes by using confirmations like market structure shifts and risk management (stop-loss and profit targets).
You can practice and learn the setups for this strategy using the MMXM Indicator (Market Maker Buy/Sell Model). In addition, By using One Shot One Kill TradingView indicator from TradingFinder, you can merge the Market Maker Sell Model strategy with the One Shot One Kill strategy. This combination enables you to develop unique trading setups.


