


Market Structure is a tool for analyzing price behavior and identifying movement trends in Forex Market and cryptocurrency markets.
This concept can be used to understand market changes and fine-tune trading strategies.
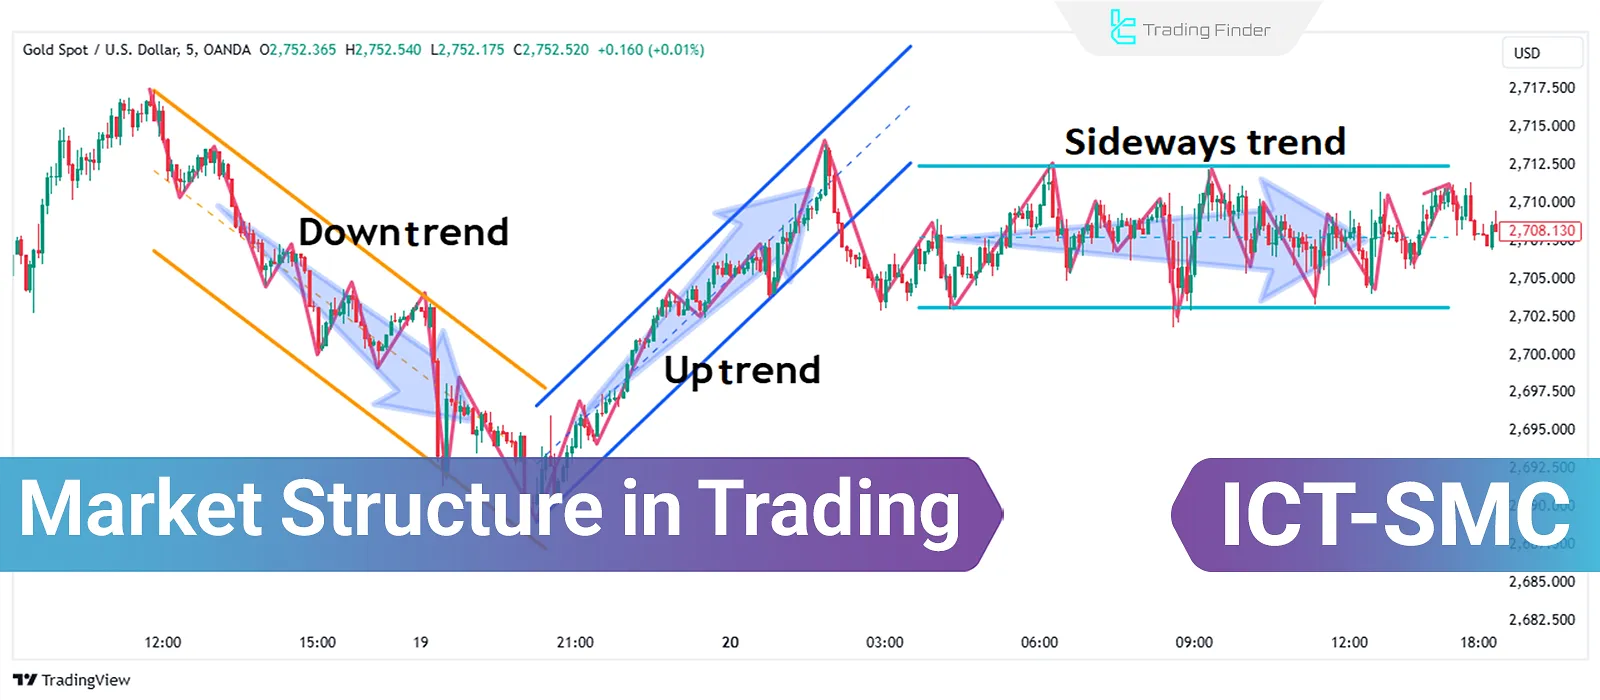
What is Market Structure?
Market Structure includes actual price behavior, the formation of reversal points, and price movements. This structure determines the market trend (bullish, bearish, or ranging).
Accurately identifying these structures is crucial, as they help in setting trade direction and determining entry and exit points.
Pros and Cons of Using Market Structure in Trading
The table below provides a complete overview of the advantages and disadvantages of using market structure in trading:
Pros | Cons |
Ability to Accurately Identify Trends and Their Changes | Possibility of False Signals in Volatile and Unstable Markets |
Provides Suitable Entry and Exit Points in Trades | Requires Experience and Precision for Correct Interpretation |
Improves Risk Management by Determining Key Reversal Points | Challenges In Analyzing Lower Timeframes Due to High Noise |
Types of Market Structure
In general, market structure only occurs in three states: bullish, bearish, and ranging. Below, we will examine each one.
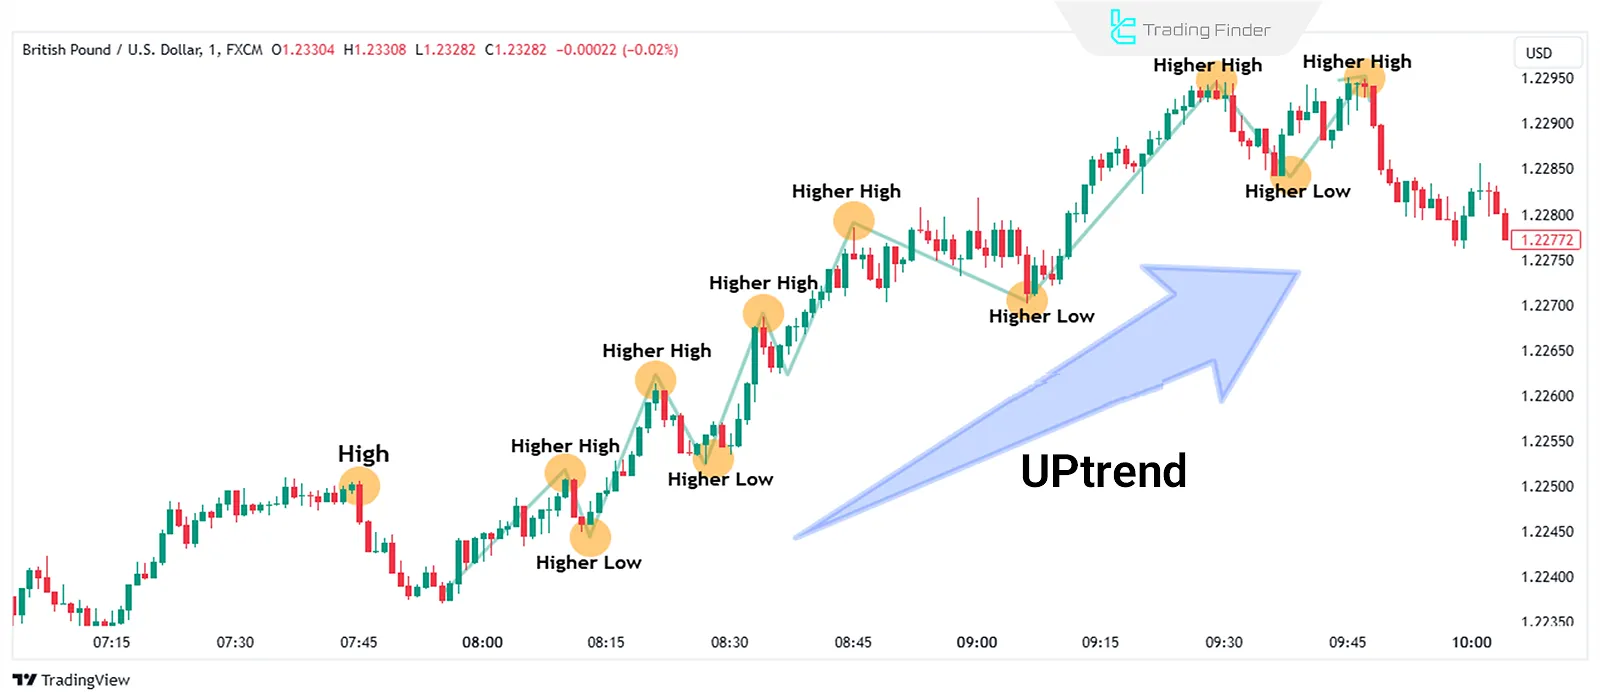
#1 Bullish Market Structure
In a bullish structure, the price moves by forming Higher Highs and Higher Lows . This state is confirmed by breaking the previous day high and indicates a continuation of the uptrend.
The formation of a new Lower Low (LL) compared to the previous low is the first sign of a trend change in a bullish market.
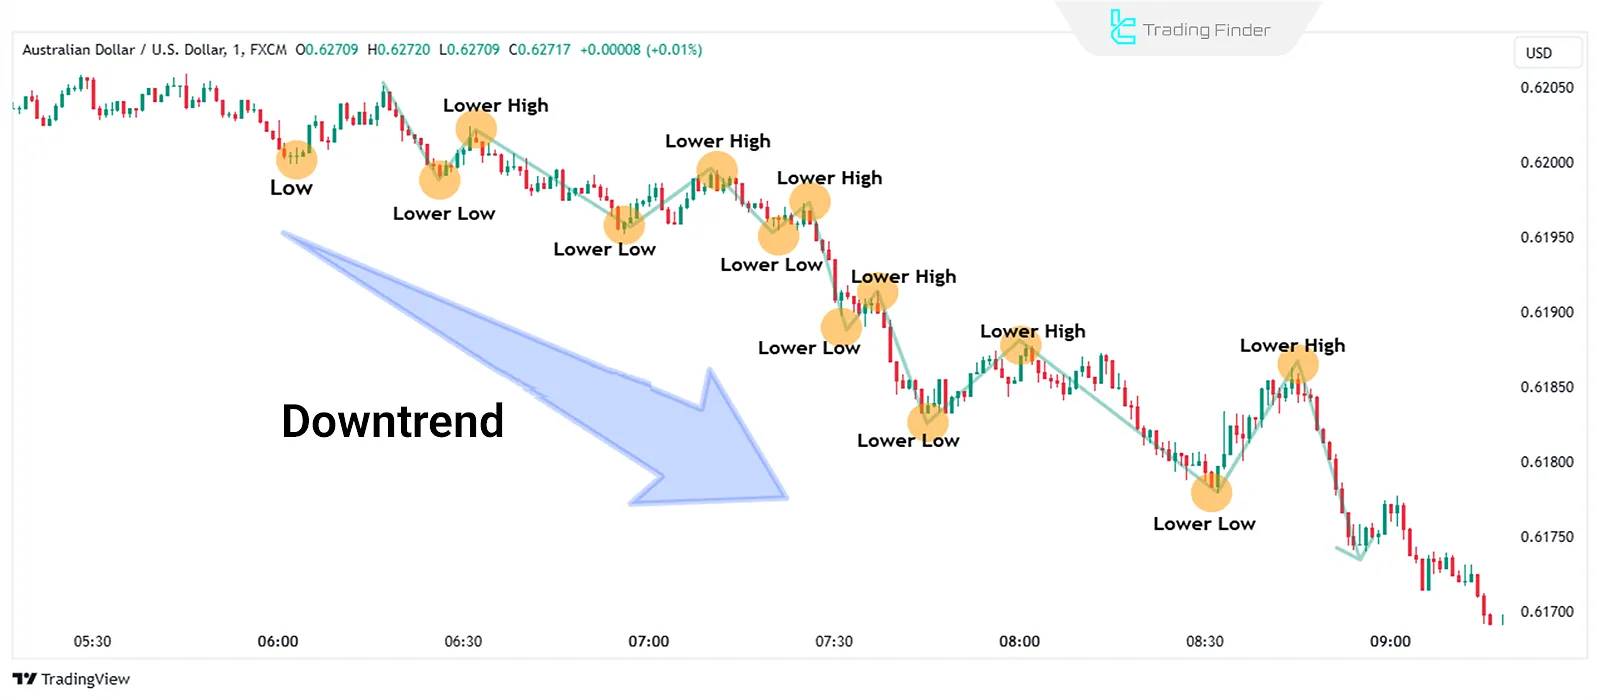
#2 Bearish Market Structure
In a bearish structure, the price moves by forming Lower Highs and Lower Lows. Breaking the previous low indicates a continuation of the downtrend.
Additionally, if a Higher High (HH) forms compared to the previous high, there is a possibility of a trend reversal from bearish to bullish.
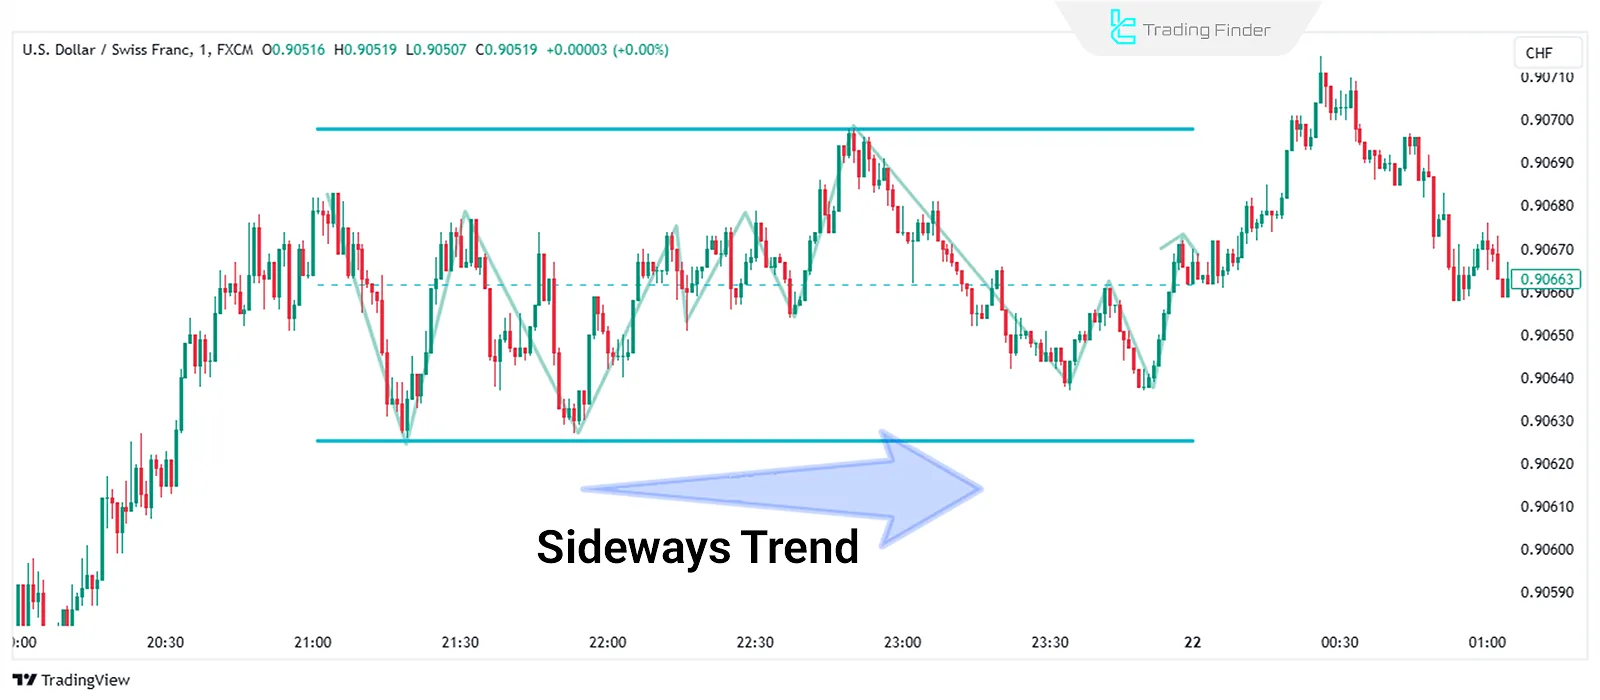
#3 Ranging Market Structure
In a ranging structure (Sideways Trend), the price moves within a defined range between fixed highs and lows.
This state is suitable for short-term trades, and focusing on breaking this range determines the market direction. This type of structure is often observed in lower timeframes.
How to Identify Market Structure in Different Timeframes
Although market structure is observable in all timeframes, its presentation varies in each. Higher timeframes usually display more stable and reliable structures.
In contrast, lower timeframes are less analyzable due to higher noise (small fluctuations). Combining Top Down Analysis is the best approach for accurately identifying market structure.
Identifying Changes in Market Structure
Changes in market structure are typically identified by breaking key points such as highs (HH) or lows (LL).
In an uptrend, breaking the previous low indicates a shift to a downtrend, while in a downtrend, breaking the previous high suggests a shift to an uptrend. These changes are often accompanied by displacement (rapid price movements).
Key Points in Market Structure Analysis
For a more precise market structure analysis, consider the following tips:
- Accurately identifying actual highs and lows on the chart to determine key points
- Focusing on clear breakouts and ignoring unnecessary noise on the chart
- Using market structure alongside tools such as ICT PD Array (Premium/Discount Zones) to confirm the analysis
- Comparing multiple timeframes to improve overall market perspective
- Utilizing volume analysis to confirm breakouts and identify liquidity flow
- Continuously practicing market structure identification in different conditions
- Ensuring market structure alignment across higher and lower timeframes
Conclusion
Market structure is a fundamental concept in technical analysis of financial markets that examines the price behavior and market direction based on highs and lows.
This structure appears in three forms: bullish, bearish, and ranging, each representing specific market conditions.
Accurately identifying these structures across different timeframes and combining them with structural data and other technical tools is essential for detecting trends and key reversal points.


