


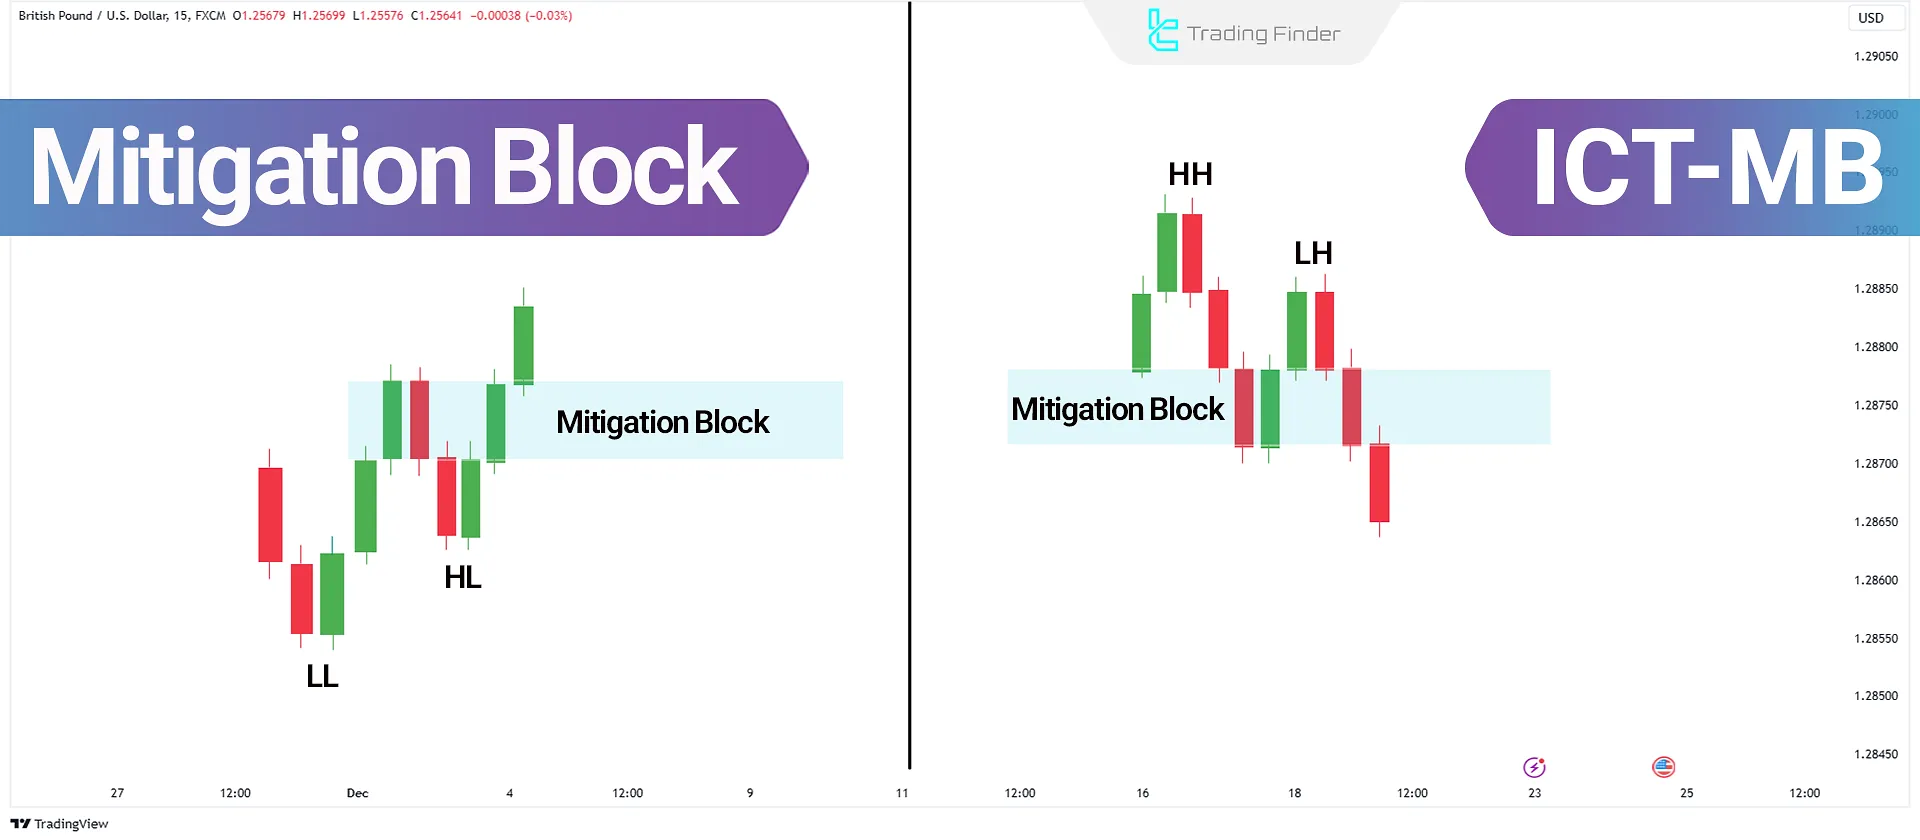
A Mitigation Block (MB) is a type of Order Block in the ICT Style. It disrupts the current market trend and alters the market structure.
The Mitigation Block ICT continues the market's current trend and breaks the previous high or low. Thus, it acts as a support or resistance level for the next price movement.
After this break, the price usually returns to retest the same zone so that the leftover orders can be filled. As a result, this block is the point where the main market direction is often identified, and the low risk institutional entry occurs in that area.
What is a Mitigation Block?
A Mitigation Block (MB) is a zone where market makers settle orders before a price direction changes. This area often acts as a support or resistance level.
In this zone, the pending smart-money orders are settled and the new price path is formed. The precise reaction of price to the MB makes it one of the most reliable areas for identifying the beginning of the next move. Mitigation block formation training from the FXOpen website:

Why is the Mitigation Block Important?
The mitigation block is one of the key points in the ICT style; a point where price behavior deviates from the usual pattern and signs of smart-money entry appear.
Educational video on using the mitigation block from the TTrades YouTube channel:
This zone is usually formed when the previous trend is unable to continue and the market needs to pull back or start a new move.
For this reason, the Mitigation Block (MB) acts as a guide for traders regarding the shift in order flow. Reasons why the mitigation block is important:
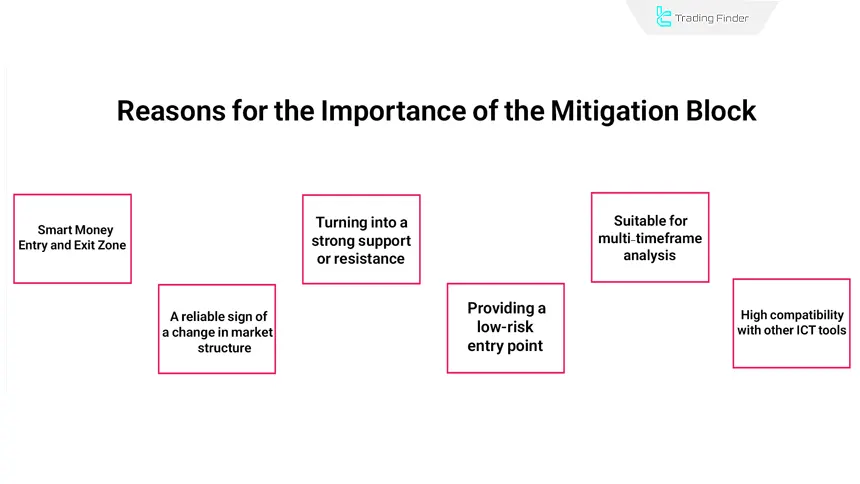
Smart-money Mitigation Block Entry Model and Exit Zone
The most important reason for the significance of the mitigation block is the active presence of large capital within this zone.
Smart money typically settles its open orders in this area before changing direction. Therefore, this zone is effectively the starting point of a new market movement, and paying attention to it can place the trader in alignment with the main flow.
A Reliable Sign of Market Structure Change
When the price is unable to create a new high or low, the first warning of a structure shift appears.
The mitigation block turns this warning into a confirmation. As the price reaches the MB, a reversal toward the new trend becomes highly probable, making this block one of the most reliable points for analyzing market structure.
Turning into a Strong Support or Resistance
After forming the mitigation block, this zone usually turns into a valid level:
- In a bullish scenario: it acts as support
- In a bearish scenario: it acts as resistance
The strength of this zone comes from smart-money behavior and the liquidity within it. This is what creates the high accuracy of price reactions in this area.
Providing a Low-Risk Entry Point
Many ICT traders consider the MB one of the best areas for entry. After the block forms, price typically returns to it once more, and this return provides a low-risk point to position in the new direction.
The result is usually precise entry, a small stop-loss, and a favorable risk-to-reward ratio.
High Compatibility with Other ICT Tools
The mitigation block is very useful on its own, but when combined with tools such as liquidity, order blocks, FVGs, or market structure shifts, its accuracy increases significantly. This harmony makes MB one of the core components of smart-money analysis.
For this reason, professional traders often use MB as the final confirmation point alongside other structural market signals.
Suitable for Multi-Timeframe Analysis
In higher timeframes, the MB identifies the important zone. In lower timeframes, the precise entry point can be found. This compatibility allows scalpers, intraday traders, and swing traders alike to benefit from the mitigation block.
This flexibility makes the MB act as a bridge between the overall market structure and precise entry points.
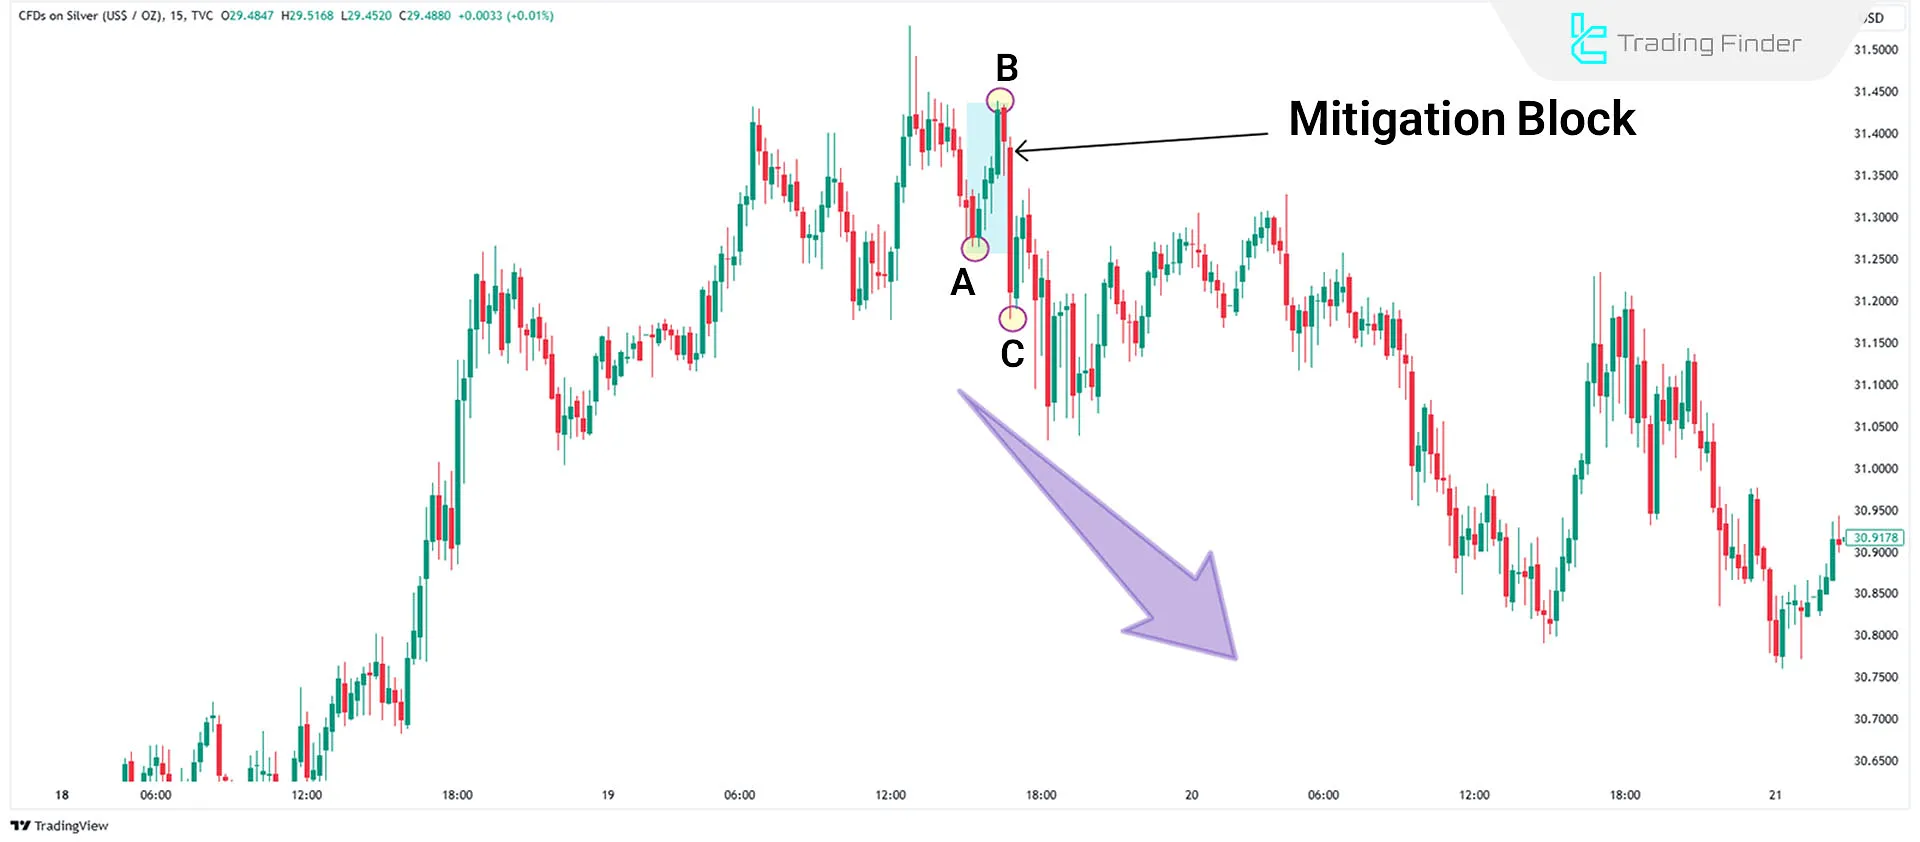
Example of a Mitigation Block
The price initially moved upward in the XAG/USD 15-minute chart, forming higher highs (HH) and higher lows (HL).
Upon reaching a bearish reference area, it could no longer create a new high and began to decline.
Then, the price broke the previous low, turning the market structure bearish. This formes the Mitigation Block, and subsequently, the price returnes to this block, providing a suitable selling opportunity.
How to Identify a Mitigation Block?
To identify and trade the mitigation block, we divide it into two types. First, we must determine whether the market has made a continuation move and broken the previous high or low.
Then, we look for the last counter-direction candle within that same move, which serves the role of collecting liquidity and creating the point of reversal.
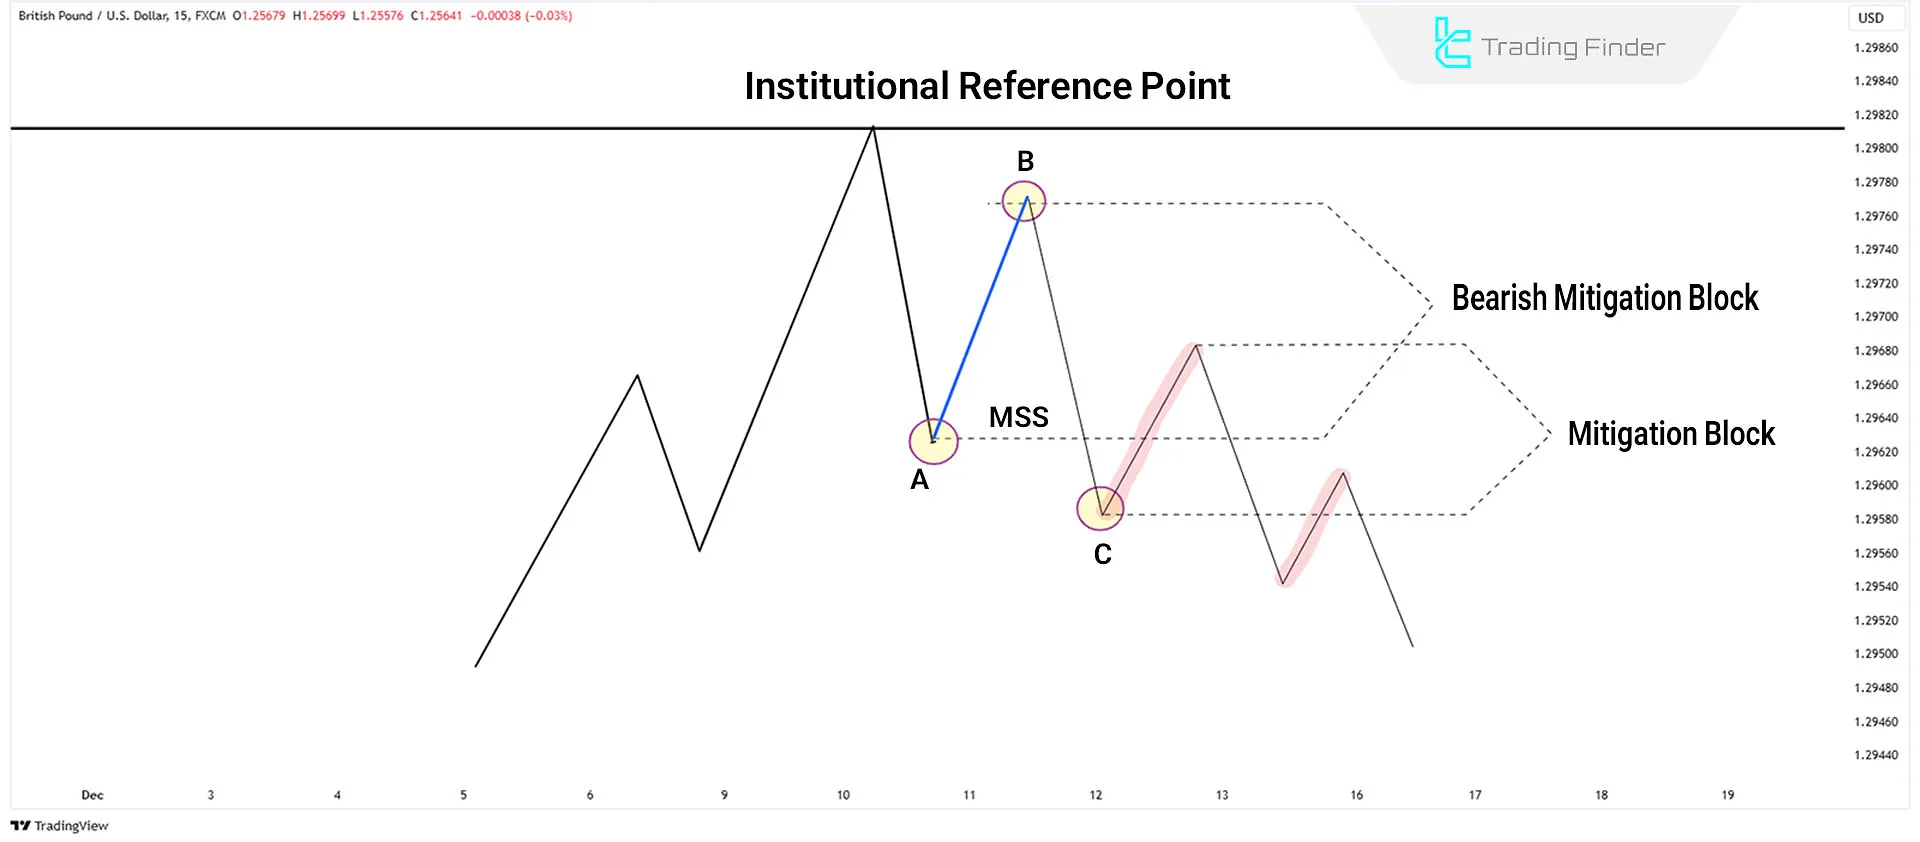
#1 Bearish Mitigation Block
This block forms at the end of an upward trend. When the price reaches a strong bearish level, it fails to create a higher high (HH) and instead forms a lower high (LH).
Then, it breaks below the previous higher low (HL), signaling a market structure change toward bearishness.
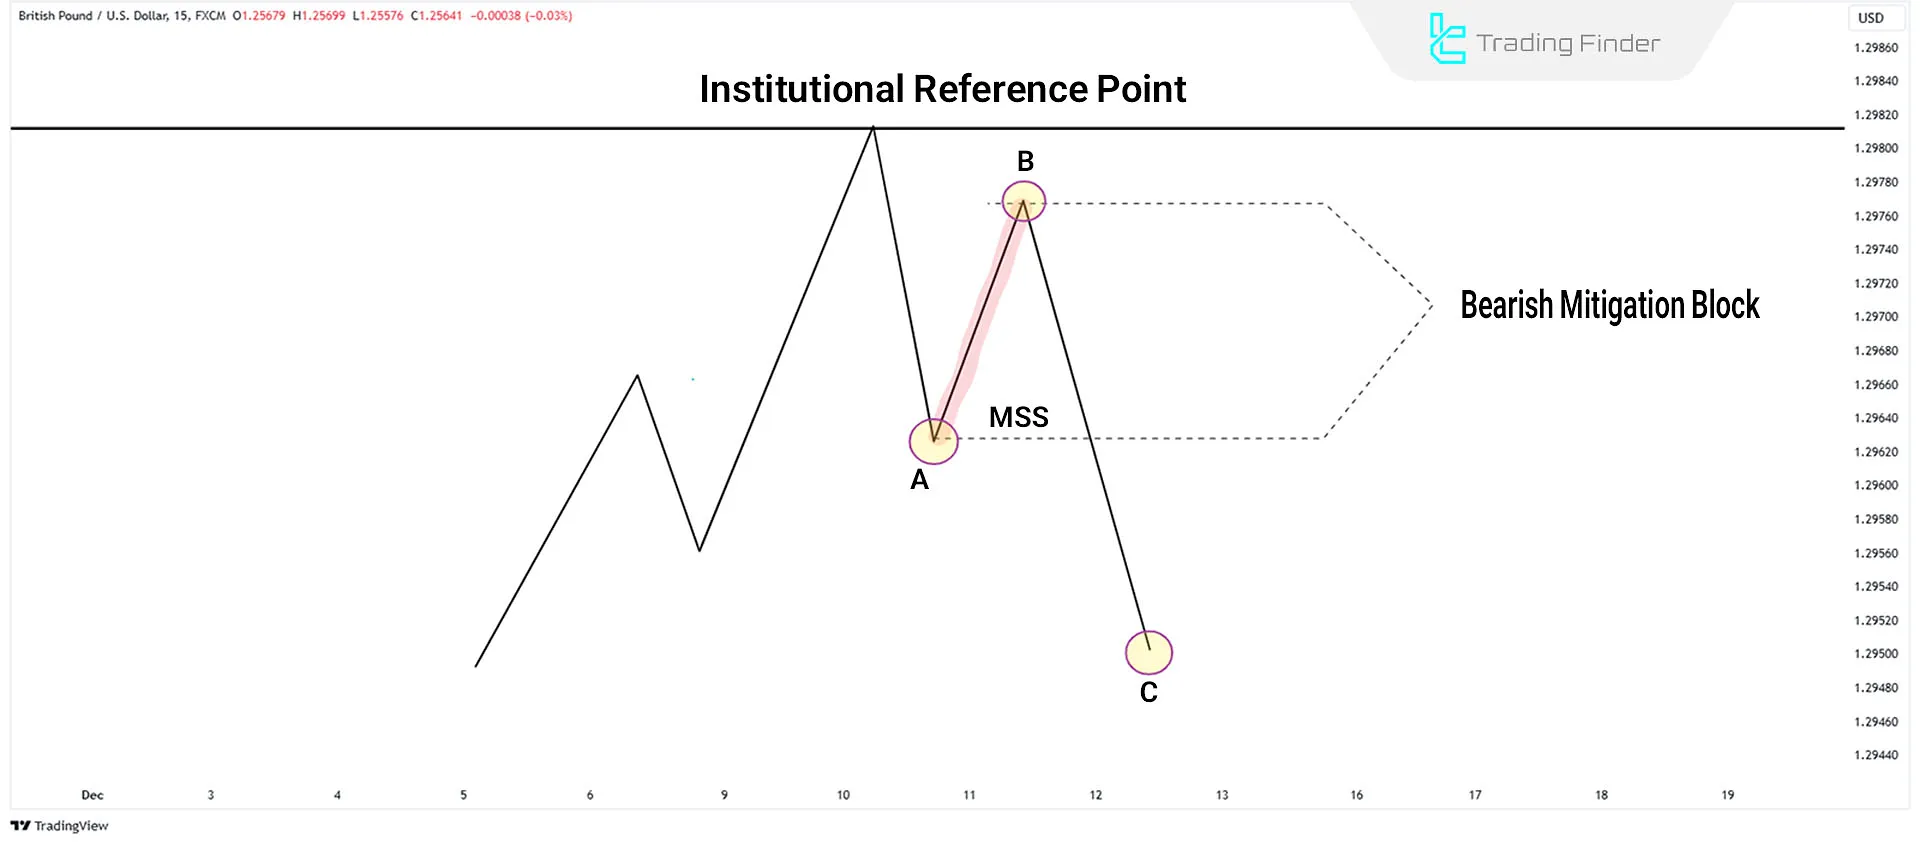
Steps to Identify a Bearish Mitigation Block
When the market in an uptrend reaches an important zone, signs of weakness and liquidity collection by institutions usually appear.
In such conditions, the bearish mitigation block acts as the point where pending buy orders are completed, creating the basis for the start of a downward move.How to identify a bearish mitigation block:
- The price reaches a key level on a higher timeframe;
- On a lower timeframe, this sequence occurs:
- The price creates a Higher High (HH) and a Higher Low (HL)
- The Higher Low (HL) fails to create a new high, and the price breaks below it
- A Break of Structure occurs, forming a Lower High (LH).
Note: The area between the broken low and the Lower High (LH) is the Bearish Mitigation Block.
This zone marks where traders reduce their losses in the rally, and smart Money initiates selling.
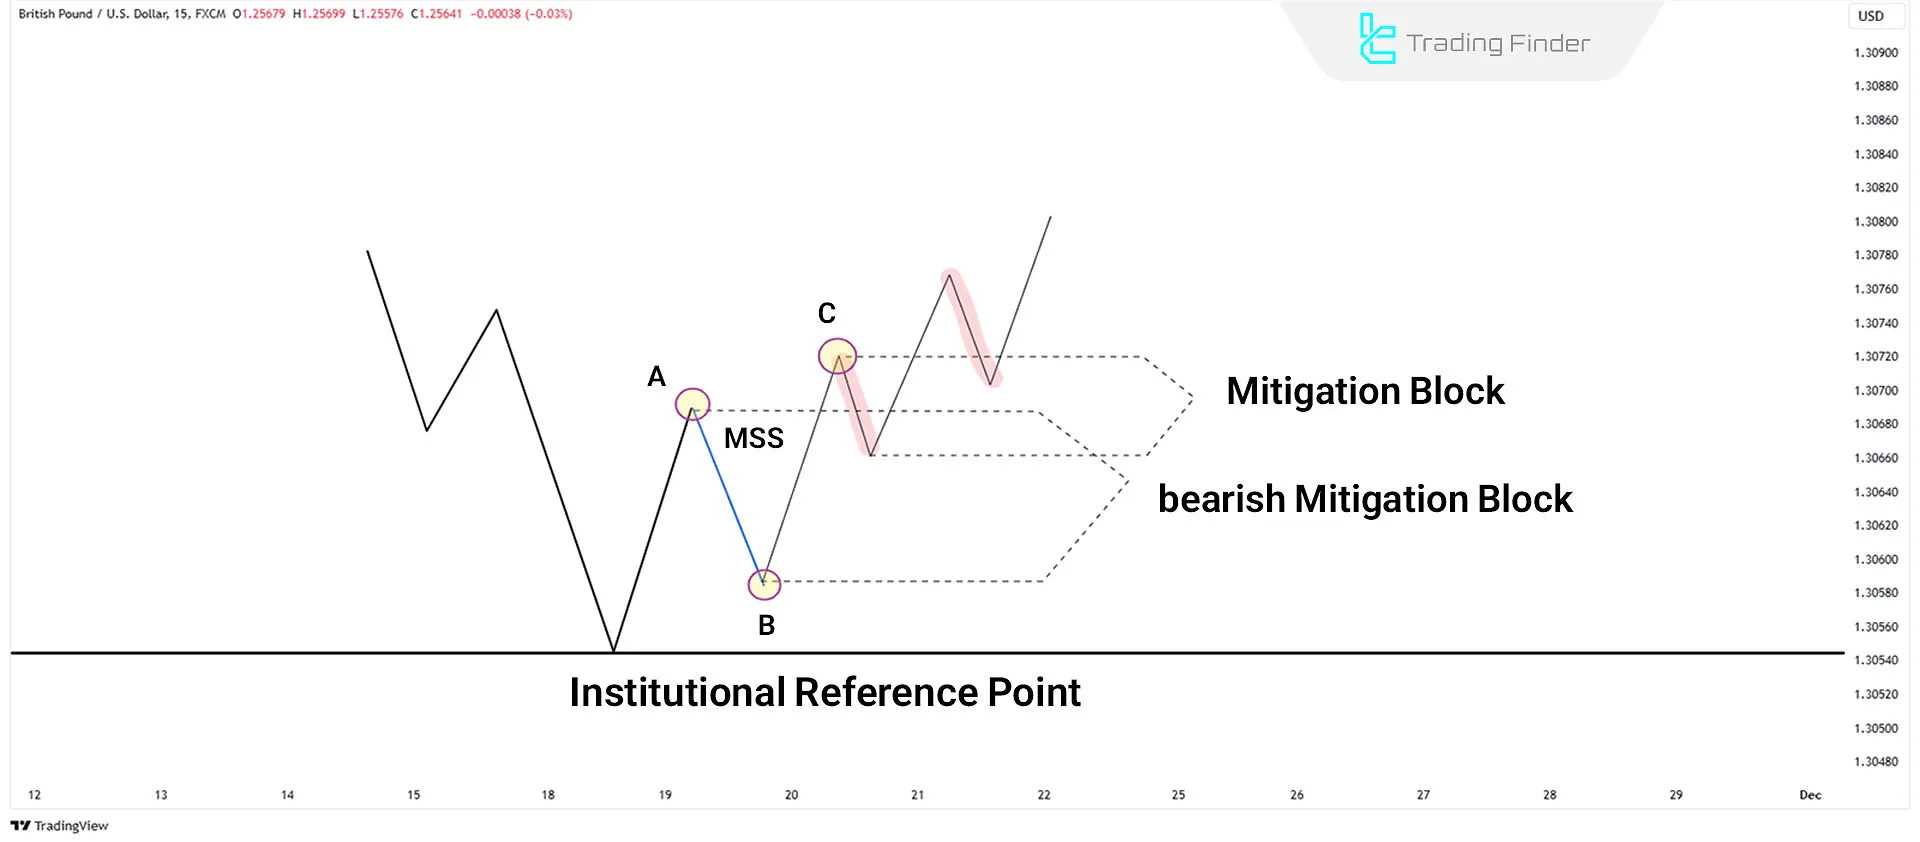
#2 Bullish Mitigation Block
This block forms at the end of a downward trend. When the price reaches a strong support level, it fails to form a lower low (LL) and instead creates a higher low (HL).
Then, it surpasses the previous lower high (LH), signaling a market structure Shift toward bullishness.
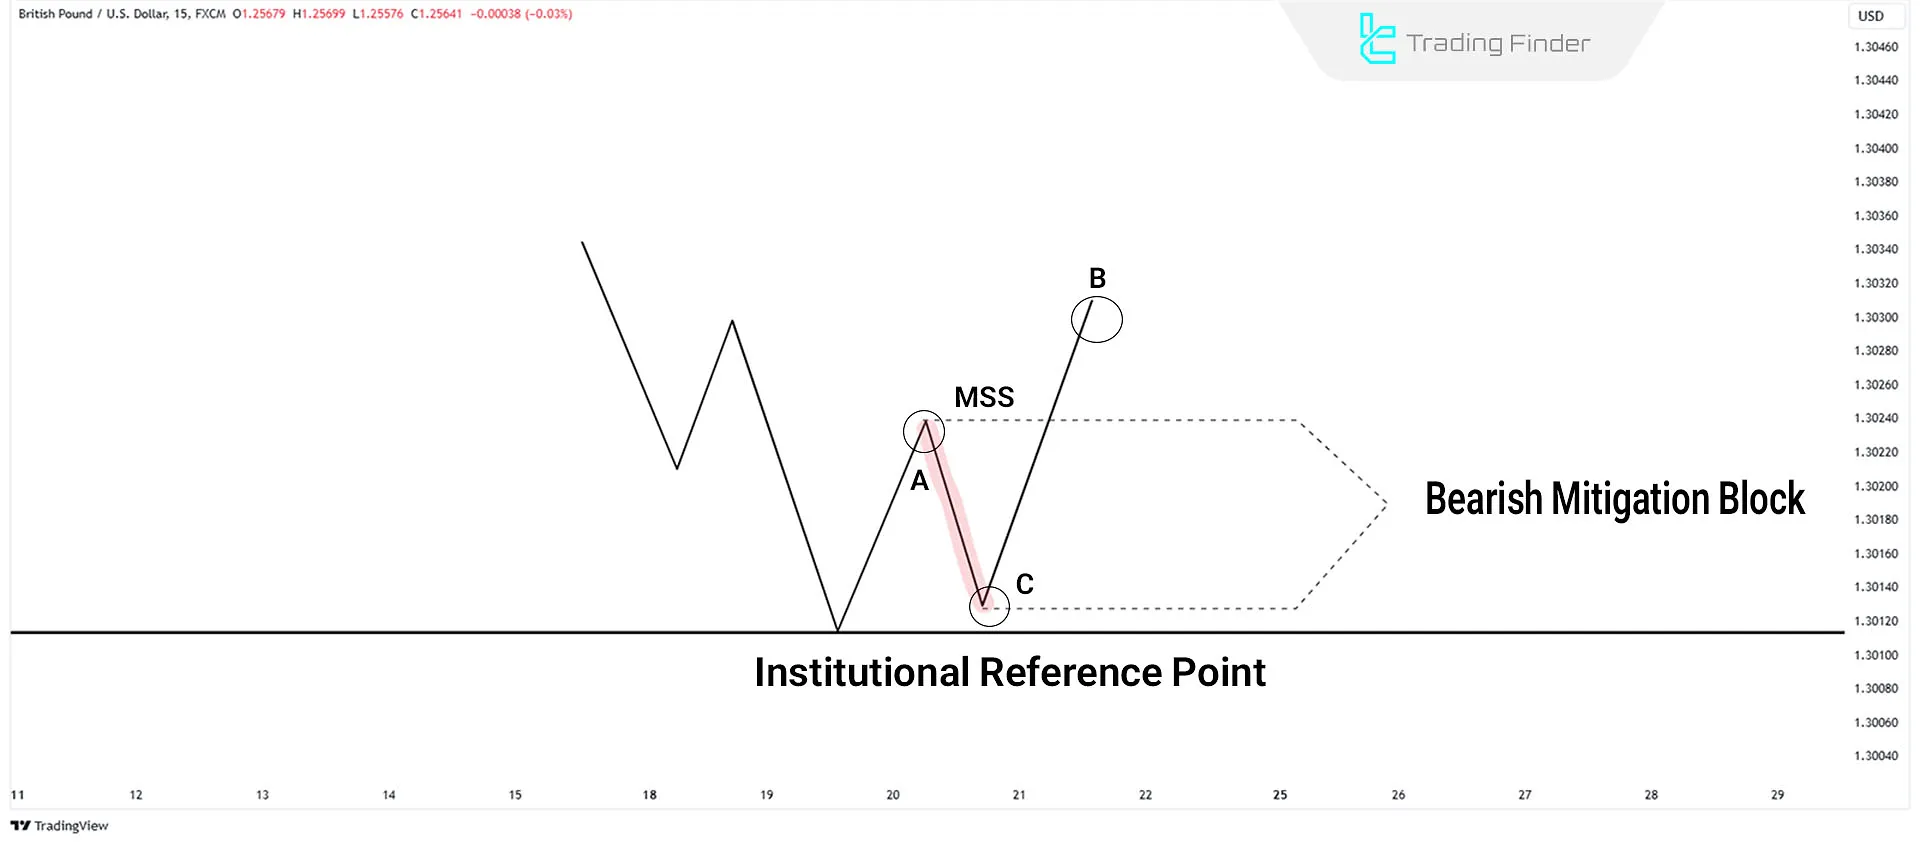
Steps to Identify a Bullish Mitigation Block
When the market in a downtrend enters a key zone, signs of liquidity absorption and decreasing selling pressure are usually observed.
In such conditions, the bullish mitigation block acts as the zone where pending sell orders are completed, paving the way for the beginning of a strong upward move.How to identify a bullish mitigation block:
- The price reaches an important support zone on a higher timeframe;
- On a lower timeframe, this sequence occurs:
- The price creates a Lower Low (LL) followed by a Lower High (LH)
- The Lower High (LH) fails to create a new low and the price breaks above it
- A Break of Structure (BOS) occurs, forming a Higher Low (HL).
Note: The area between the broken high and the Higher Low (HL) is the Bullish Mitigation Block. In this zone, traders who sell during the downtrend reduce their losses, and smart Money initiates buying.
Advantages and Disadvantages of the Mitigation Block
Comparing the advantages and disadvantages of the mitigation block is essential for using it correctly in ICT analysis. This zone is a precise tool for identifying smart-money entry and market structure shifts, but it also has its own limitations and failure conditions.
Table of advantages and disadvantages of the mitigation block:
Advantages | Disadvantages |
Smart-money entry zone | Need for experience for accurate identification |
Low-risk entry point | Possibility of errors in lower timeframes |
Turns into strong support/resistance | Weak performance in ranging markets |
High alignment with ICT tools | High dependence on multi-timeframe analysis |
Confirms market structure change | Possibility of fake-outs and rapid reversals |
Suitable for scalping and swing trading | Price may not react to the MB in certain conditions |
Increases entry accuracy | Needs to be combined with other tools for higher confidence |
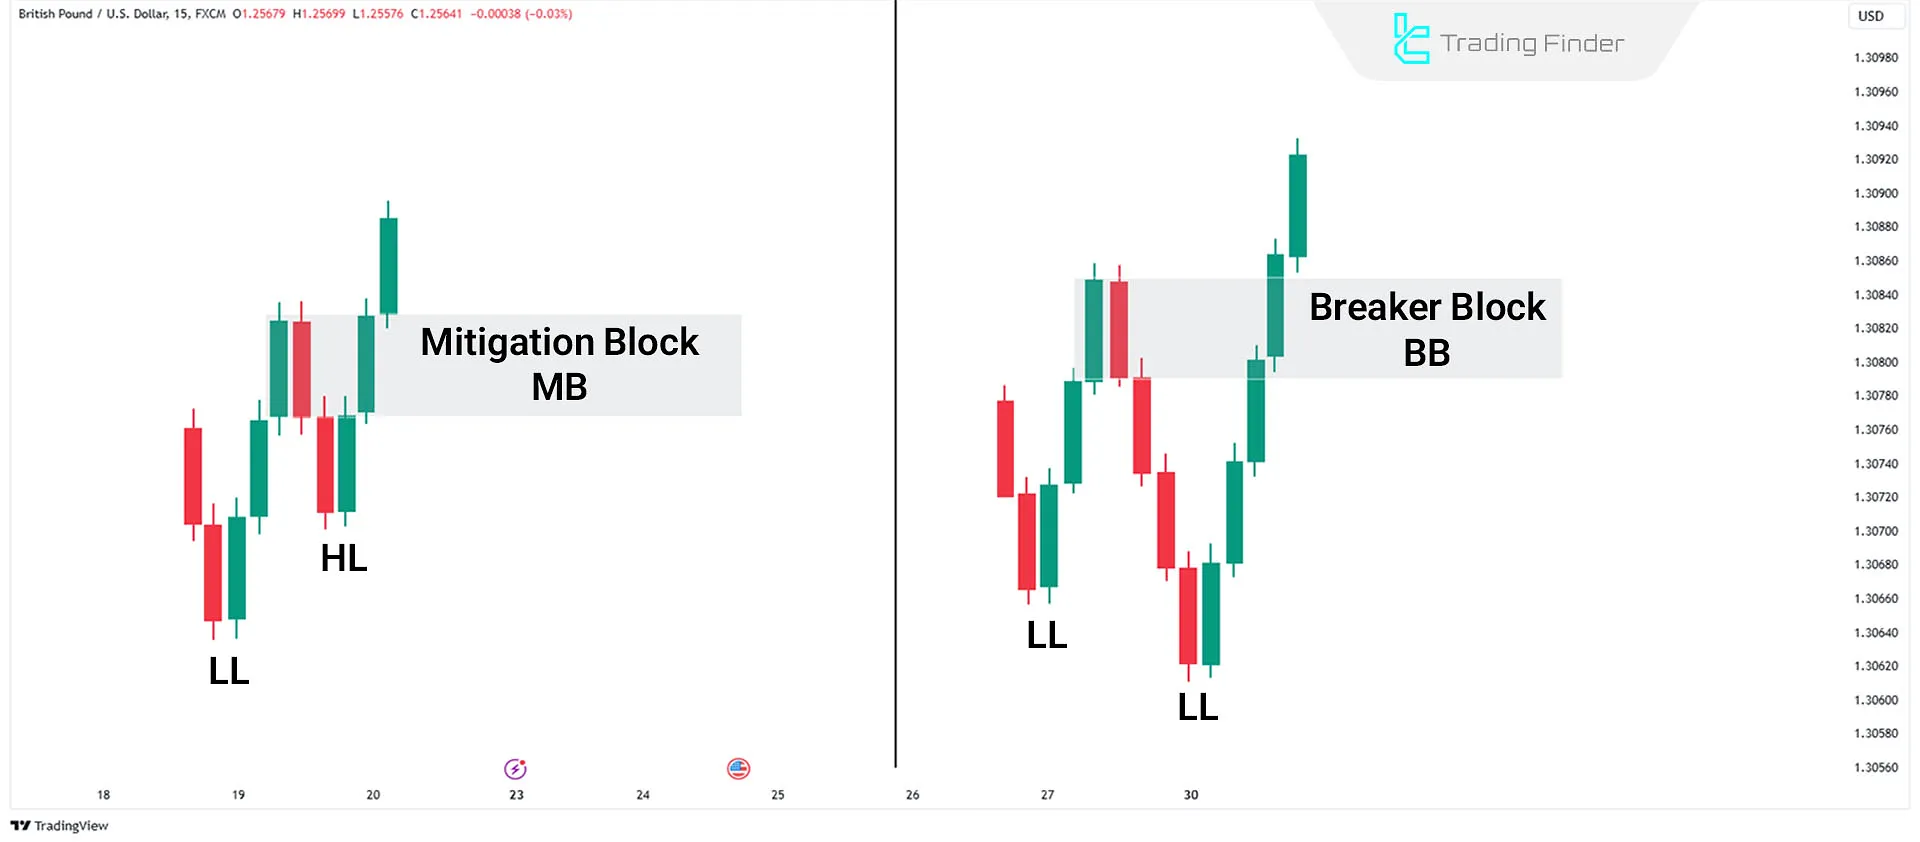
Difference Between Mitigation Block and Breaker Block
Although Breaker Blocks and Mitigation Blocks are reversal Breaker Block patterns with significant similarities, there are key differences:
#1 Functionality
Both blocks form in areas where liquidity has been collected, but the way price reacts to these zones and the purpose they serve are different.
Performance of the mitigation block and breaker block:
- Mitigation Block: The zone where smart Money settles pending orders before the price direction changes;
- Breaker Block: The zone where price breaches confirm the break of the previous trend and continue in the new direction.
#2 Market Structure
Understanding the difference between these two concepts in market structure helps the trader determine whether the market is absorbing liquidity or preparing to reverse and start a new trend.
Market structure in the mitigation block and breaker block:
- Mitigation Block: The price doesn't reach or sweep the previous high or low. Instead, it halts and fails to move higher (in an uptrend) or lower (in a downtrend). The market structure then shifts, creating a new direction;
- Breaker Block: This block forms when the price breaks the previous high or low. After this break, the market structure changes, and a new trend begins.
Limitations and Challenges of the Mitigation Block
The mitigation block, despite its high accuracy, has its own limitations. This zone performs poorly in non-trending markets, and sometimes due to rapid volatility, it does not offer a reliable reaction.
Correct identification of the MB also requires experience, because its strong similarity to the order block and breaker block often leads to mislabeling.
In some conditions, the price moves without returning to the block, causing the entry opportunity to disappear. For this reason, the MB only makes sense alongside other ICT tools, and using it in isolation carries high risk.
Challenges and limitations of using the mitigation block:
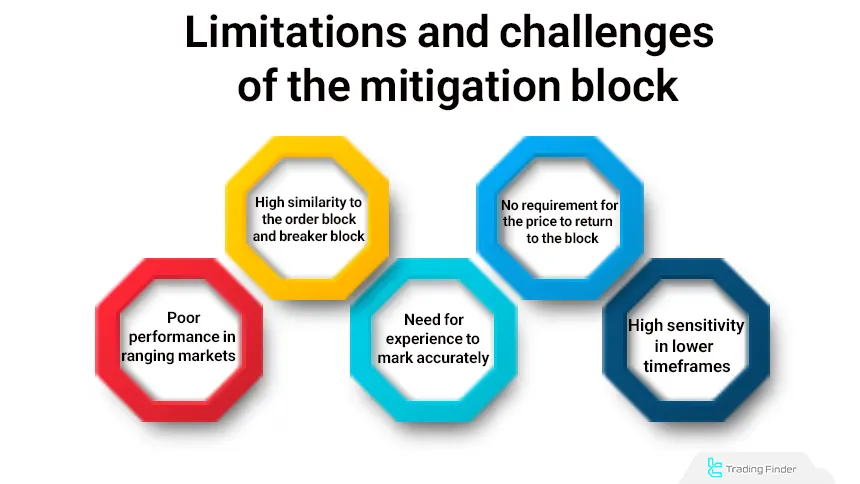
Poor Performance in Ranging Markets
In ranging markets, there is no clear direction and the price constantly oscillates between two confined levels. In such conditions, the structures needed for forming a mitigation block are not clearly visible, and the price crosses the zone multiple times.
These repeated swings make identifying the MB difficult and increase the likelihood of fake-outs. As a result, the block’s reliability in such conditions decreases significantly.
High Similarity to Order Blocks and Breaker Blocks
The mitigation block zone visually appears very close to order block and breaker block structures. The differences between these three areas are subtle, and this similarity causes misidentification.
Selecting the wrong zone as the MB changes the analysis path and puts the trader in an unsuitable position. This challenge is less common for experienced traders but very frequent for beginners.
Need for Experience to Mark Accurately
Choosing the correct zone for a mitigation block requires skill. Determining whether the block is formed from the candle body, the wick, or a combination of both is not always clear.
Errors in marking lead to entries at the wrong level or incorrect stop-loss placement. For this reason, beginners often struggle with defining the exact boundaries of the block.
No Requirement for Price to Return to the Block
The return to the mitigation block does not always happen. Sometimes the market moves in the same direction after forming the MB without any retracement, and the block never gets touched.
This happens especially during low-liquidity conditions or strong news events. The result is losing the ideal entry point and needing to look for a new structure.
High Sensitivity in lower Timeframes
In small timeframes, rapid movements and noise lead to unreliable reactions. The price may approach the zone multiple times and behave differently each time.
These sudden changes prevent clean and controlled reactions and increase the probability of false breaks. For this reason, trading with MB in lower timeframes requires additional confirmations.
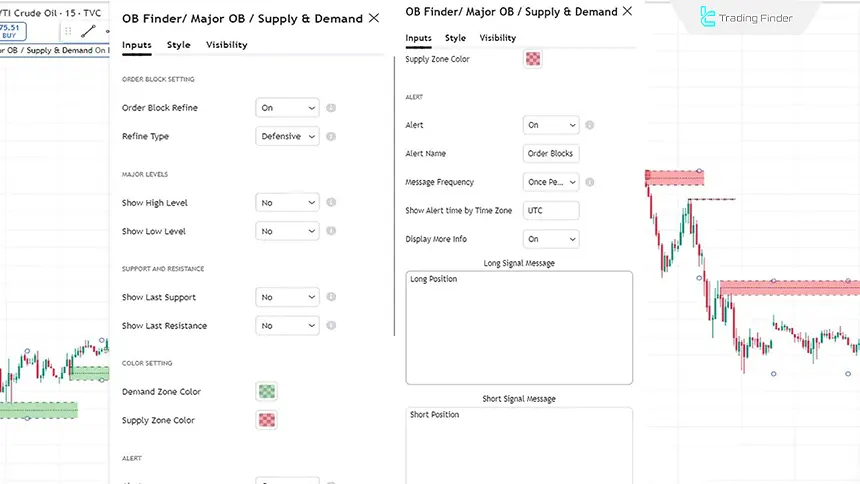
Order Block Finder Indicator in Mitigation Block Analysis
The Order Block Finder Supply & Demand (OBF S&D) indicator is used to identify important buy and sell order zones. This indicator visually displays supply and demand areas, allowing traders to track price behavior more precisely and detect influential zones more quickly.
Its structure is based on showing buy order blocks in green and sell order blocks in red a method that highlights key and reactive market levels.
The areas detected by OBF S&D are usually zones where significant liquidity has accumulated and unfilled orders remain. Educational videos for using the Order Block Finder indicator:
Price interaction with these zones often leads to recognizable reactions such as reversals, slowing momentum, or direction changes. This makes the indicator highly useful for smart-money traders, including those who use ICT concepts.
The indicator also has a notable relationship with the Mitigation Block (MB).
The MB is a zone where pending smart-money orders are collected before a market reversal. It acts as a strong support or resistance area and is usually the starting point of a new structure.
By accurately displaying supply and demand zones, the OBF S&D indicator helps traders identify blocks that have the potential to become mitigation blocks.
In other words, the indicator highlights zones that may serve as locations for large order settlement and order-flow reversal exactly what the MB represents.
Furthermore, the indicator’s extensive settings (such as block refinement, color selection, alerts, and key-level display) provide high customization.
Traders can activate only the necessary zones on the chart according to their trading style and use it to filter strong blocks.
Overall, the OBF S&D indicator is a practical tool for identifying important order zones and has significant overlap with concepts like the mitigation block.
Using it alongside market structure analysis increases the accuracy of identifying entry and exit points and makes decision-making easier in the ICT style. Download link for the Order Block Finder Supply & Demand indicator:
Conclusion
The Mitigation Block identifies key market zones where the market structure changes. It offers excellent trading opportunities for buying or selling, allowing traders to align with Smart Money movements.
These zones are usually the most precise areas for price reactions and allow the trader to take lower-risk entries. Combining the mitigation block with other ICT tools also increases analytical strength and makes the decision-making process clearer.


