


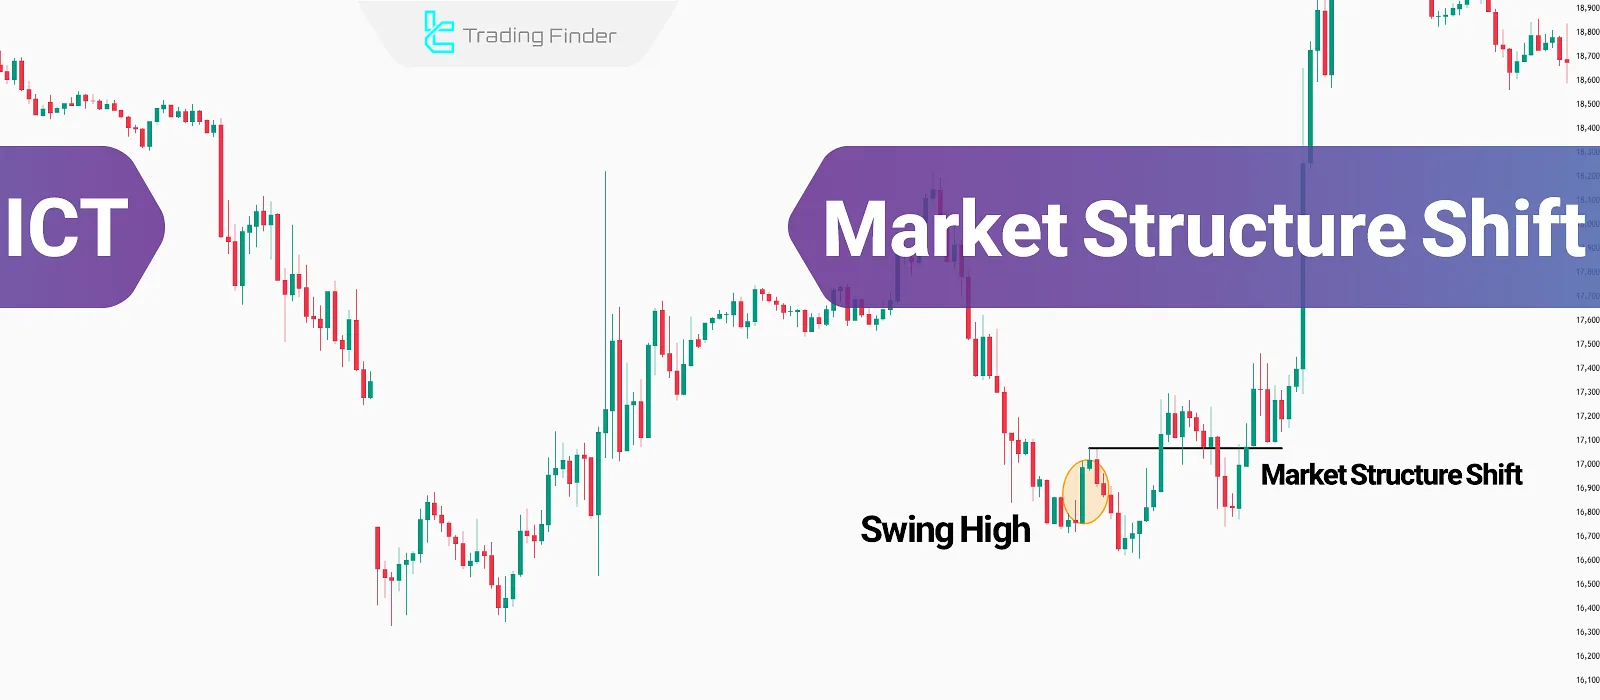
The Market Structure Shift (MSS) in ICT style signifies initial price movements that can lead to a trend reversal or a change in market direction.
This concept is often associated with a sudden break of key levels and an aggressive price displacement move, which plays a crucial role in different trading setups.
Introduction to Market Structure Shift (MSS) in ICT
In various market trends, the formation of MSS often results in the halt of the current trend, price direction change, and the establishment of a new short-term trend.
In some cases, this event serves as an early indication of a long-term trend reversal.
According to the Market Structure Shift Tutorial on the Writofinance website, MSS is one of the main signals of a market trend reversal
Importance of Understanding Market Structure Shift (MSS)
Correct identification of this concept enables traders to determine optimal entry points to capitalize on the new trend. Applications of MSSin technical analysis:
- Early detection of trend reversals
- Optimized entry points and stop-loss placement
- Connection with major market liquidity to prevent stop hunts
- Integration with other trading setups
Key Features of MSS
To correctly identify Market Structure Shift, traders should recognize its core features:
- Break of the last swing high or last swing low abruptly
- Accompanied by an aggressive price displacement move
- Typically occurs after liquidity grabs or stop hunts
Signs of Market Structure Shift (MSS) Formation
MSS in ICT occurs when the last swing high or last swing low isbroken, coupled with an aggressive price displacement move.
On the TTrades YouTube channel, the concept of Market Structure Shift (MSS) is explained visually:
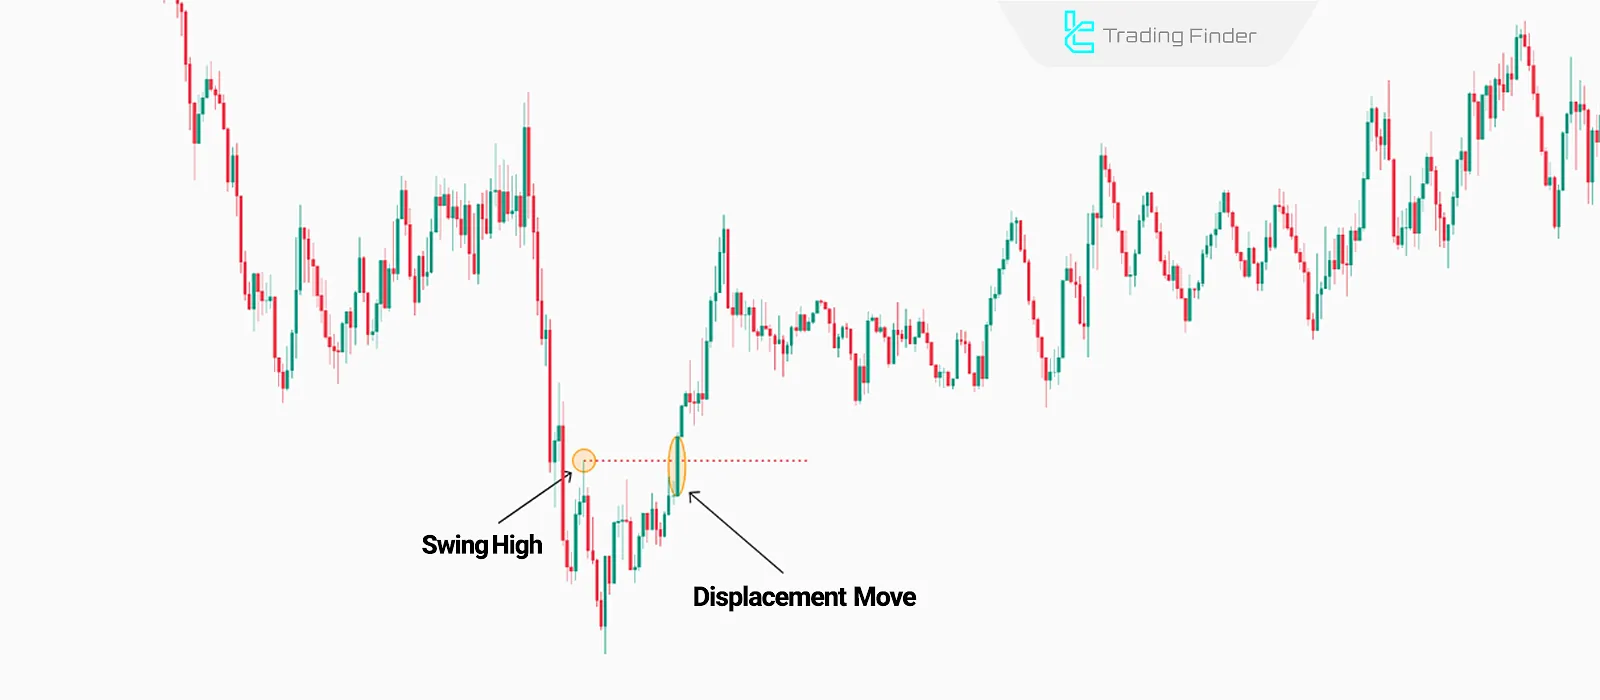
Swing High
A Swing High is a point where the price halts after an upward movement and begins to decline. It typically represents a temporary resistance level at the peak of an uptrend.
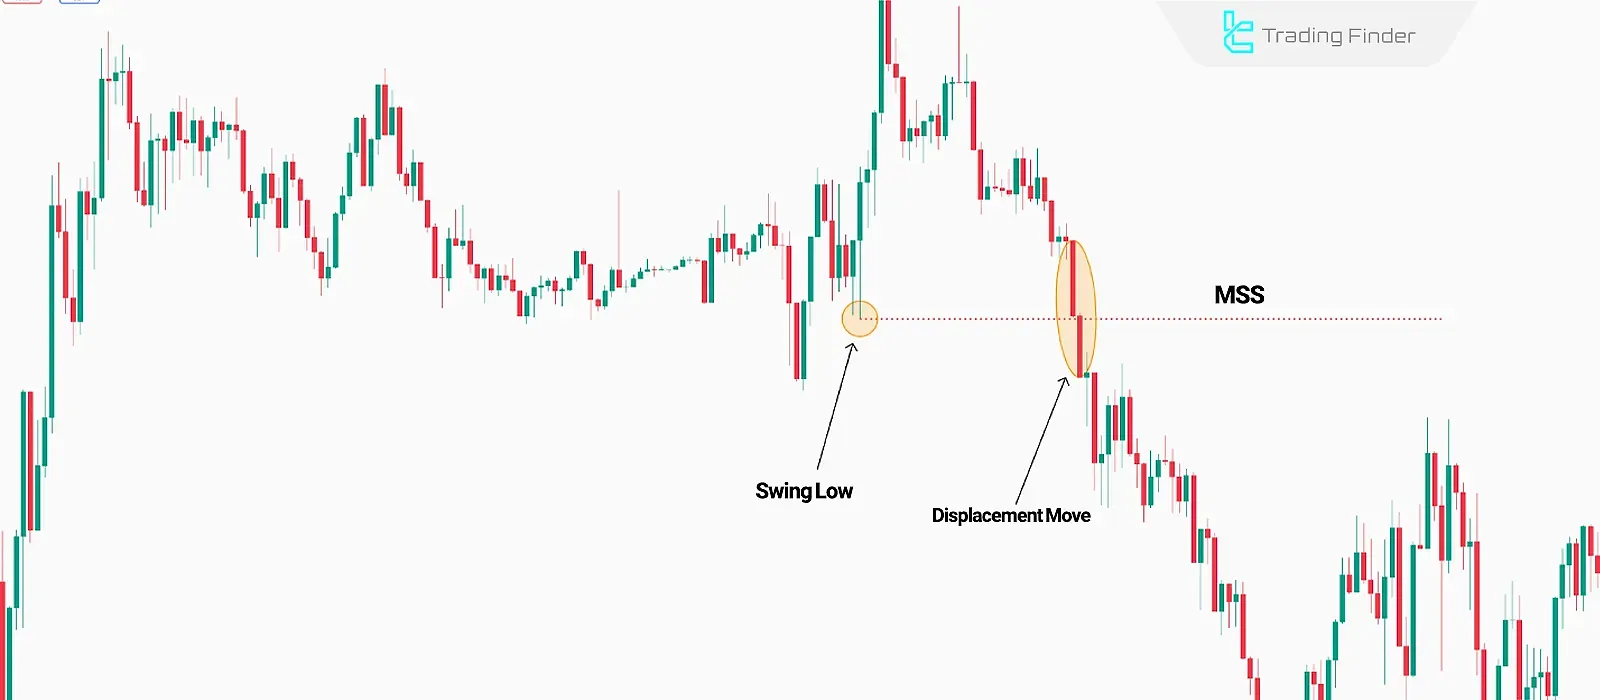
Swing Low
A Swing Low is a point where the price stops declining and starts to rise. It often marks a temporary support level at the bottom of a downtrend.
Definition of ICT Three-Candle for Swing Highs and Swing Lows
In the ICT perspective, swings are the main criteria for measuring a structure break. A Swing High is valid when the high of the middle candle is higher than the highs of the two surrounding candles, and a Swing Low is formed when the low of the middle candle is lower than the lows of the two adjacent candles.
Displacement Move
A Displacement Move refers to a sudden and forceful price shift. In the ICT style, this move signifies the inflow of significant liquidity into the market.
One of the primary confirmation signals for MSS is the break of the last key swing high or low via a strong displacement move.
Trading Guide Based on Market Structure Shift (MSS)
Trading with MSS consists of three main steps:
#1 Determining ICT Daily Bias
By analyzing the Daily (D1) and H4 timeframes, swing highs, swing lows, and liquidity points, traders can identify the daily bias.
#2 Identifying MSS in Lower Timeframes (M5, M15)
The identification of MSS differs between bullish and bearish trends, which can be observed in the MSS completion zones:
- Bullish Trend: MSS is confirmed when a Swing Low is broken with an aggressive displacement move;
- Bearish Trend: MSS is confirmed when a Swing High is broken with an aggressive displacement move;

#3 Confirmation for Trade Entry
Trade entry confirmations based on MSS can be derived from three key methods:
Entering a trade based on a market structure shift can be done through several methods, each carrying a different level of validity.
Different methods of receiving confirmation for entering a trade using MSS:
Entry Method | Brief Explanation | Signal Validity |
Testing the last valid Order Block | Entry after price reacts to the confirmed order block following MSS | High |
Filling the Fair Value Gap (FVG) | Entry after price retraces and fills the FVG | Medium to High |
Confirming Liquidity Grab | Entry after clearing stop losses and triggering hidden liquidity | High |
Formation of a Breaker Block | Entry with a structure break and creation of a new block as a key level | Medium |
Premium/Discount (PD) Arrays | Entry within discount or premium zones of the market | Medium |
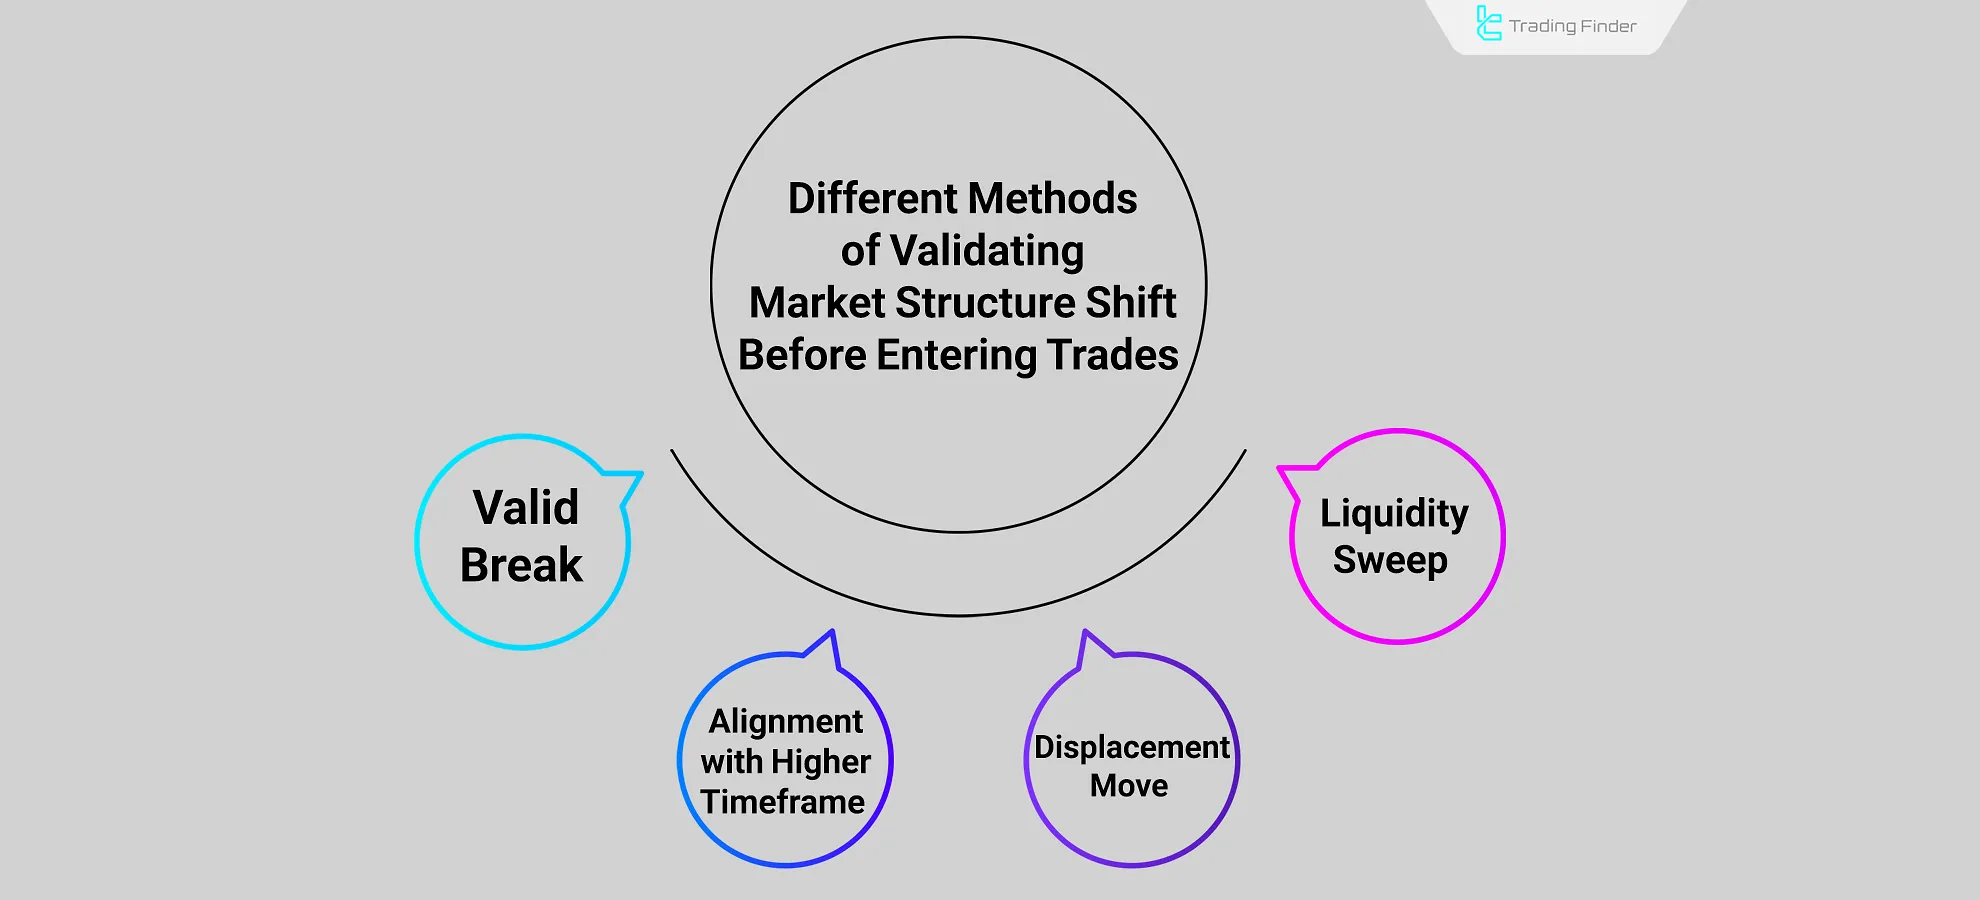
Validating MSS Before Entering a Trade
Not every market structure shift is worth entering. To ensure the MSS pattern is valid, several key conditions should be met:
- Liquidity Sweep: Before the break, the market should have swept a BSL or SSL;
- Valid Break: The break should occur with the candle body, not just the wick;
- Displacement with Fair Value Gap (FVG): The move should be strong, leaving an FVG behind;
- Higher Time Frame (HTF) Alignment: The MSS should align with the bias of the higher timeframe.
Meeting these conditions ensures that the MSS pattern provides a valid trend reversal signal rather than a false move.
Comparison of MSS with Regular Trend Reversals
A trend reversal typically occurs when the pattern of higher highs and higher lows (HH & HL) in an uptrend—or lower highs and lower lows (LH & LL) in a downtrend—gradually shifts, signaling the start of a new trend.
However, MSS occurs suddenly and is accompanied by a strong displacement move, often signaling liquidity manipulation. The table below compares MSS and traditional trend changes:
Parameter | Market Structure Shift (MSS) | Regular Trend Change |
Speed of Change | Sudden and aggressive | Gradual with price corrections |
Break of Range | Breaks Swing Low or Swing High | Gradual shift in price structure |
Main Characteristic | Accompanied by aggressive displacement | Occurs gradually with pullbacks |
Liquidity and Market Manipulation | Often follows liquidity grabs and stop hunts | Primarily due to supply and demand imbalances |
Preferred Timeframes | Lower timeframes (LTF) | Higher timeframes (HTF) |
Trading Style | Short-term trades | Mid-term trades |
Difference Between MSS, CISD, Liquidity Grab, CHOCH, and BOS
Concepts such as CISD, Liquidity Grab, and others may appear similar at first glance, but their behavioral details in the market differ.
To avoid misinterpretation, these concepts can be compared in a table format to clarify their definitions, key signals, and usual outcomes.
Comparison Table of CHOCH, Liquidity Grab, CISD, MSS, and BOS:
Concept | Simple Definition | Main Signal | Usual Outcome |
Market Structure Shift (MSS) | Break of a key swing accompanied by displacement | Candle body breaking an important high/low | Beginning of a new trend |
Change in State of Delivery (CISD) | Change in price movement quality and reaction to FVG | Formation or respect of FVG in the new direction | Change in movement style and price behavior adjustment |
Liquidity Grab | Collecting liquidity followed by a quick reversal | Level taken out with a candle wick and then returned | Continuation of the previous trend |
Change of Character (CHOCH) | Market character shift from bullish to bearish or vice versa | Change in structure from HH/HL to LL/LH and vice versa | Indication of trend ending and start of a new direction |
Break of Structure (BOS) | Structure break in the direction of the existing trend | Key level broken in line with the current bias | Strengthening and continuation of the trend |
Combining MSS with Other ICT Concepts
One of the key advantages of MSS is its flexibility in integrating with other ICT concepts.
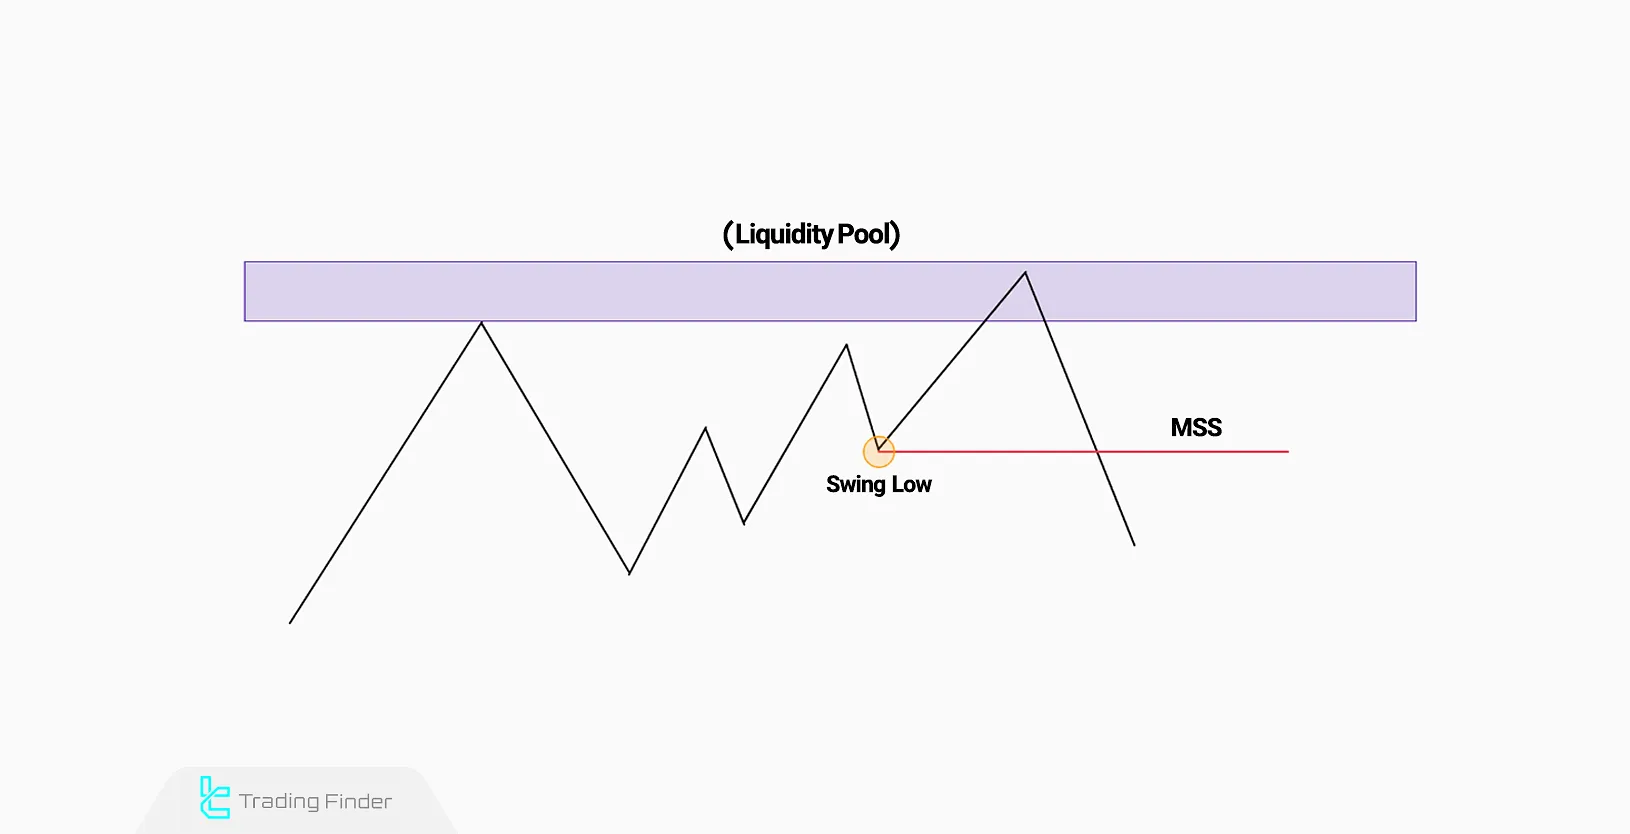
Using MSS with Liquidity Pools
Liquidity Pools are areas in the market where many stop-loss orders and pending orders accumulate, providing significant liquidity.
When price absorbs liquidity from a liquidity pool, the validity of MSS increases.
Example of Integrating MSS with Liquidity Pools
For instance, sellers place their stop-loss orders above swing highs in a bullish trend, creating a liquidity pool. When the price enters the liquidity pool, activating pending orders, liquidity is injected into the market.
After accumulating sufficient liquidity, the price breaks the last valid low, confirming MSS.
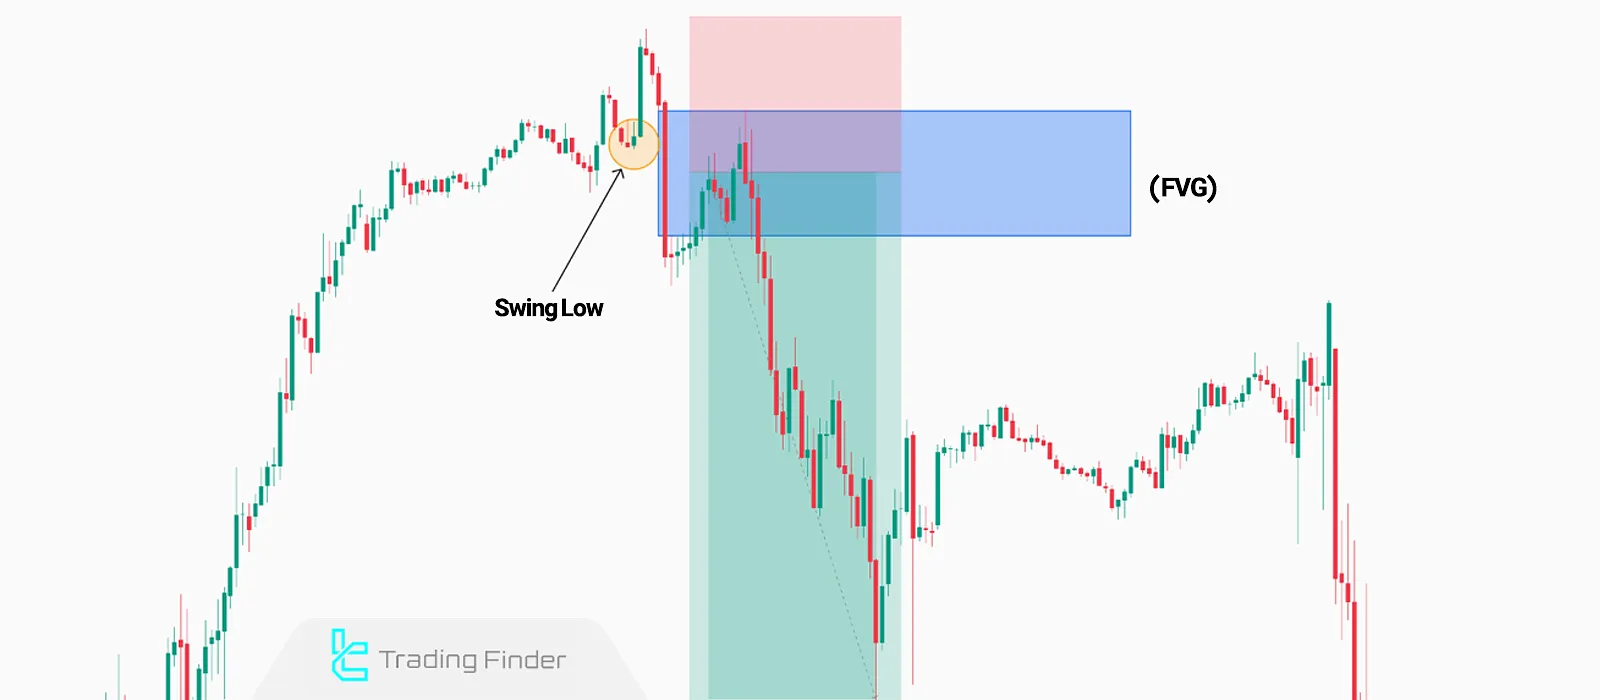
Combining MSS with Fair Value Gaps (FVG)
A Fair Value Gap(FVG) is a gap that forms between the first and third candlesticks in a sequence of three, with a noticeable space between the close of the first candle and the open of the third.
When a Market Structure Shift (MSS) occurs after the break of a swing high or low, it may be followed by the formation of a Fair Value Gap (FVG), providing further confirmation of the trend shift.
Example of MSS & FVG Integration
When MSS forms within an uptrend along with an FVG, the price will likely retrace into the FVG zone before continuing the new trend. Placing an entry order within the FVG zone provides an optimal trade entry point.
Market Structure Inducements Indicator
The Market Structure Inducements Indicator is one of the advanced tools in the ICT style, designed for precise analysis of price behavior within the Smart Money framework.
Market Structure Shift indicator combines key concepts such as Change of Character (CHOCH) , Break of Structure (BOS), and Inducements, providing a clear picture of liquidity shifts and potential market direction.
By plotting colored lines on the chart, it simplifies the identification of important price movements: red for CHOCH, blue for BOS, and gray for price inducements.
This differentiation helps traders recognize trend reversals, key support and resistance breaks, and areas where most market participants are encouraged to enter positions.
The application of this indicator is not limited to Forex; it can also be used in cryptocurrency, stocks, and even commodities markets.
For example, in the GBP/CHF pair, a green candle breaking the CHOCH line on the 15-minute timeframe can signal the start of an uptrend and a suitable opportunity for a long entry.
Conversely, on the ETH/USDT chart, a CHOCH break combined with the identification of an inducement on the 4-hour timeframe generates a strong sell signal.
This indicator is particularly designed for day traders, scalpers, and swing traders, offering customizable settings to adapt to different strategies.
Ultimately, the Market Structure Inducements Indicator is an effective tool for better understanding liquidity cycles and confirming entry and exit points within the context of price action and Smart Money.
Download links for Market Structure Inducements Indicator:
- Download Market Structure Inducements Indicatorfor MetaTrader 4
- Download Market Structure Inducements Indicator for MetaTrader 5
- Add ICT Market Structure Inducements Indicator to TradingView
Conclusion
The Market Structure Shift (MSS) is a key concept in ICT trading methodology. It represents a sudden shift in market direction.
This shift occurs when a swing low or swing high is broken with an aggressive price displacement move, often signaling liquidity manipulation and potential trend reversals.


