


The New York Session Manipulation is a key ICT trading strategy used in daily profiles to understand market behavior and identify high-probability trades.
This Trading strategy works in both Bullish and Bearish markets and relies on tools, such as Fair Value Gaps (FVGs), Order Blocks (OBs), and Premium & Discount zones to identify key trading opportunities.
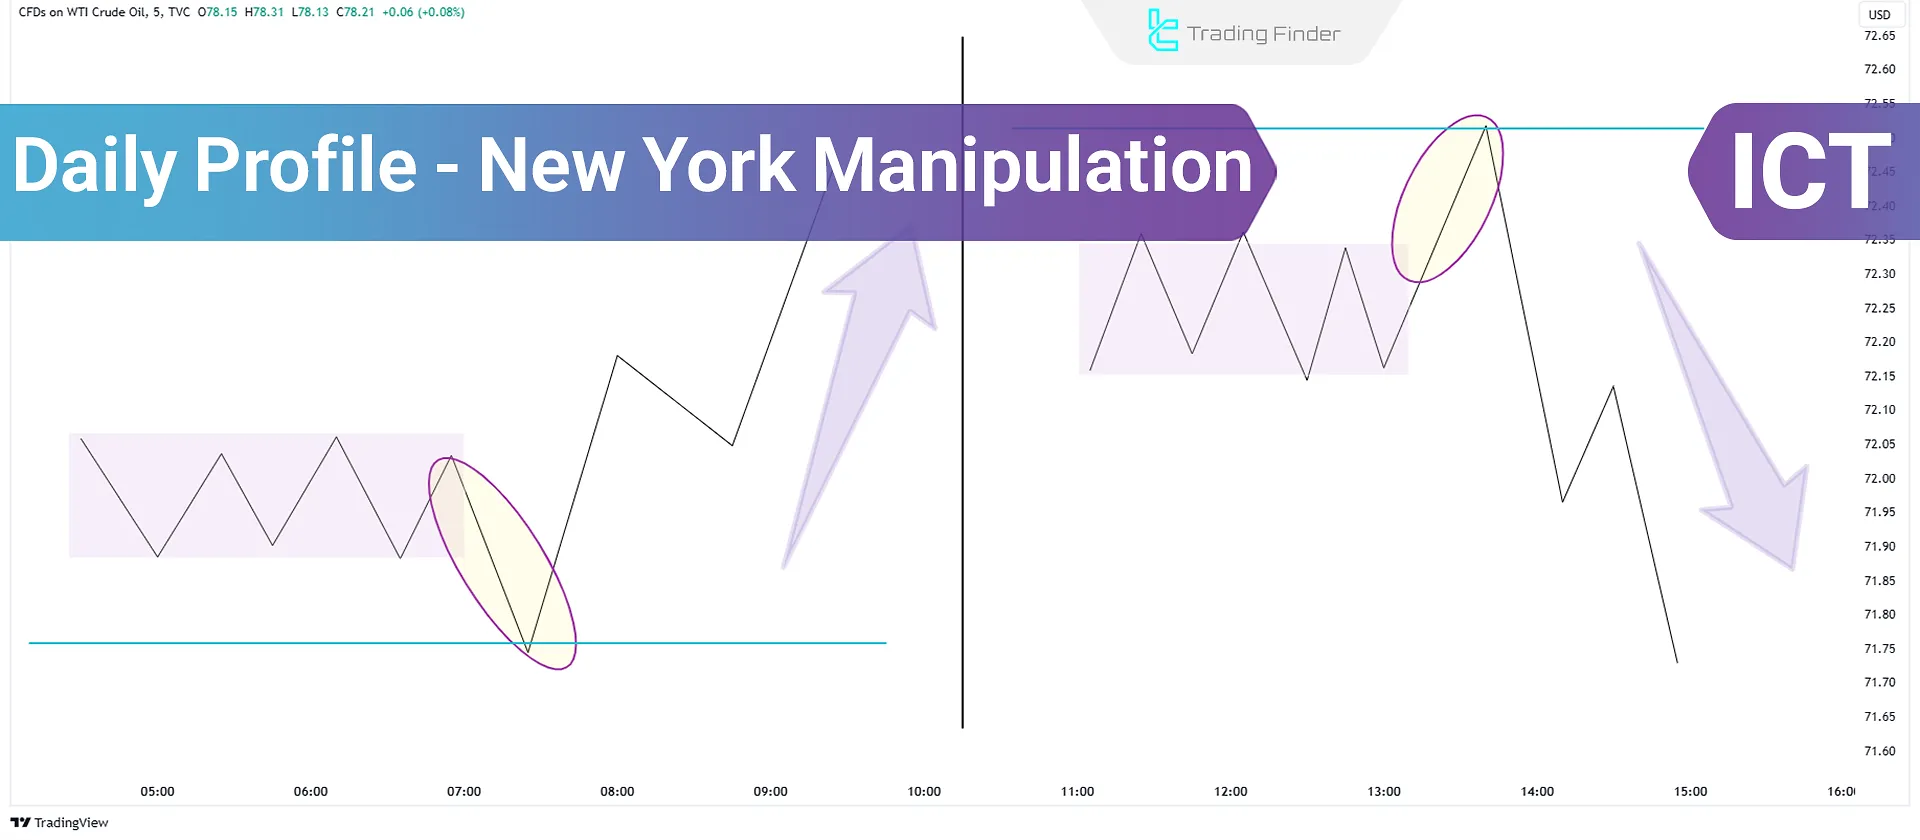
What is New York Session Manipulation (NY Manipulation Pattern)?
New York Session Manipulation is a high-impact intraday trading pattern that detects liquidity grabs and price reversals. We’ll discuss it further in both Bullish and Bearish markets.
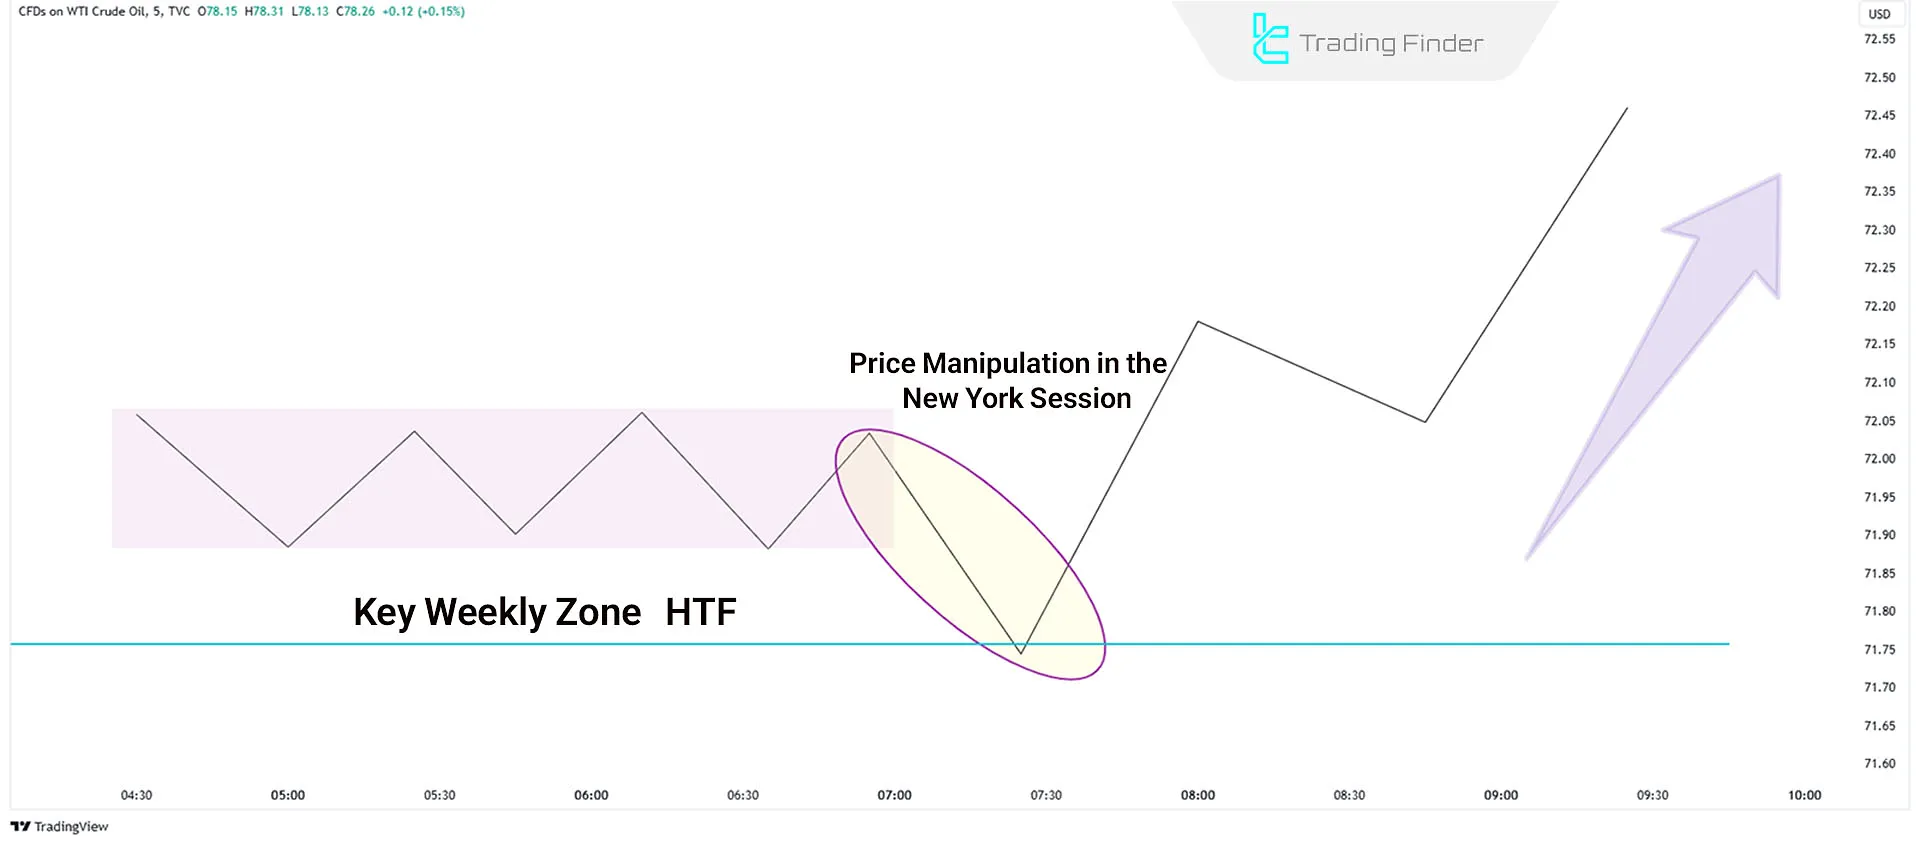
Bullish Manipulation Pattern
The London session typically consolidates or fails to reach a higher timeframe key level in the pattern.
During the New York session, the price is manipulated downward to collect liquidity, after which the supply and demand shift leads to a strong bullish move.
The manipulation pattern contains the Power of three key phases:
- Accumulation: Price consolidates within a range during the London session;
- Manipulation: Market makers push the price down to trigger stop-losses and accumulate liquidity;
- Distribution: After manipulation, price rallies in the intended direction, targeting previous highs.
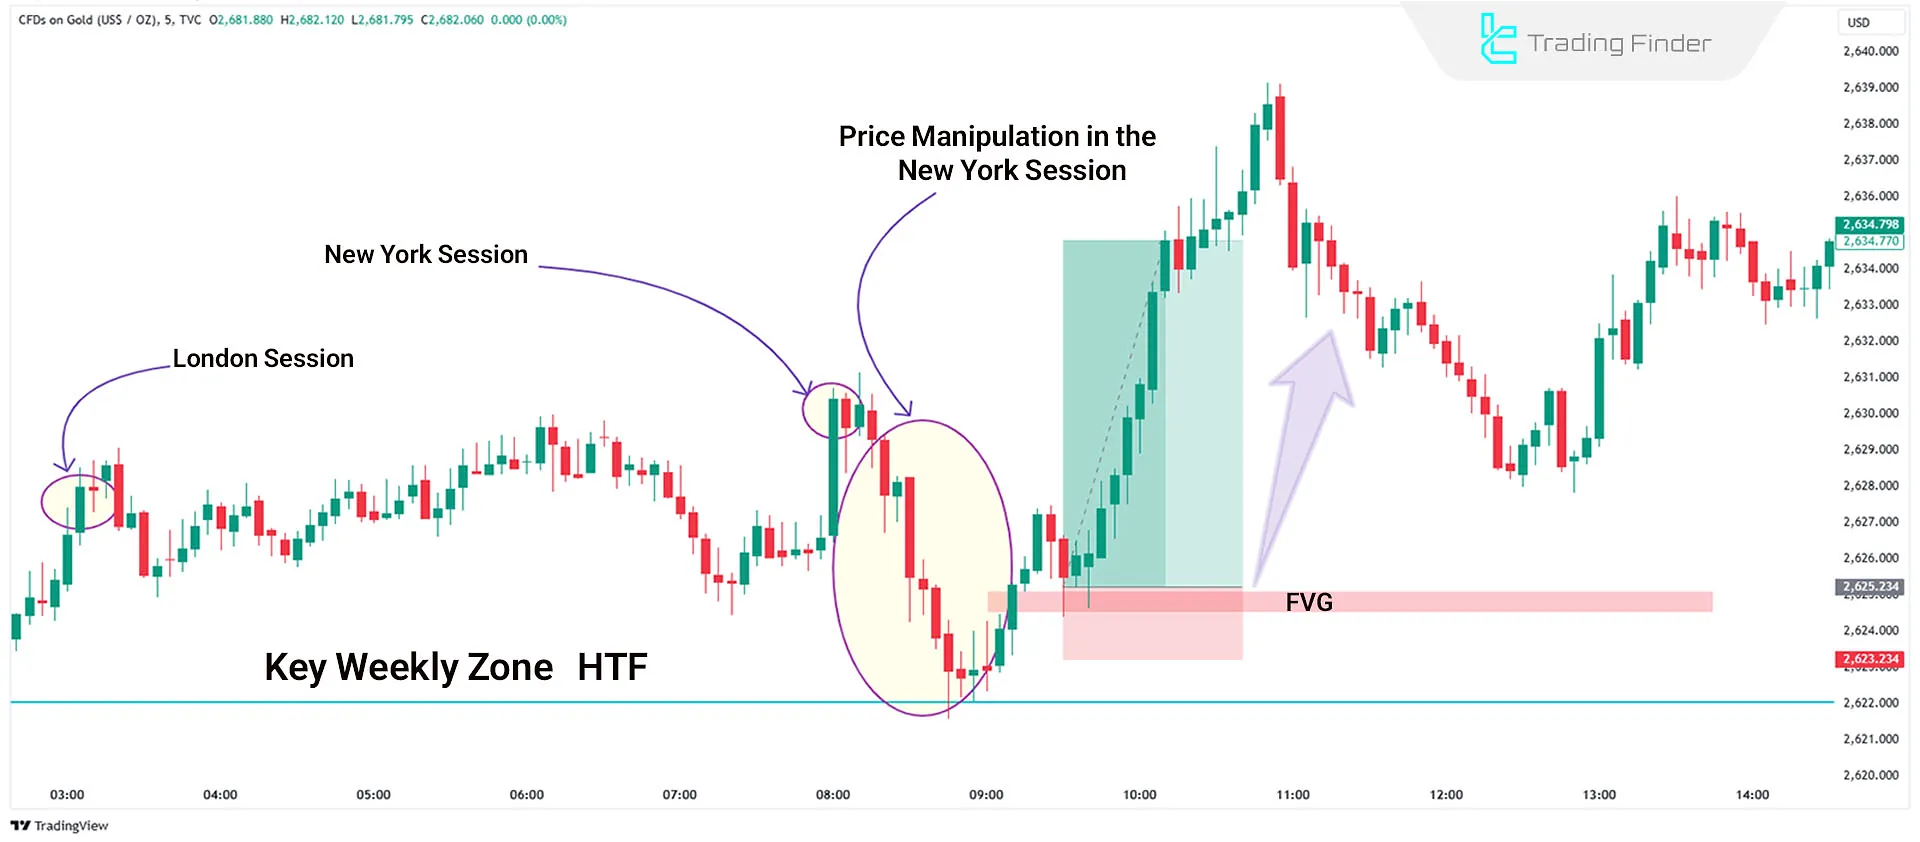
Example of Bullish NY Manipulation in Daily Profiles
In a 5-minute XAU/USD chart, the price consolidates during the London session.
Between 8:30 and 9:30 AM EST, the price is manipulated downward to grab liquidity, followed by a strong rally.
- Entry Point: After the price closes above the manipulated zone
- Take Profit: At the previous day’s high
Bearish Manipulation Pattern
In this scenario, the London session remains in consolidation and fails to reach the key level.
Then, during the New York session, the price is first manipulated upward, and after a shift in supply and demand, a downward move begins.
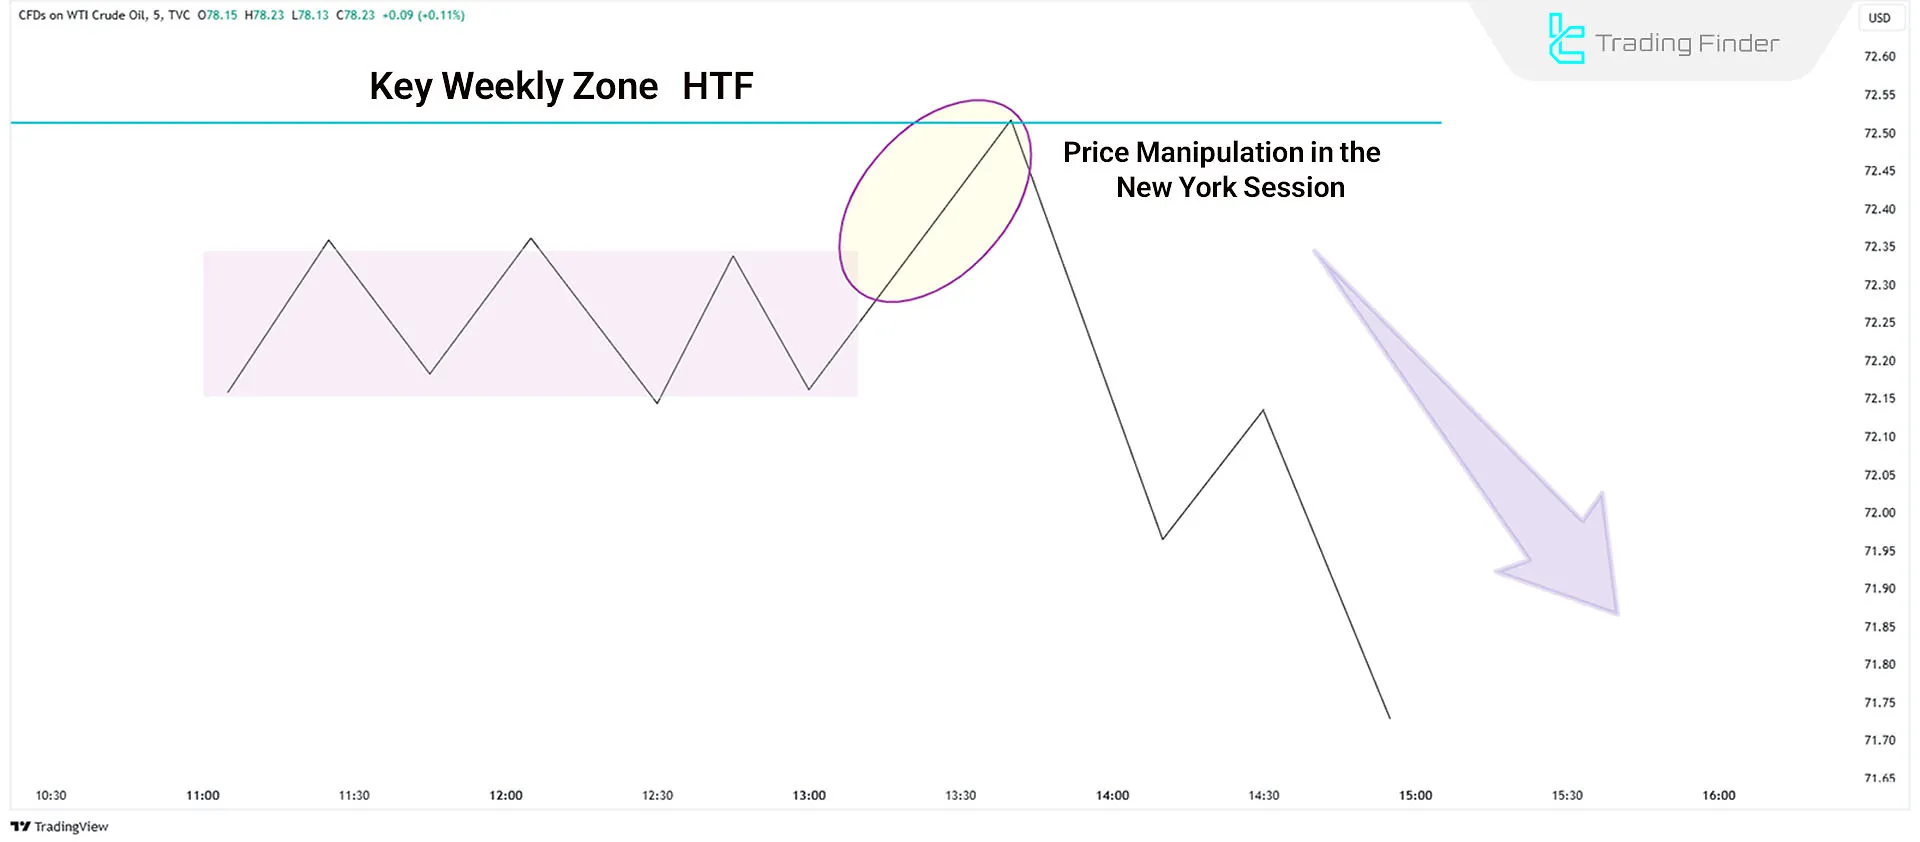
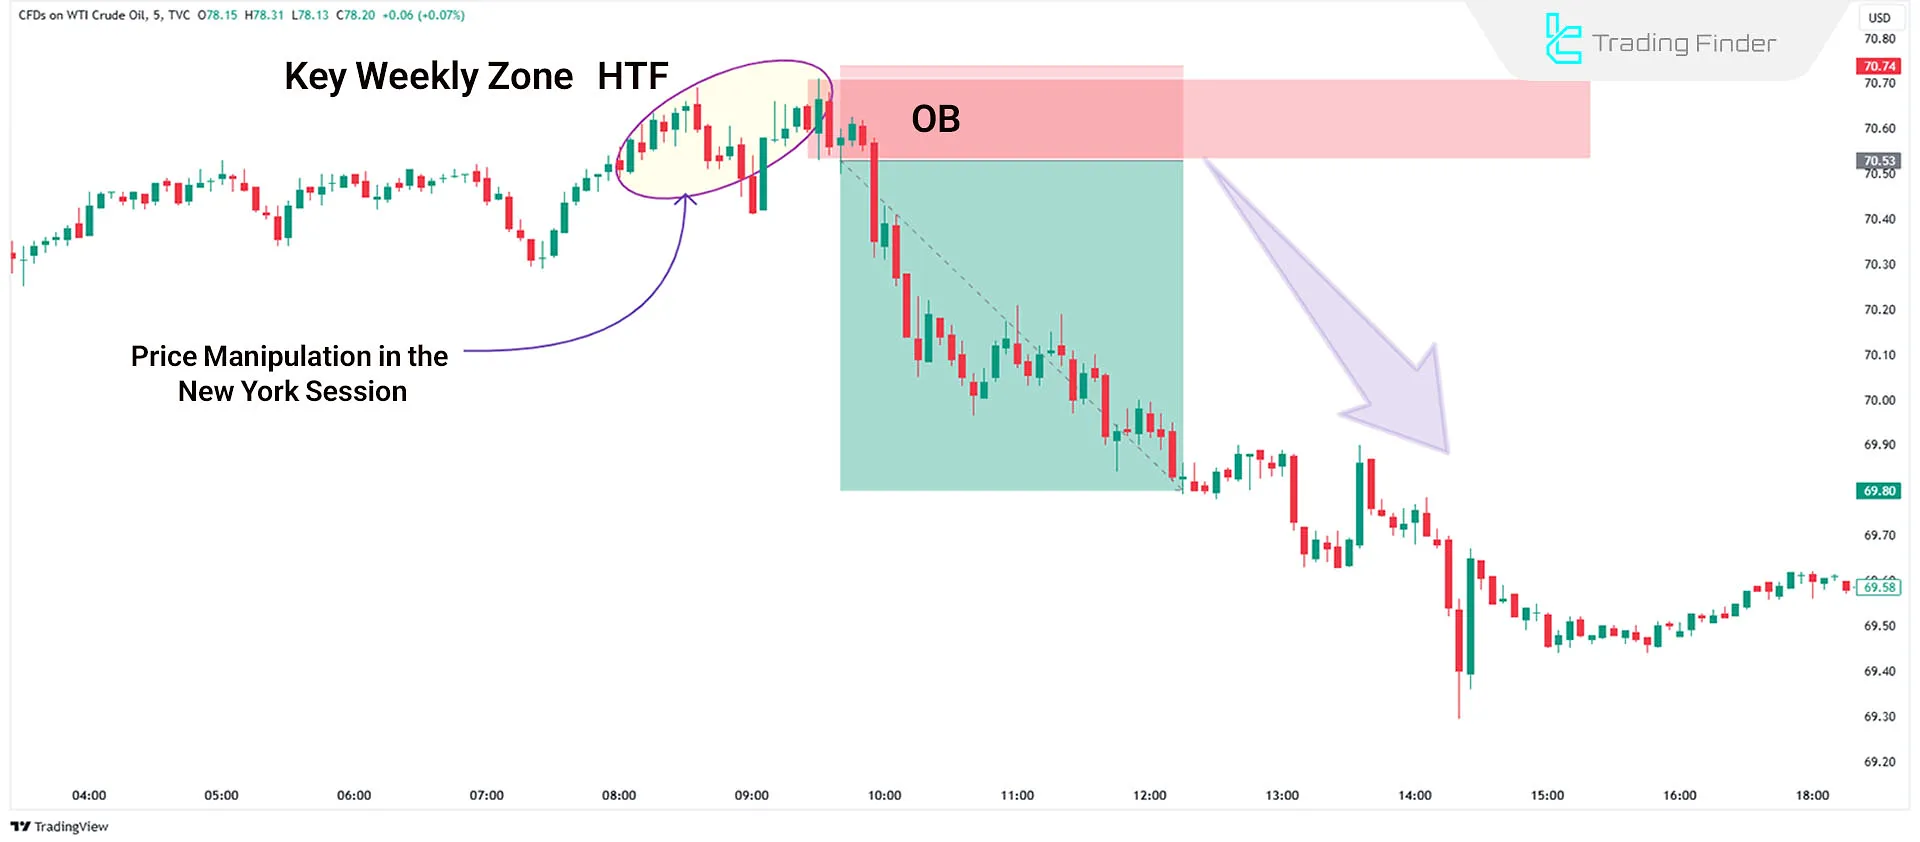
Example of Bearish NY Manipulation in Daily Profiles
In the 5-minute oil price chart, the price consolidates within a specific range during the London session. Then, between 8:30 and 9:30 AM New York time, the price is manipulated upward to collect liquidity before moving downward.
The entry point for the trade is determined after the candle closes below the manipulated range, and the take profit (TP) is set at the previous day's low (PDL).
Key Features of NY Manipulation Pattern
The Characteristics of the New York Manipulation Pattern Are as Follows:
- Timing: Occurs between 8:30 - 9:30 AM EST;
- Direction: Market makers initially push price against the primary trend, then reverse it;
- Entry Points: Confirm Change in State of Delivery (CISD) before entering trades;
- Take Profit Levels: Typically set at the previous day’s high or low.
Role of Kill Zones in Identifying NY Manipulation Areas
In daily profile analysis, identifying key Kill Zones is essential.
Kill Zones represent high volatility periods where major price movements occur. Key trading sessions include:
- London Session: Starts at 3 AM EST, often setting the market direction before the New York session;
- New York Session: Prone to manipulation before price establishes a definitive trend.
Key Tools for Identifying NY Session Manipulation
The Following Tools Are Useful for Identifying Entry and Exit Points in New York Session Price Manipulation:
- Fair Value Gaps (FVGs): Indicate supply-demand imbalances and serve as potential entry points;
- Order Blocks (OBs): represent institutional buying/selling zones, acting as support or resistance levels;
- Premium & Discount Zones: Premiums are ideal for sale entries, and Discounts are optimal for buy opportunities.
Conclusion
The NY Manipulation Pattern frequently appears between 8:30 and 9:30 AM EST and is visible in both bullish and bearish trends.
Traders can capitalize on the New York Session Manipulation in Daily Profiles by combining higher timeframe analysis, liquidity zones, and market structure shifts for precise trade execution.


