


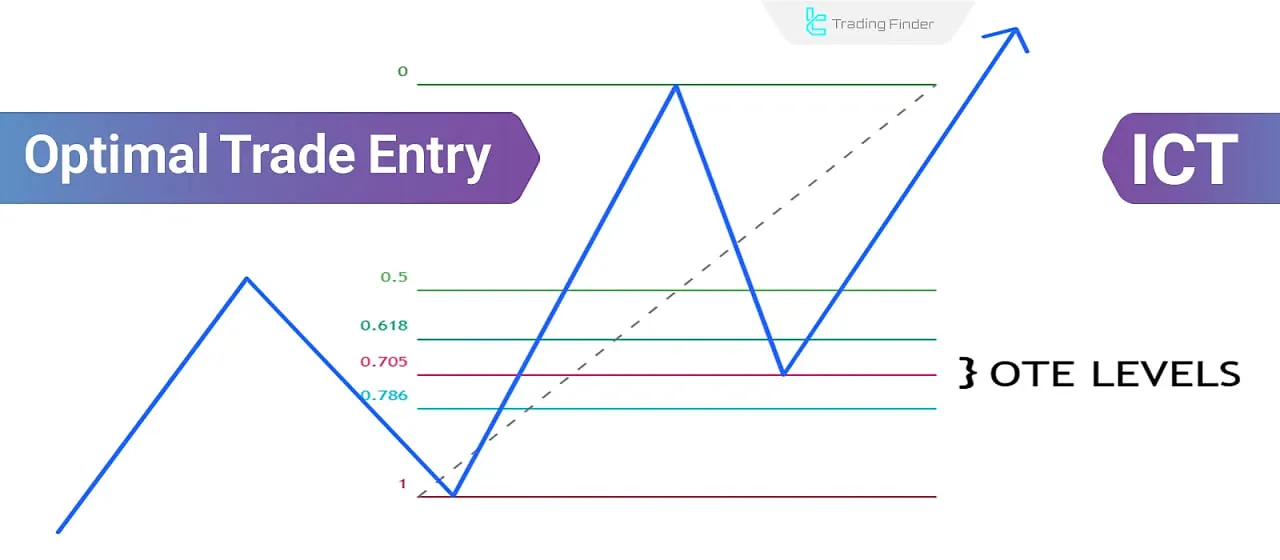
OTE (Optimal Trade Entry) strategy uses multiple Fibonacci levels to identify the optimal time and place to enter a position. In essence, OTE refers to finding the best entry points during price retracements.
The OTE setup, by applying several key Fibonacci levels, determines the optimal area for entering a trade. This method allows the trader to identify a point with the highest probability of success and the lowest risk during price pullbacks.
What Is OTE (Optimal Trade Entry)?
The OTE setup is designed to help traders enter positions with precision during price retracements. Educational video of the OTE Setup from the TTtrades YouTube channel:
OTE in ICT Style
OTE utilizes the Fibonacci tool to identify optimal entry points, particularly within specific times of the day. As a result, entries are mostly made during corrective moves within a primary trend.
Fibonacci Indicator in the OTE Strategy
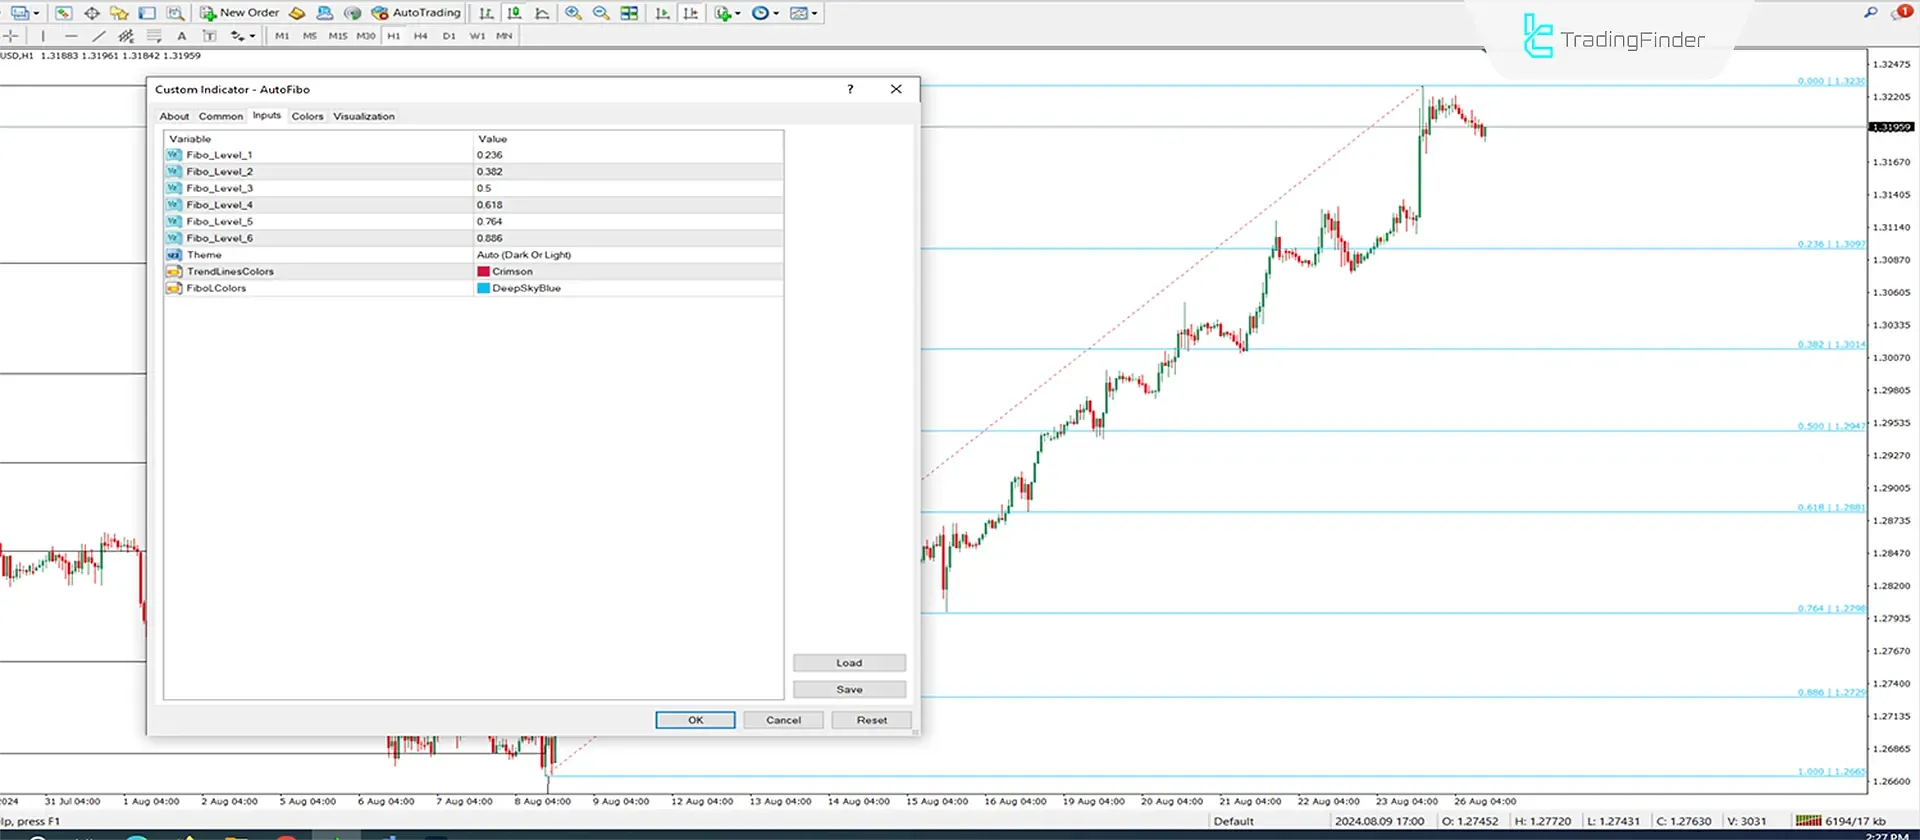
The Auto Fibonacci Indicator is one of the most widely used tools in technical analysis, automatically plotting Fibonacci levels on the price chart.
Key ratios such as 23.6%, 38.2%, 50%, 61.8%, and 76.4% are widely used to identify potential price retracement zones. This indicator reduces manual calculation errors and increases the speed of analysis.
This tool falls under the category of support, resistance, and trading level indicators, and is applicable across various markets, including Forex, crypto, stocks, and indices.
Its main function is based on identifying highs and lows and automatically drawing Fibonacci levels helping traders quickly spot supports, resistances, and potential entry and exit points.
In an uptrend, the zero level is placed at the low and the 100 level at the high, while in a downtrend this arrangement is reversed. Traders can use the mid-level Fibonacci ratios to decide on entries, set stop losses, or define profit targets.
There is also the option to adjust default levels (such as 0.236, 0.382, 0.5, 0.618, 0.764, and 0.886), colors, and display settings.
The connection between this indicator and the OTE Strategy is significant since the OTE entry zone usually lies within the 62% to 79% Fibonacci retracement ICT Dealing Range Markets.
Therefore, using the Auto Fibonacci allows traders to identify these zones more quickly and execute the OTE setup with higher precision. For a visual tutorial on the Auto Fibonacci Indicator, you can use the links below:
In conclusion, this indicator is both an independent tool for analyzing Trend Identification and levels and an essential complement for implementing OTE in the ICT & SMC Market Structure. Links to the Auto Fibonacci Indicator:
- Auto Fibonacci Indicator for MetaTrader 4
- Auto Fibonacci Indicator for MetaTrader 5
- Auto Fibonacci Indicator for TradingView
Advantages and Disadvantages of the OTE Setup
The advantages and disadvantages of OTE play an important role in evaluating the quality of this method; because on the one hand it can provide an optimal entry point with controlled risk and appropriate position size within the Fibonacci retracement zone.
on the other hand, in case of error in analysis or absence of deep retracement, there is the possibility of false signals and missed trading opportunities.
Disadvantages | Advantages |
High dependency on the accuracy of drawing Fibonacci and possibility of analyst error | Determining the optimal zone for entry using Fibonacci ratios |
Possibility of missing fast opportunities in case of waiting too much for retracement | Entering in the direction of the prevailing trend with lower risk |
Probability of orders not being triggered in strong markets without deep retracement | Improving the risk-to-reward (RR) ratio in trades |
Need for confirmation with other tools to reduce false signals | Can be combined with price action, smart money, and market structure |
Complexity for beginners and requires experience in identifying structures | Suitable for swing Trading and daily strategies |
Required Tools for OTE Setup
For using the OTE setup, the main tool is the Fibonacci retracement Tool, which identifies the key price retracement levels.
Alongside it, price action analysis, supply and demand zones, and the appropriate timeframe play an important role as complementary tools in confirming the entry.
Fibonacci Tool in OTE
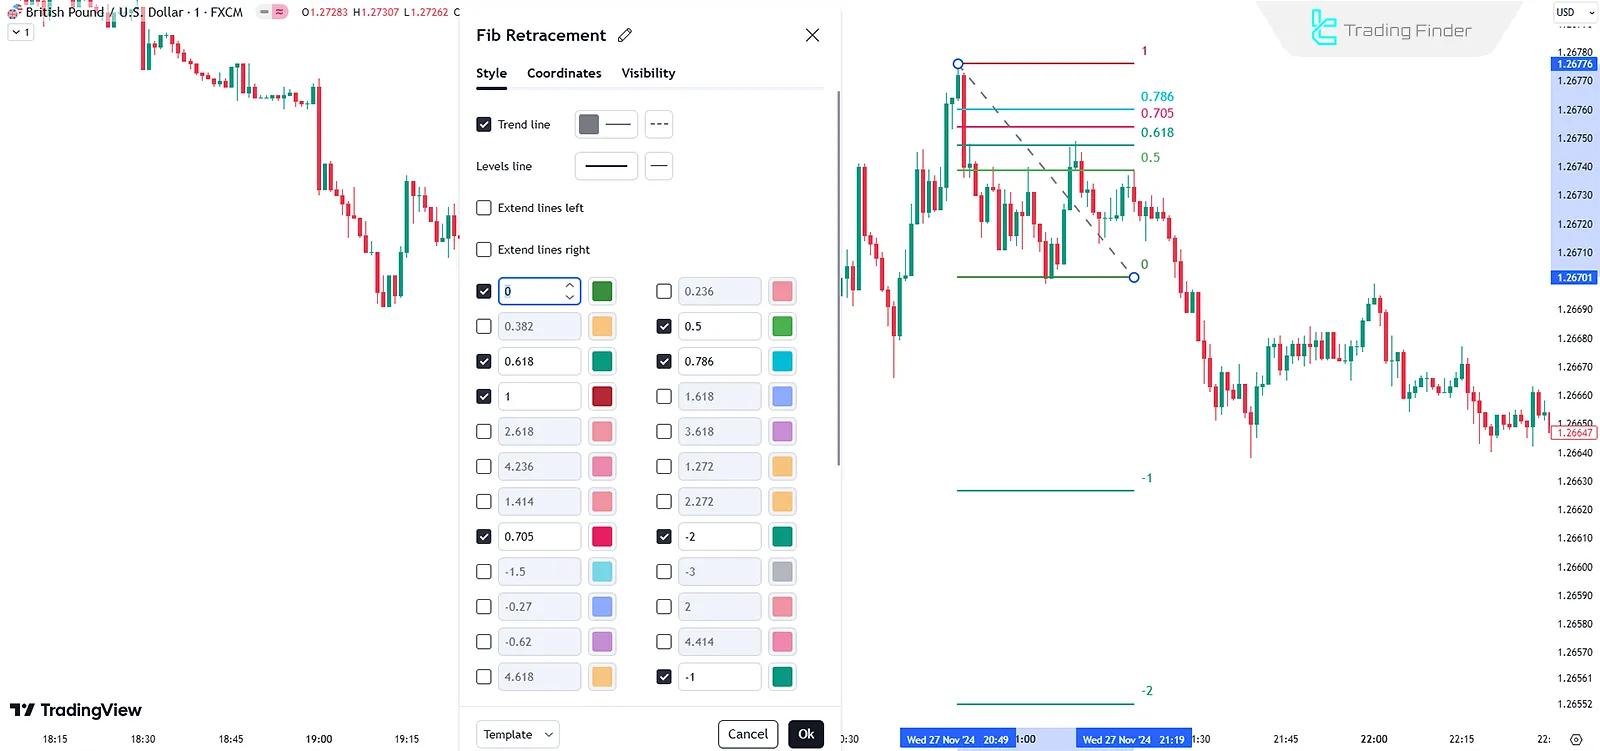
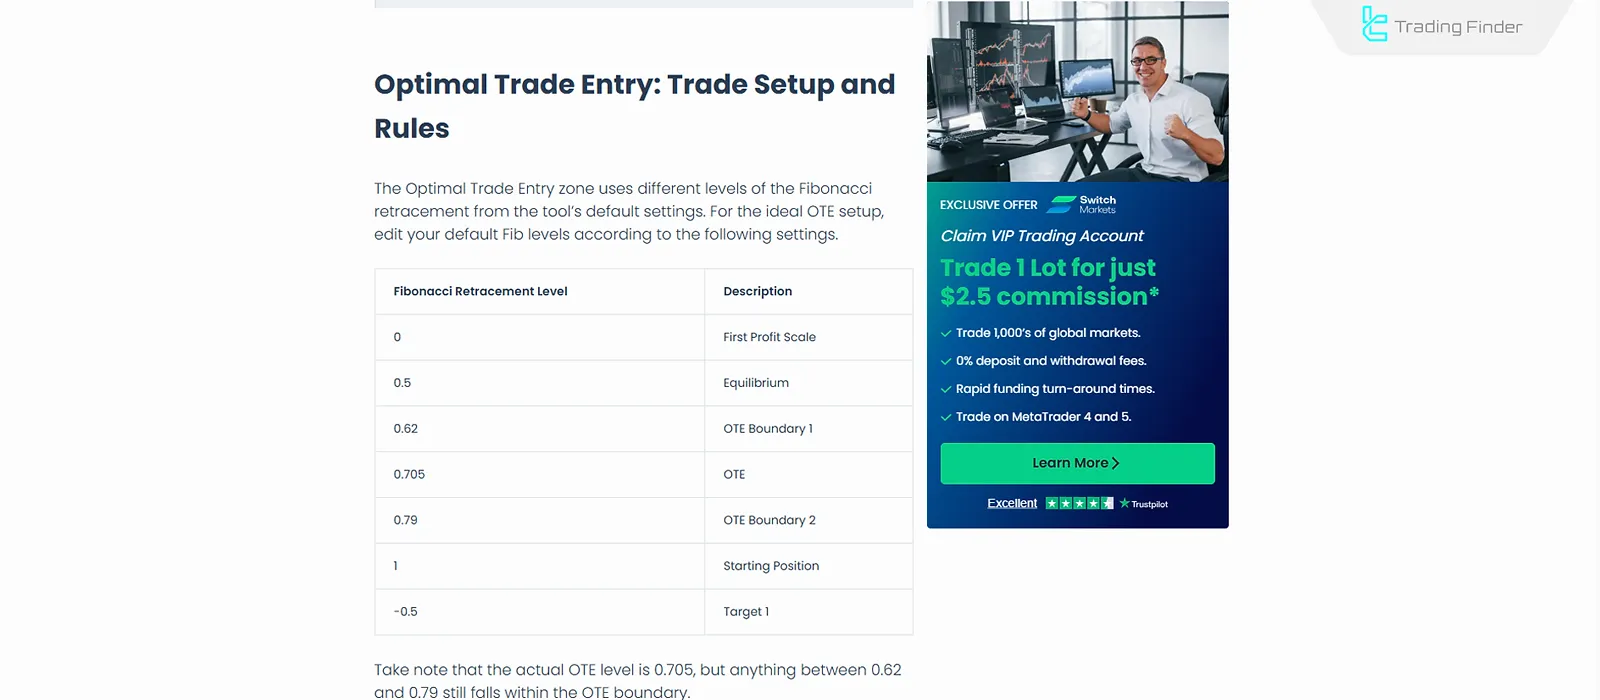
The Fibonacci tool helps identify retracement and extension levels. Key ICT Fibonacci levels in OTE include:
- For Entry Zone:
- 0.62 – OTE level 1 (0.618)
- 0.705 – OTE level 2 (Precise OTE) (0.705)
- 79% (0.79)
- Equilibrium (0.5)
- For Stop Loss:
- (1) 100%
- For Take Profit:
- 0
- -1
- -1.5
- -2
Also, the Fibonacci OTE settings table provided by HowToTrade can be used.
Order Blocks
Order blocks are areas of the chart where banks and financial institutions have placed a large volume of orders. In these zones, sharp changes in supply and demand usually occur, and the probability of reversal or continuation of the trend is high.
Liquidity Zones
These areas include stop losses or pending orders of traders, which appear in the market as a "liquidity pool". The price usually attacks these zones and, after collecting liquidity, begins its main movement.
Higher and Lower Timeframe Analysis
For the correct execution of the OTE setup, multiple timeframes must be used. In higher timeframes (such as daily or 4-hour), the overall trend and the main supply and demand zones are identified.
Then, in lower timeframes (15-minute or even 5-minute), we look for the precise entry point based on OTE.
Specific Timing
The OTE strategy works best when trades are entered during a specific timeframe of the day.
Steps to Execute the OTE Setup
To use the OTE setup effectively, it is best to follow the provided guidelines to avoid potential errors.
#1 Analyze the Trend in Higher Timeframes
Identify the main market trend:
- Check for key highs or lows and assess the market structure;
- Look for pullback zones to enter long trades in an uptrend;
- Look for pullback zones to enter short trades in a downtrend.
#2 Identify the Key Order Block
An order block is a specific zone from which the price begins its movement. This area can be identified by looking at the candles before strong moves.
- In an uptrend: Look for the last bearish candle before the Bullish Trend (Higher Highs & Higher Lows);
- In a downtrend: Look for the last bullish candle before the bearish move.
#3 Apply the Fibonacci Tool
Draw Fibonacci levels on the most recent main swing:
- Use the tool from the swing low to the swing high;
- Entry zones usually lie within the 62% to 79% retracement levels.
#4 Confirm Liquidity Grab
Ensure that price has collected liquidity Grabs before reaching the OTE zone:
- This could involve a previous high or low;
- Look for retail traders' stop-loss.
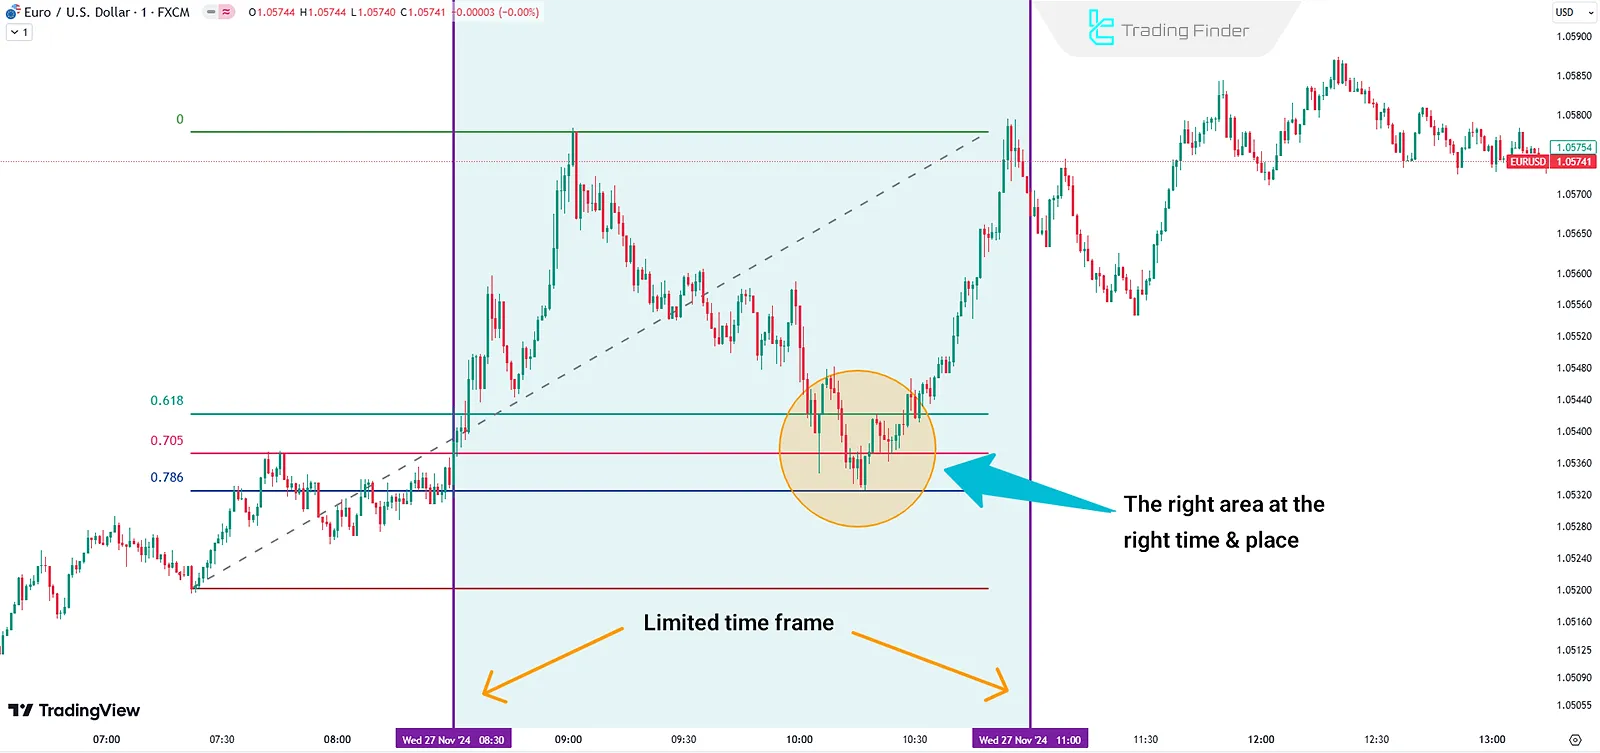
#5 Mark the Specific Time Window
The OTE strategy has the highest success rate at a specific time of day; the entry time in this setup is always between 8:30 a.m. and 11 a.m.
New York local time. Traders can use a time zone converter based on their place of residence to calculate these 150 minutes of the OTE setup in their local time.
Note: The entry moment will be somewhere within this 2.5-hour window, and depending on the market conditions at that time, its position will vary.
#6 Identify Lower Timeframe Triggers
Move to a lower timeframe (e.g., 5-minute or 15-minute) and look for:
- Market Structure Break (Break of Structure);
- Confirmation candle from the Order Block;
- Retest of the OTE zone.
Managing the Trade in OTE Setup
Trade management becomes more straightforward with OTE since all critical components (entry, stop-loss, and take-profit levels) are derived from Fibonacci settings.
Stop Loss Placement
- For a bearish setup: Above the 100% Fibonacci level;
- For a bullish setup: Below the 100% Fibonacci level.
Take Profit Targets
The TP targets in this trading setup, based on extension levels, have a wide variety. For example, two of them are mentioned:
- The previous high or low (opposite direction of entry);
- Fibonacci extension levels (e.g., 1- or 2-).
Risk Management
Always risk a fixed percentage of your capital (e.g., 1%) per trade. Using an appropriate Risk/Reward Ratio ensures trade optimization.
Note: The One Shot One Kill Indicator from TradingFinder is an effective tool that enables the combination of the Market Maker Buy and Sell Model (MMXM) strategy and the One Shot, One Kill strategy, guiding you toward optimal trade entries (OTE).
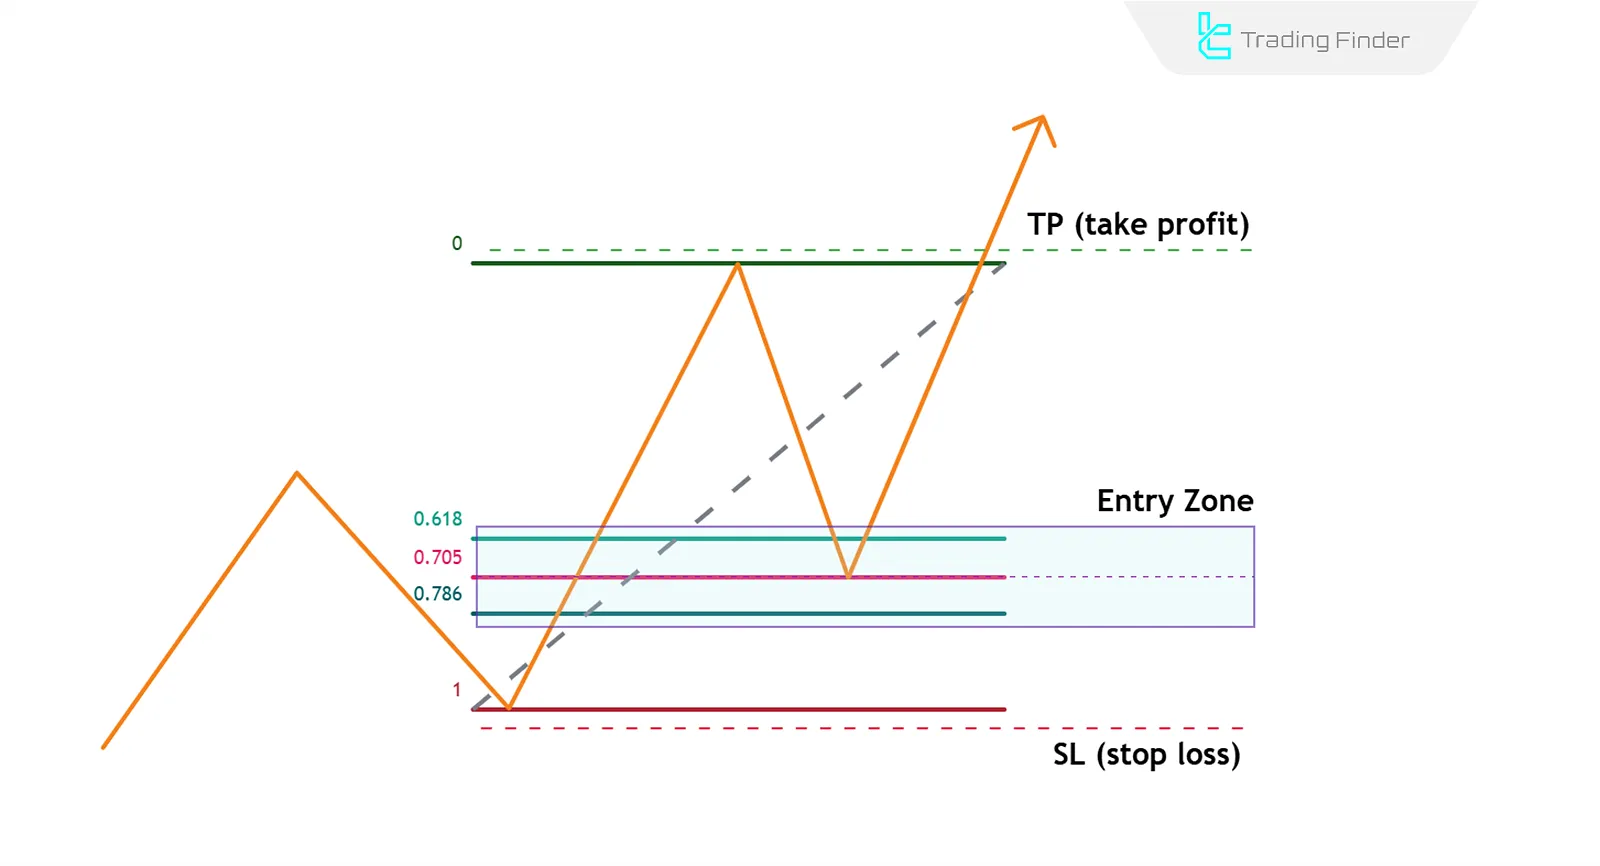
Bullish Maeket of the OTE setup
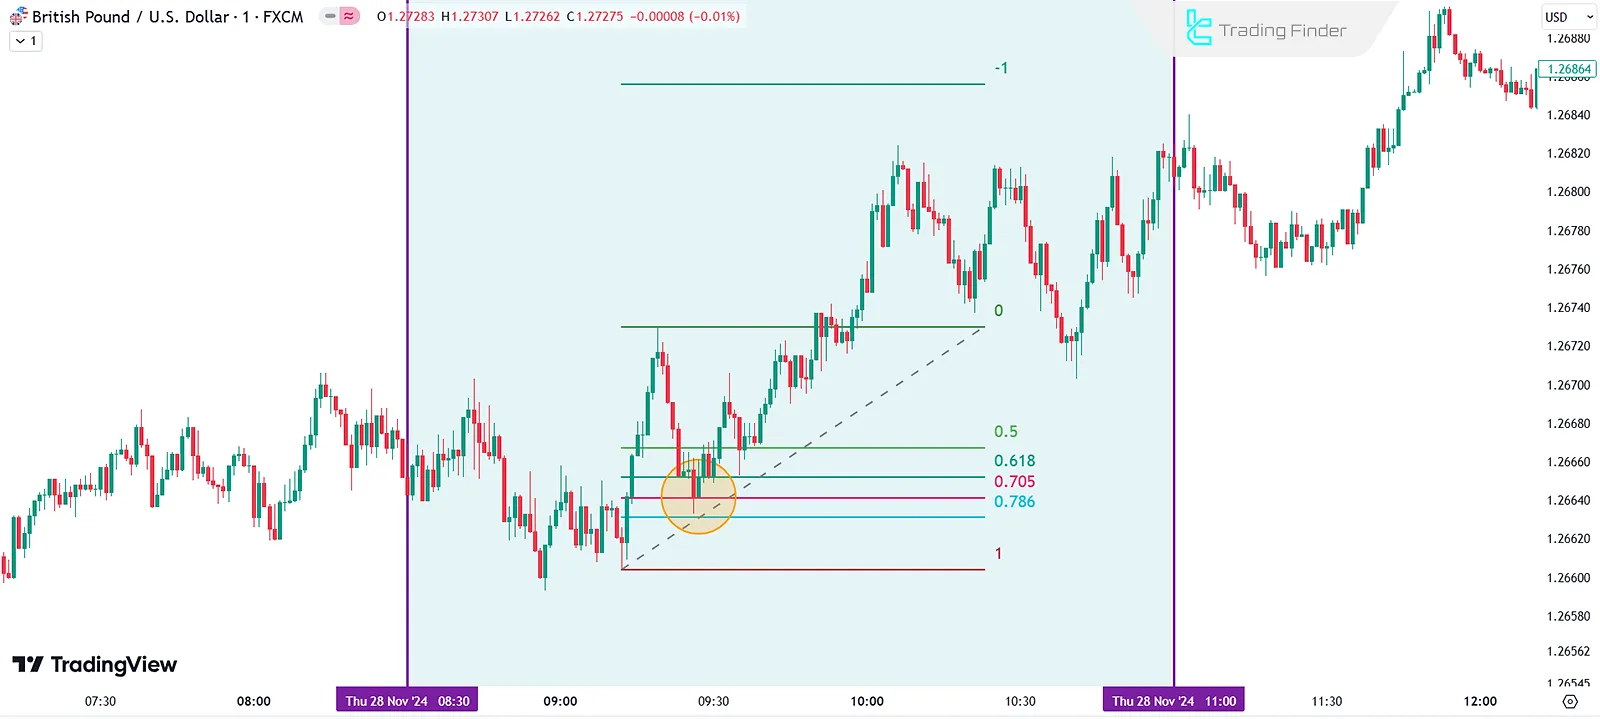
On the daily timeframe, price is in an uptrend:
- Higher timeframe analysis confirms an uptrend;
- A new bullish move breaks a market structure;
- Fibonacci levels are drawn from the swing low to the swing high;
- It’s between 8:30 AM and 11:00 AM New York time;
- Price retraces to the 5% level;
- Enter the trade with a stop-loss below the 100% level and take-profit at the previous high.
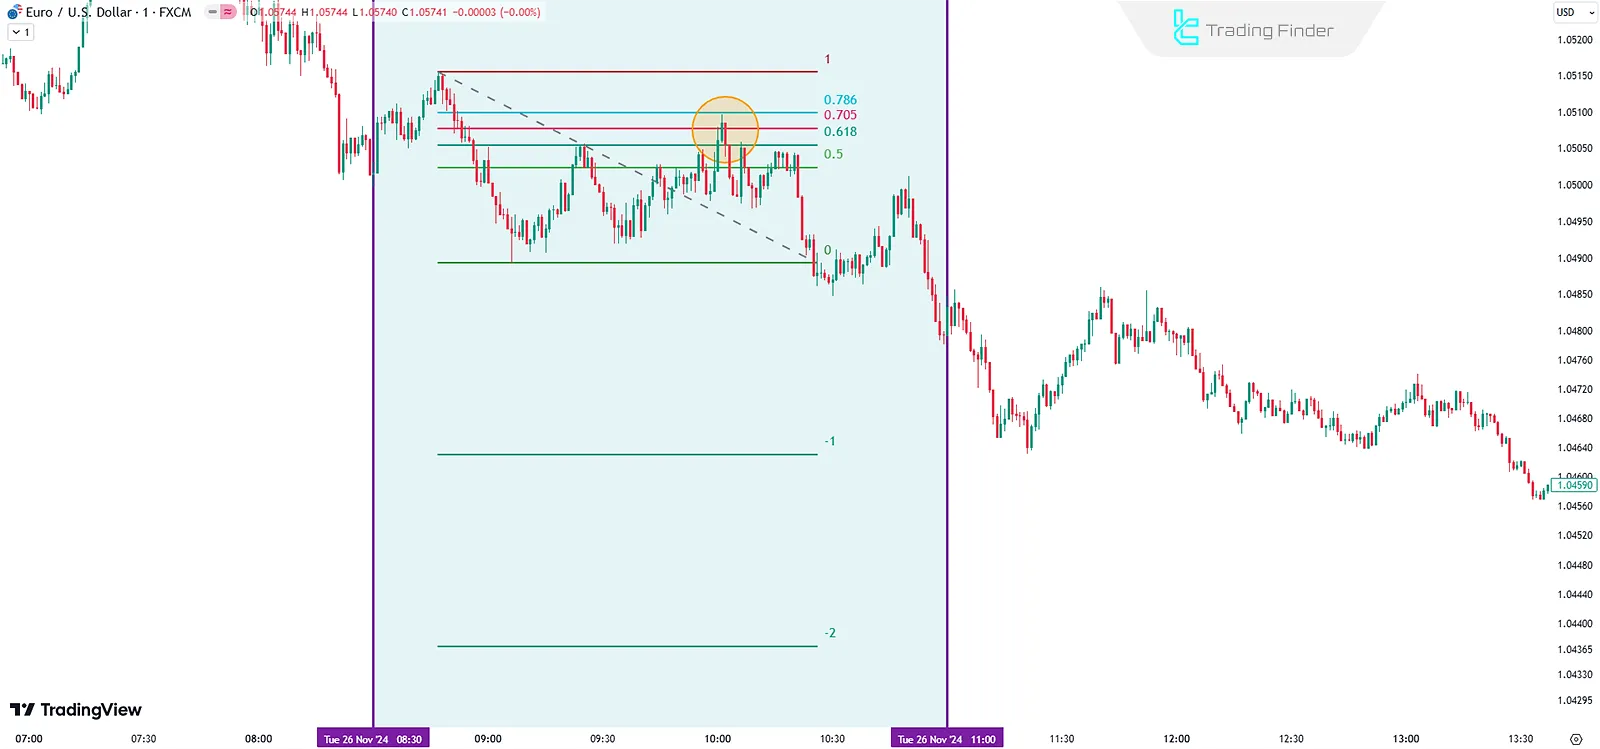
Bearish Example of the OTE setup
In the daily timeframe, the price is in a downtrend and a new bearish swing has formed; now the performance of this setup is examined step by step:
- The prevailing trend in the higher timeframe is confirmed bearish;
- A powerful bearish swing forms with a break of structure (previous low);
- Fibonacci with OTE settings is drawn from the swing high to the swing low;
- Time window for entry check: 8:30 to 11:00 a.m. New York;
- With the price returning to the OTE zone (around 70.5%) and receiving a price action trigger, we get ready for a sell entry;
- The short position is activated; the stop loss is placed above the 100% Fibonacci level (swing high), and the take profit is set at the previous low/liquidity pool.
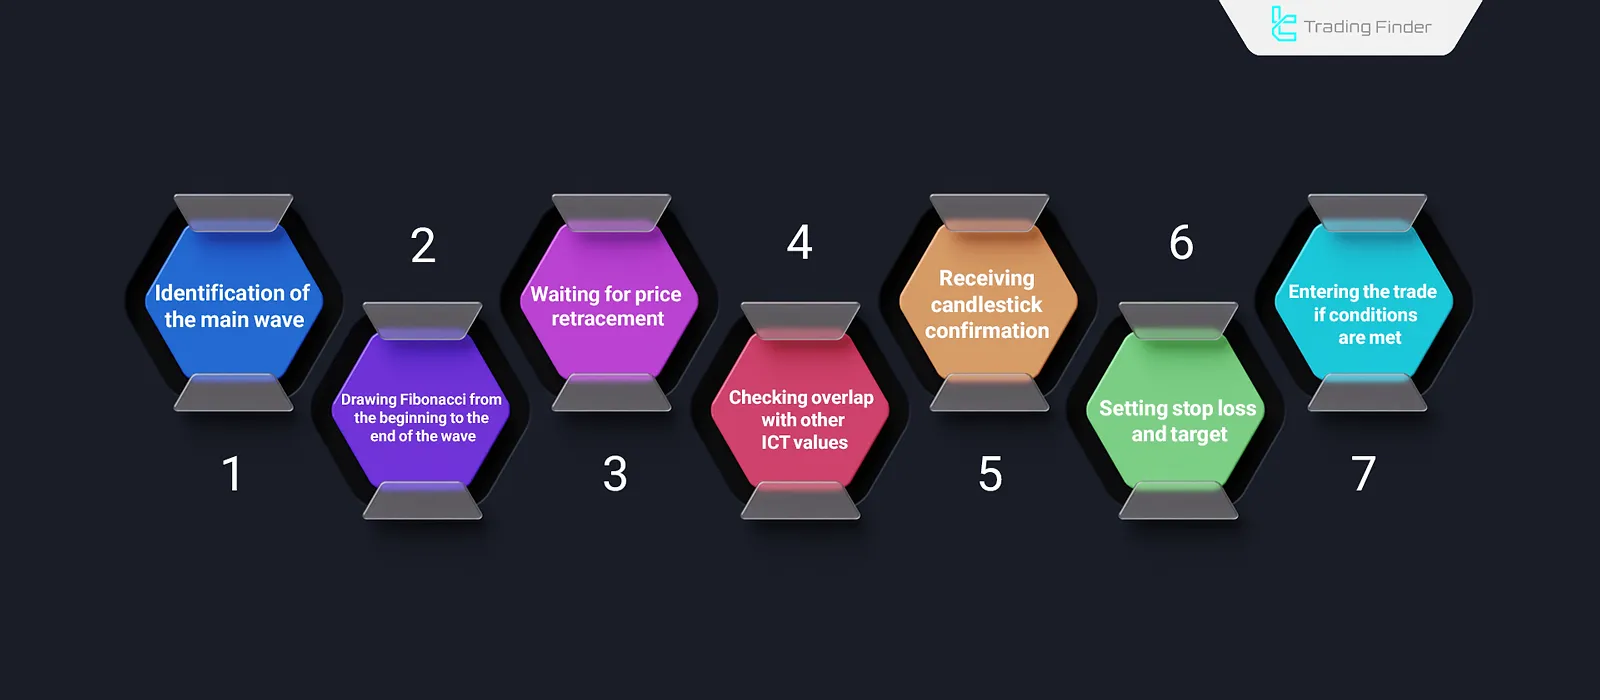
Entry Checklist Based on the OTE Setup
In the OTE setup, merely reaching the 62%–79% Fibonacci zone is not enough.
A professional trader must identify the reference swing, draw the Fibonacci accurately, check for confluence with tools such as order block or Fair Value Gaps (FVGs), and only enter after a candlestick confirmation. Entry checklist using the OTE setup:
- Identify the main swing (a clear bullish or bearish move);
- Draw Fibonacci from the beginning of the swing to its end;
- Wait for price retracement to the 62%–79% zone;
- Check confluence with Order Block or FVG;
- Receive Traditional Candlestick Patterns confirmation;
- Set stop loss and target while respecting Risk/Reward Ratios;
- Enter the trade only if all conditions are met.
Key Tips for Success in OTE
The correct execution of the OTE setup is only possible by following a few key principles. Observing these points makes entries more precise, risk lower, and the probability of trade success higher. Key points in executing the OTE setup:
- Always analyze higher timeframes to determine the main trend;
- Only enter trades after liquidity has been grabbed;
- Confirm the structure break in lower timeframes;
- Stick to the specified timeframe (8:30 AM to 11:00 AM New York time;)
- Discipline and risk management are essential for success.
Common Mistakes Traders Make with OTE Setup
Many of the failures of traders in the OTE setup are due to common errors in analysis and execution.
From incorrectly selecting the Fibonacci high and low to entering against the main trend, each of these can invalidate the entire strategy. Common mistakes in using the OTE strategy:
- Failure to analyze the main trend in higher timeframes;
- Using the strategy outside its specific time window;
- Misinterpreting the market structure break;
- Incorrectly placing Fibonacci start and end points;
- Applying the strategy against the main trend.
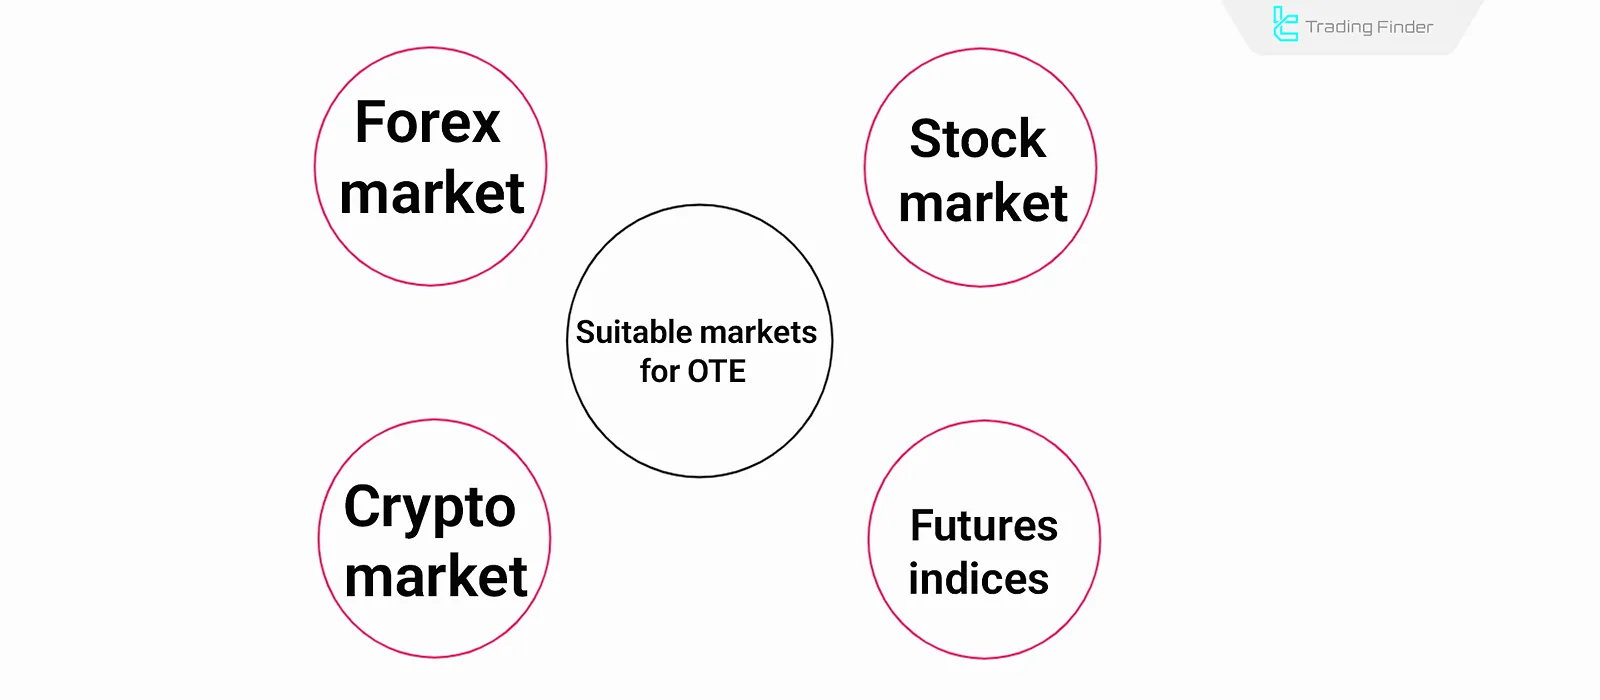
What Markets are Suitable for OTE Setup?
OTE strategy is ideal for markets like Forex, NYSE stocks, futures and indices; This is because the strategy aligns with New York session liquidity and It is less effective in markets not tied to New York trading hours. OTE can also be used in Cryptocurrencies Trending Markets.
Comparison of Entry and Exit in the OTE Strategy vs. Classic Fibonacci
The entry and exit in the OTE strategy have slight differences compared to the classic Fibonacci method, and knowing them is essential for ICT-style traders.
The table below compares the OTE strategy with classic Fibonacci in terms of entry points, exits, and confirmation conditions:
Criteria | OTE Strategy | Classic Fibonacci Strategy |
Entry Point | In a specific retracement zone (62% to 79% Fibonacci) after liquidity collection and price action confirmation | Any Fibonacci retracement level (38%, 50%, 61.8%, etc.) can be an entry point |
Entry Confirmation | Requires Break of Structure (BOS), Order Block, or confirming candlestick in lower timeframe | Often no confirmation needed, entry only based on Fibonacci level |
Stop Loss | Behind the 100% Fibonacci zone or behind the latest Order Block | Behind Fibonacci level or recent high/low |
Take Profit | Previous high/low or target liquidity pool | Fibonacci extension levels or next high/low |
Key Feature | Focuses on one precise zone with higher probability of success | Provides multiple potential levels for entry and exit |
Conclusion
The ICT style and OTE tool allow traders to identify optimal entry and exit points with precision.
This method is particularly beneficial for retail traders [especially scalpers], as it focuses on a specific time of day and considers detailed market behavior.


