


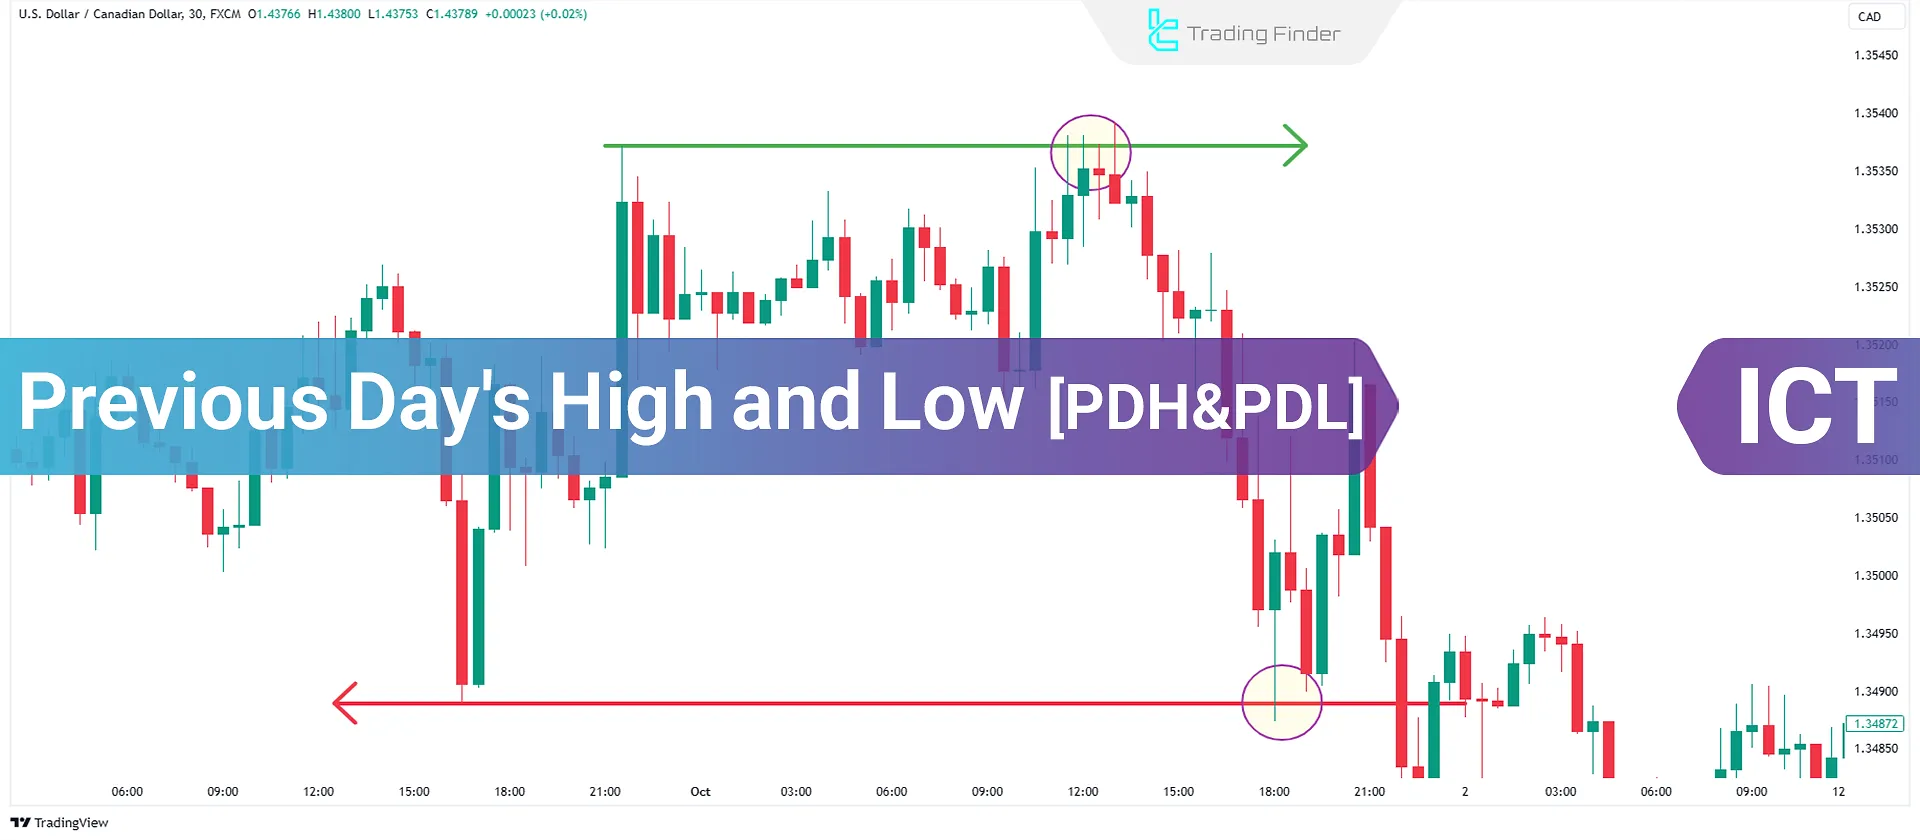
ThePrevious Day's High (PDH) and Previous Day's Low (PDL) are key price levels in ICT trading, used to identify crucial support and resistance zones in daily trading strategies.
These levels are not considered merely as simple support and resistance lines; rather, they are regarded as liquidity accumulation zones around which the market’s algorithmic behavior often forms.
Price reactions near the PDH and PDL provide precise information about buyer strength, seller weakness, and the probable direction of movement in new trading sessions.
What Are PDH and PDL?
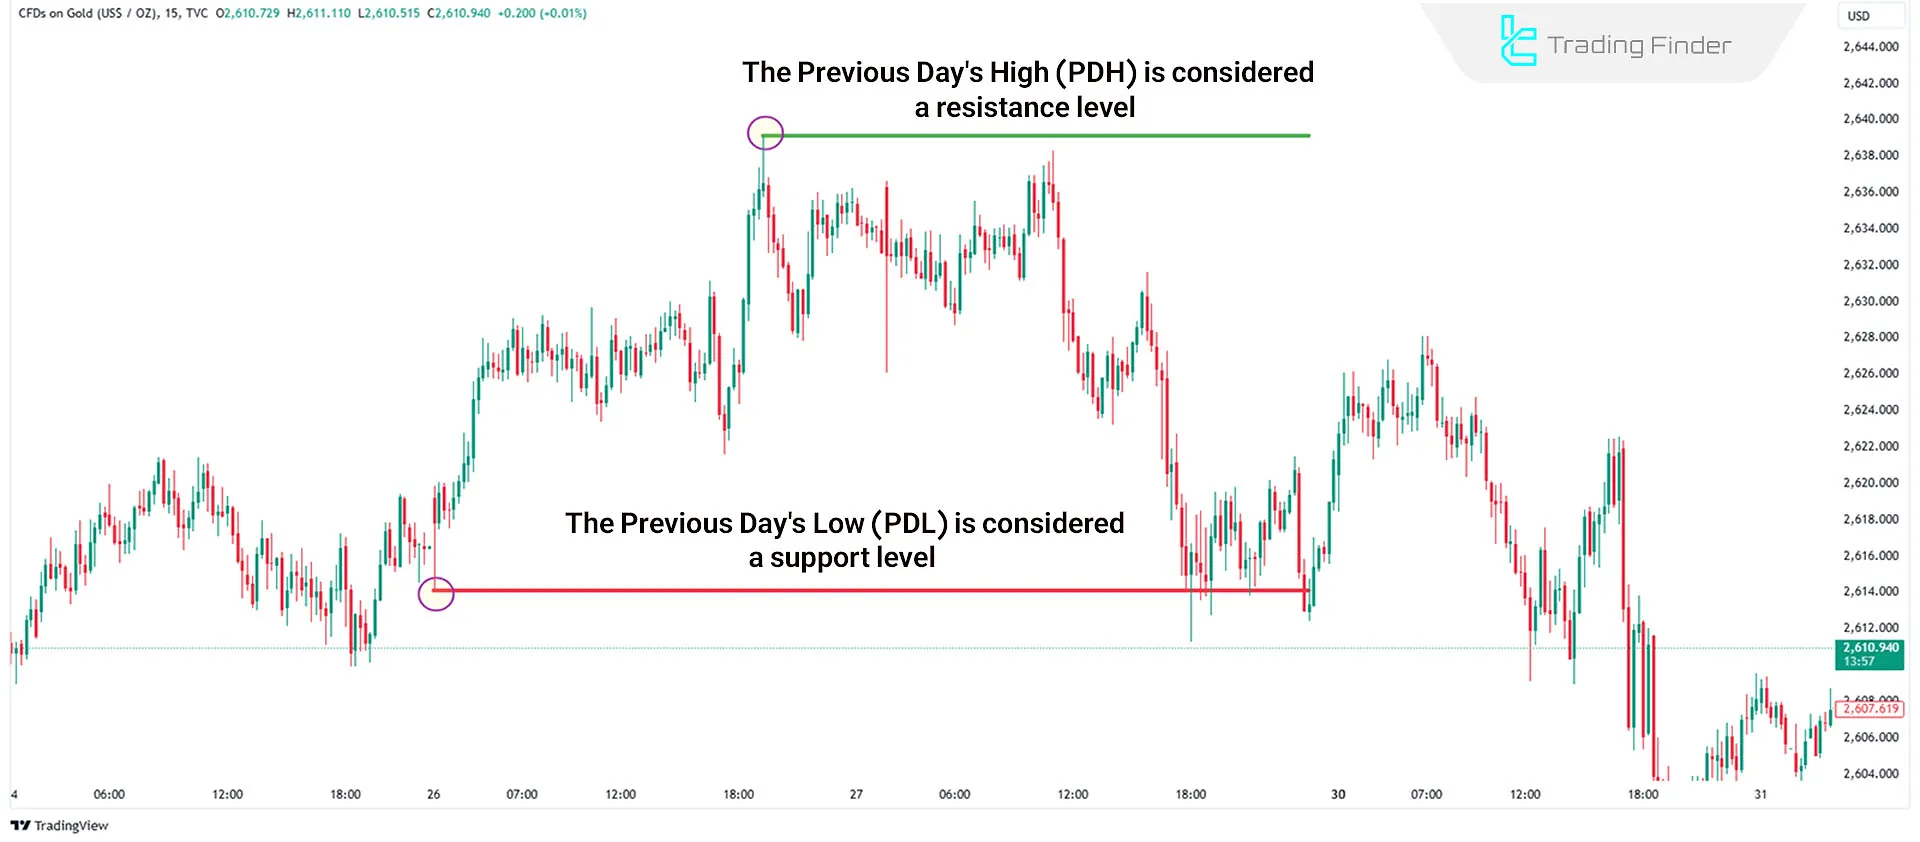
PDH represents the highest price reached on the previous trading day, while PDL indicates the lowest price. These levels help traders analyze past market movements and identify potential reaction zones.
Price often shows significant reactions at these levels, making them essential for day traders.
How Do PDH and PDL Reflect Market Strength?
The PDH and PDL levels act as market sentiment indicators. Tutorial on how to use PDH and PDL from the capital.com website:
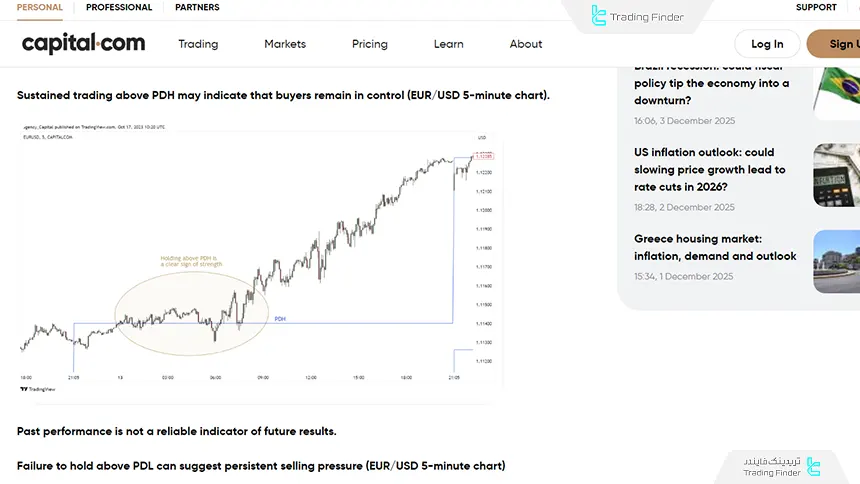
If the marketstays above PDH in early trading hours, it signals strong bullish momentum. If the market remains above PDL but fails to break PDH, it suggests weak market conditions. Tutorial on using the previous day’s high and low from the H trader YouTube channel:
Advantages and Disadvantages of PDH and PDL
The Previous Day’s High and Low levels (PDH and PDL), as references to the prior day’s price range, play an important role in intraday structure analysis and help assess the market’s probable direction.
Despite their widespread use, these levels are influenced by liquidity conditions, news behavior, and higher-timeframe structure, and therefore do not perform uniformly in all situations. Table of Advantages and Disadvantages of PDH and PDL:
Advantages | Disadvantages |
Simple reference for the previous day’s range | Highly sensitive to news |
Identification of daily liquidity zones | Irregular behavior in low-volume markets |
Applicable across all markets | Requires confirmation from other tools |
Suitable for intraday scenarios | Possibility of false breaks or fake penetrations |
Very easy to calculate and draw | Inconsistent reactions in ranging markets |
How to Draw PDH and PDL on the Chart
To determine the Previous Day’s High (PDH) and Previous Day’s Low (PDL), the candle data of the prior day must first be reviewed on the Daily timeframe.
Specifically, only two values matter: the daily high and the daily low. These two values form the basis for drawing reference levels in intraday trading. Specialized Methods for Extracting and Drawing Levels:

Selecting the Daily Timeframe (Daily)
The objective is to gain direct access to the prior day’s price range. On this timeframe, the High represents the highest price recorded during that day, and the Low represents the lowest price.
Using lower timeframes to extract these values is not recommended, as it reduces analytical accuracy.
Accurately Recording the Previous Day’s High and Low
After the daily candle closes, the High value is recorded as the Previous Day’s High (PDH), and the Low value is recorded as the Previous Day’s Low (PDL). These values must be taken precisely from raw price data without rounding.
These levels are considered reference liquidity zones for the next trading session, and price reactions around them may signal either trend continuation or a short-term reversal.
Transferring Levels to the Trading Timeframe
For intraday trading, timeframes such as 5 minutes, 15 minutes, or 1 hour are commonly used. PDH and PDL should be transferred to these timeframes and drawn as horizontal lines.
These lines act as reference levels and are used to analyze market strength, breakouts, and potential price reactions.
Keeping the Lines Fixed Throughout the Trading Session
The Previous Day’s High and Low (PDH and PDL) belong strictly to the prior day and should not be adjusted during the current trading day. This consistency allows traders to evaluate price behavior relative to these levels without ambiguity.
Any modification or updating of these levels during the session invalidates their analytical value and can lead to misinterpretation of market structure and liquidity.
Validation Using Other Timeframe Data
In certain markets-especially highly liquid assets-checking the alignment of PDH/PDL with the highs and lows of different trading sessions (Asia, Europe, New York) enhances analytical accuracy.
When overlap occurs, the level is considered a stronger and more valid liquidity zone.
Are PDH and PDL Reliable?
PDH and PDL levels serve as references for analyzing price behavior in intraday trading; however, their reliability is not consistent under all conditions. Their validity depends on market structure, the presence of meaningful liquidity zones, and how price reacts to these levels.
Below are scenarios in which these levels tend to be most reliable, as well as conditions where they should not be relied upon in isolation. Table of Valid vs. Invalid Conditions for PDH and PDL:
Valid Conditions | Invalid Conditions |
Stable market structure on the Daily timeframe; absence of sudden spikes and abnormal volatility; orderly and analyzable price reactions | High-impact news releases; extreme volatility and unpredictable behavior; very high probability of false breakouts |
Balanced volume when price approaches the level; active trader participation and real liquidity; higher probability of valid breakouts or reversals | Sharp decline in trading volume during low-liquidity sessions or illiquid markets |
Overlap of PDH/PDL with major structural levels; reinforcement by pivots, supply/demand zones, or higher highs/lows; formation of effective liquidity zones | Irregular structure on higher timeframes; ranging markets or unstable, directionless breakouts |
Candle reactions with clear patterns such as long wicks, reversal candles, or strong confirmed breaks; signs of valid liquidity absorption or rejection | Fast breaks without consolidation; quick penetrations without confirmation candles, often caused by liquidity grabs |
How to Use PDH and PDL in Trading
Before the market opens, traders should mark PDH and PDL on their charts. These levels can be manually drawn and used throughout the trading session to assess potential trade setups.
Then, the price reaction to these levels during the current session is analyzed; a valid break of the PDH or PDL may indicate liquidity absorption and continuation of the move.
while failure to break and rejection from these zones often creates reversal trading opportunities with controlled risk.
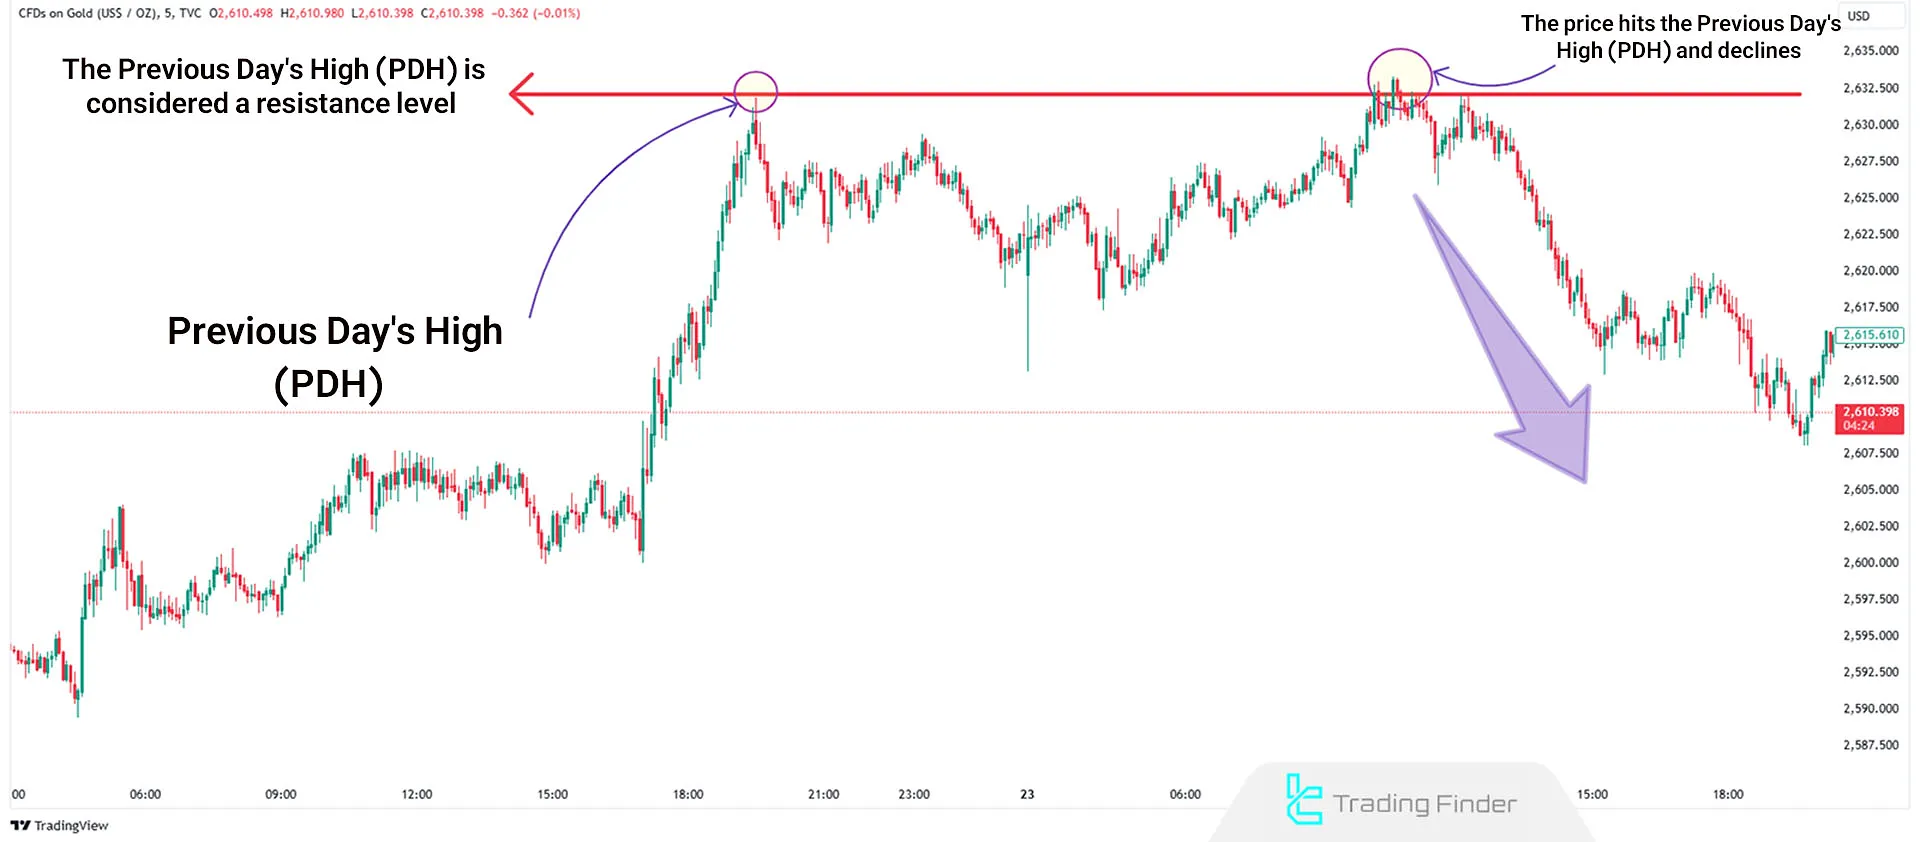
Example of a Bearish Trade Using PDH
In a 5-minute gold chart, if the price reaches the PDH zone, traders can look for bearish reversal patterns near this level. This setup provides an opportunity to open sell positions.
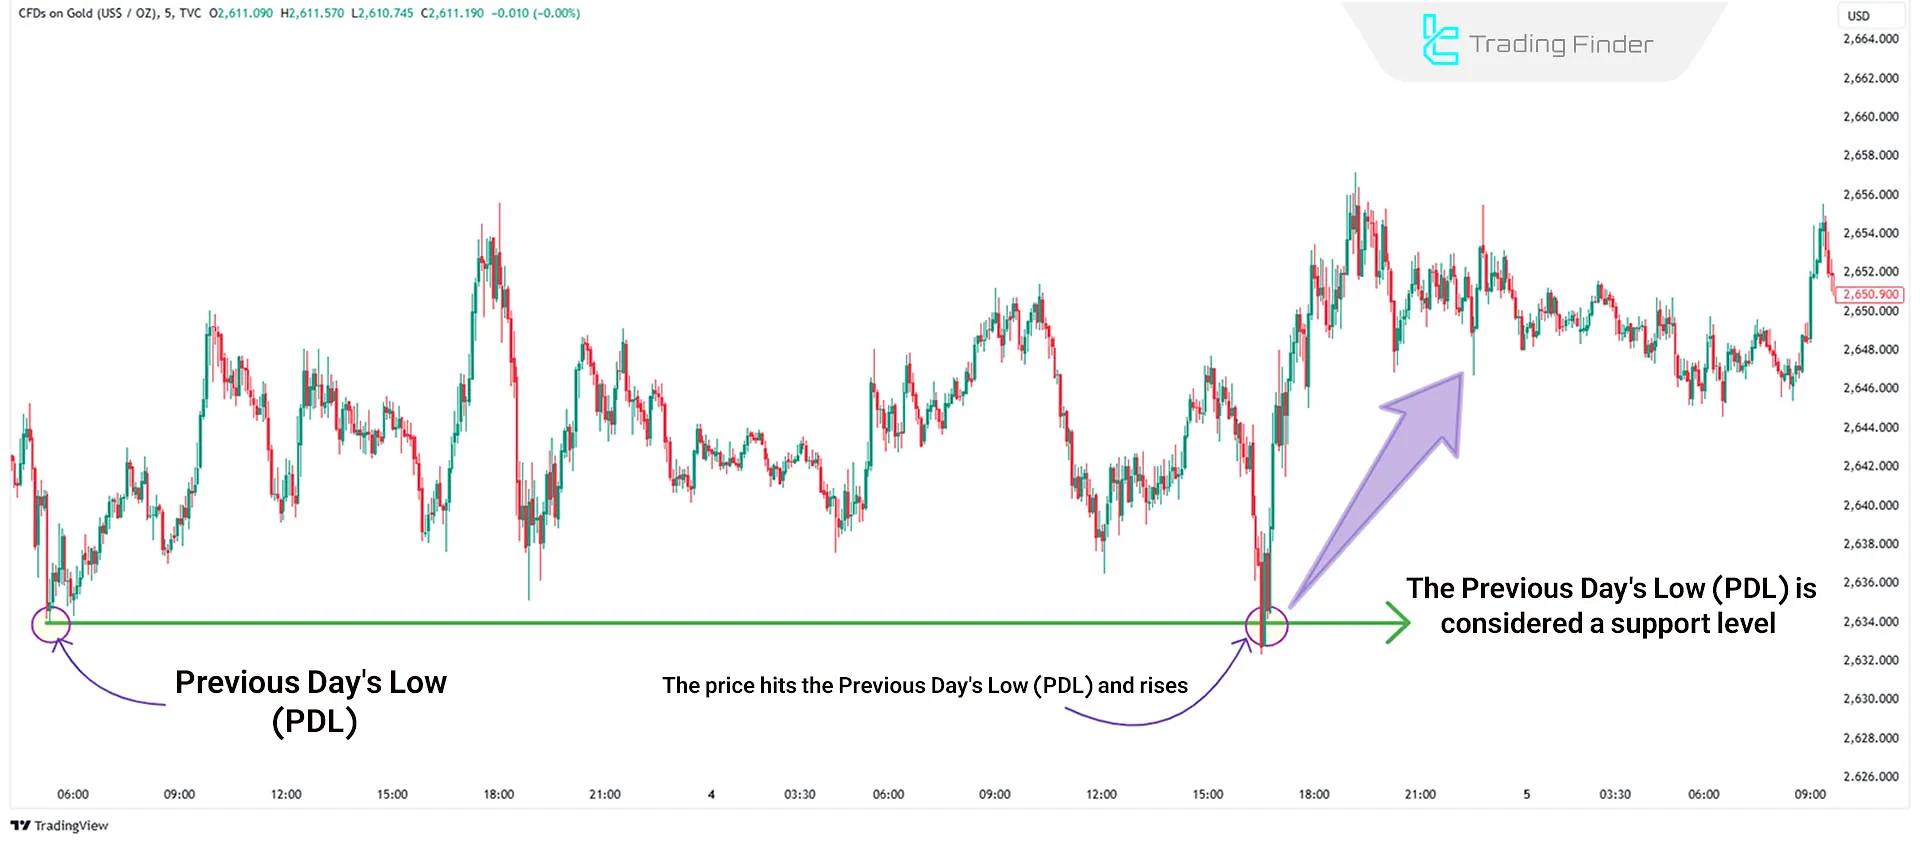
An Example of Sell Trading with PDL
In a 5-minute gold chart, if the price reaches the PDL zone, traders can look for bullish reversal patterns near this level. This setup creates an opportunity to enter buy positions.
PDH and PDL Indicator
The Daily High and Low indicator is a specialized tool for identifying the previous day’s price range and displays exactly the same concept known in analytical approaches such as ICT as PDH (Previous Day’s High) and PDL (Previous Day’s Low).
This indicator automatically marks the two main levels of the previous day and, by drawing fixed lines, provides a clear framework for analyzing price behavior in the new trading day. Educational videos on how to use the Daily High and Low indicator:
PDH and PDL levels are considered among the most important reference points in daily analysis, as many price movements form around these areas. Price reactions to these levels reflect how liquidity is distributed and absorbed, offering valuable insights into market sentiment.
The Daily High-Low indicator, by accurately displaying these levels, enables a more structured analysis and allows traders to view key levels from the previous day without manually reviewing historical data.
Due to its ease of use, fast identification, and direct presentation of the prior day’s price range, this tool is applicable to all analytical styles, including price action, support and resistance, multi-timeframe analysis, and the ICT methodology.
In addition to displaying the previous day’s price range, this indicator can highlight the significance of price movement relative to PDH and PDL. For example, when price approaches the prior day’s range, the ability to assess market strength or weakness and to analyze potential reversals or breakouts increases.
One of the main advantages of this indicator is its automatic identification of levels that are commonly recognized as liquidity zones. This feature allows for more precise observation of price reactions around PDH and PDL.
Its settings are also simple and only include selecting the colors of the lines representing the previous day’s high and low. Therefore, without unnecessary complexity, it delivers only the most essential information needed for daily market analysis.
Overall, this indicator is the automated version of displaying PDH and PDL and, by providing a clear framework of the previous day’s price range, helps with structural analysis and evaluating price behavior in the new trading day.
Download links for the Daily High and Low indicator:
Conclusion
The Previous Day’s High (PDH) and Previous Day’s Low (PDL) are essential reference points for day traders. These levels help traders understand price behavior and market sentiment while acting as key support and resistance levels.
Price reactions around these zones often provide high-probability trade setups. PDH and PDL levels represent liquidity accumulation zones-areas where price behavior is usually more structured and where market algorithms tend to react.
Analyzing how price approaches PDH and PDL can provide signals about trend strength, the likelihood of a breakout, or the market’s tendency toward a reversal.


