


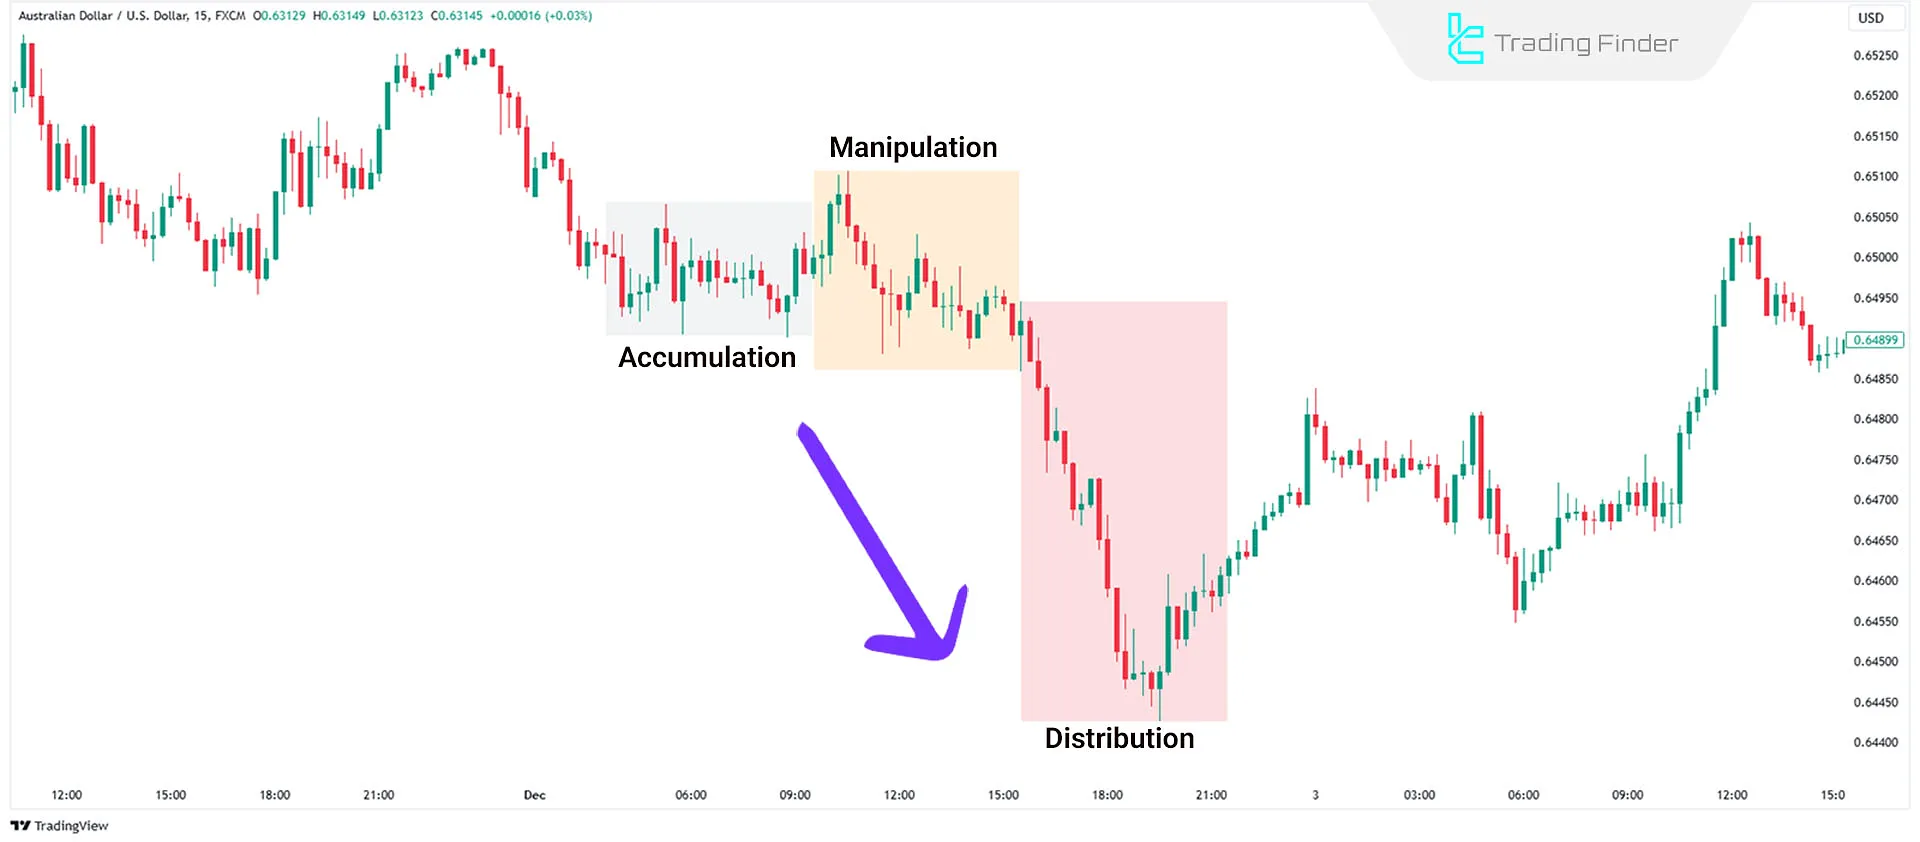
Accumulation, Manipulation, and Distribution (ICT Power of 3 strategy) is a trading strategy designed to help retail traders identify the movements of Smart Money. This approach divides market activity into three stages [Accumulation, Manipulation, and Distribution].
Large financial institutions discreetly accumulate assets during the accumulation phase without attracting attention.
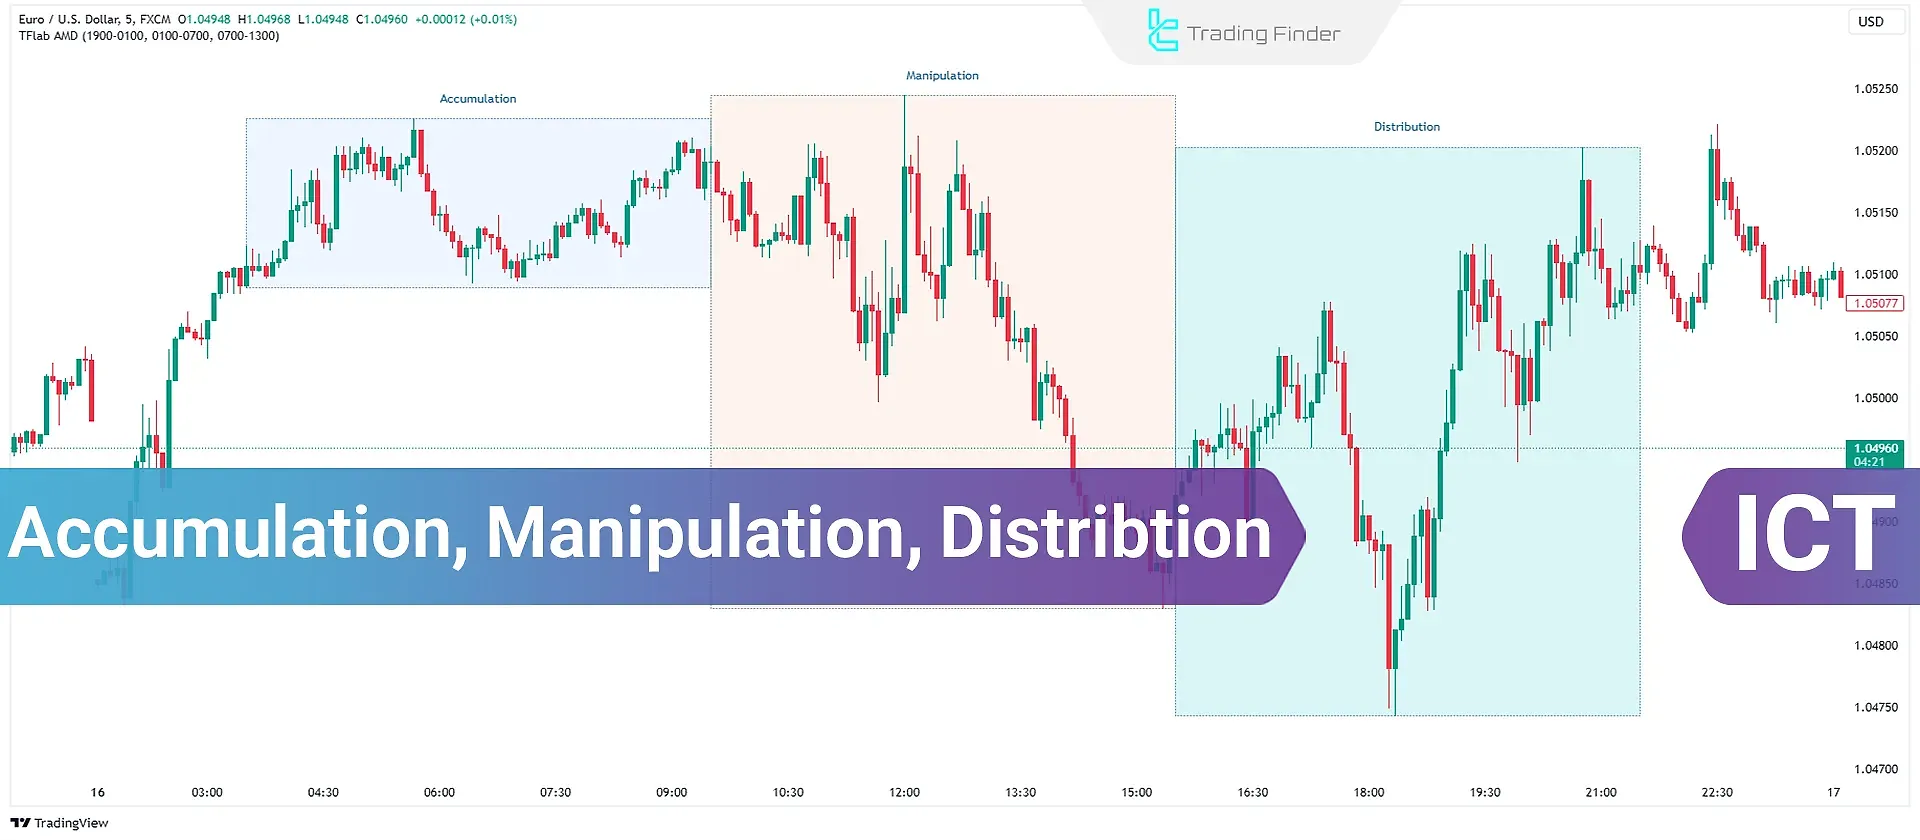
In the manipulation phase, the market deceives retail traders into making incorrect decisions through misleading price movements.
Finally, in the distribution phase, Smart Money drives the market in its desired direction to maximize profits.
What are Accumulation, Manipulation, and Distribution?
Accumulation, Manipulation, and Distribution (or AMD) are the three key phases of a potential price movement in the ICT trading style.
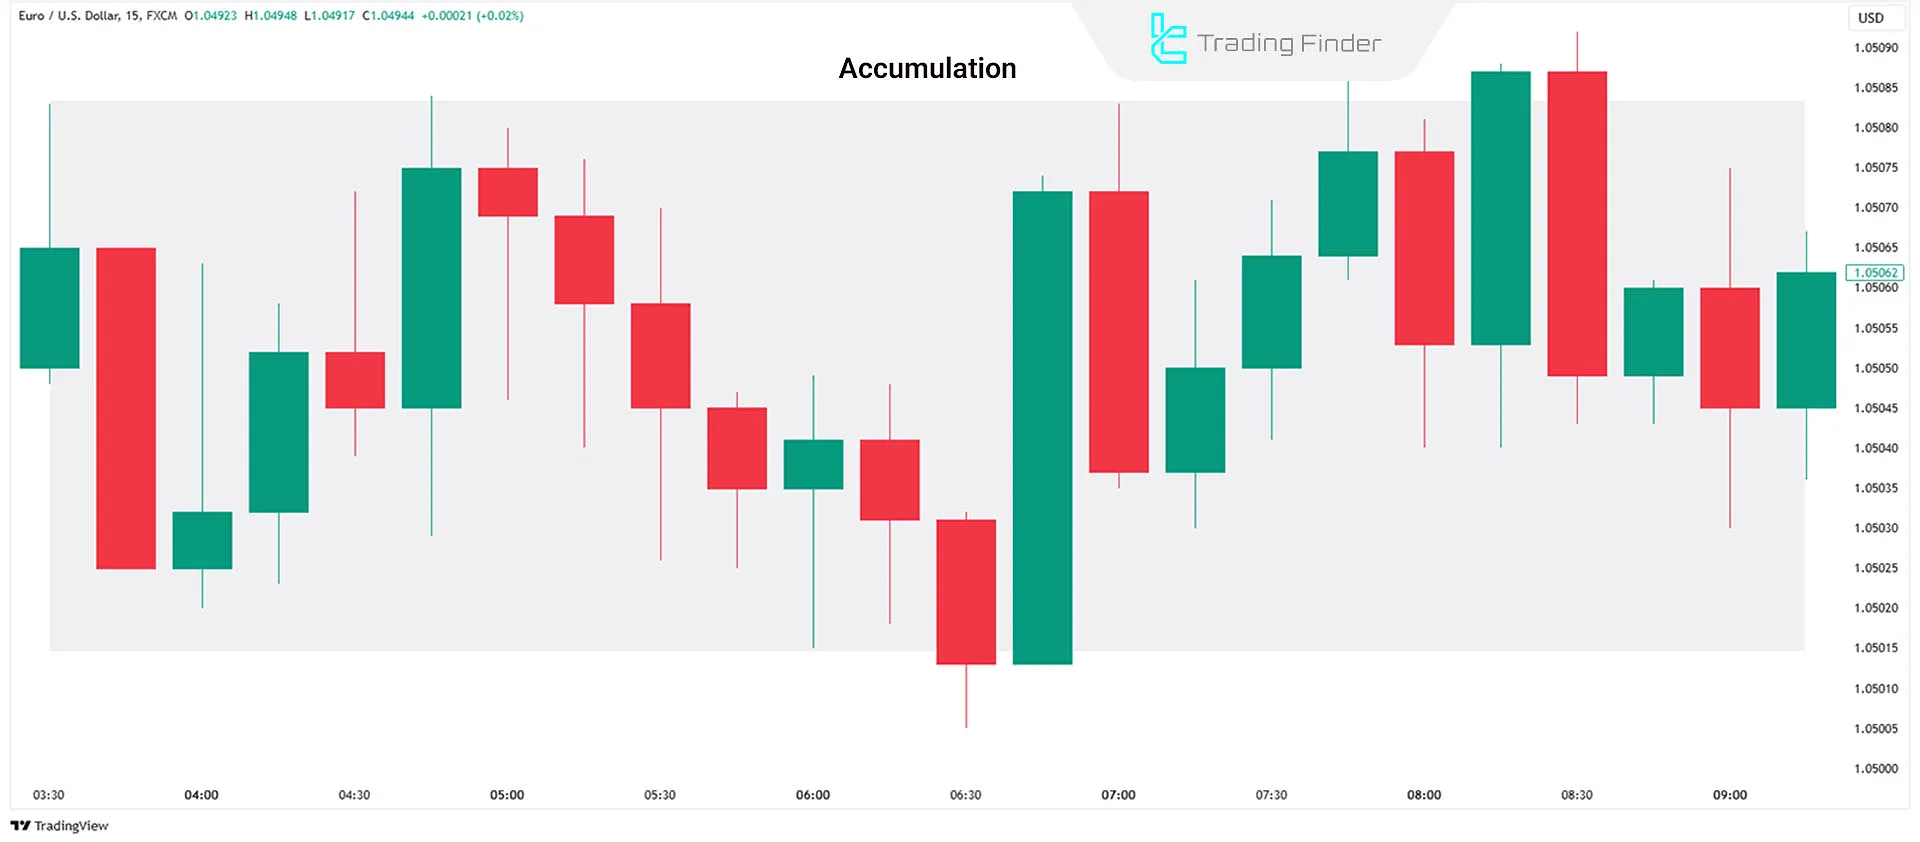
Accumulation Phase
The accumulation phase starts at the market opening, where the price moves within a narrow range near the opening price. During this stage, Smart Money builds its position quietly.
Although the price appears trapped, it signals preparation for a larger movement. In accumulation, retail traders typically place buy orders at horizontal support and sell orders at horizontal resistance.
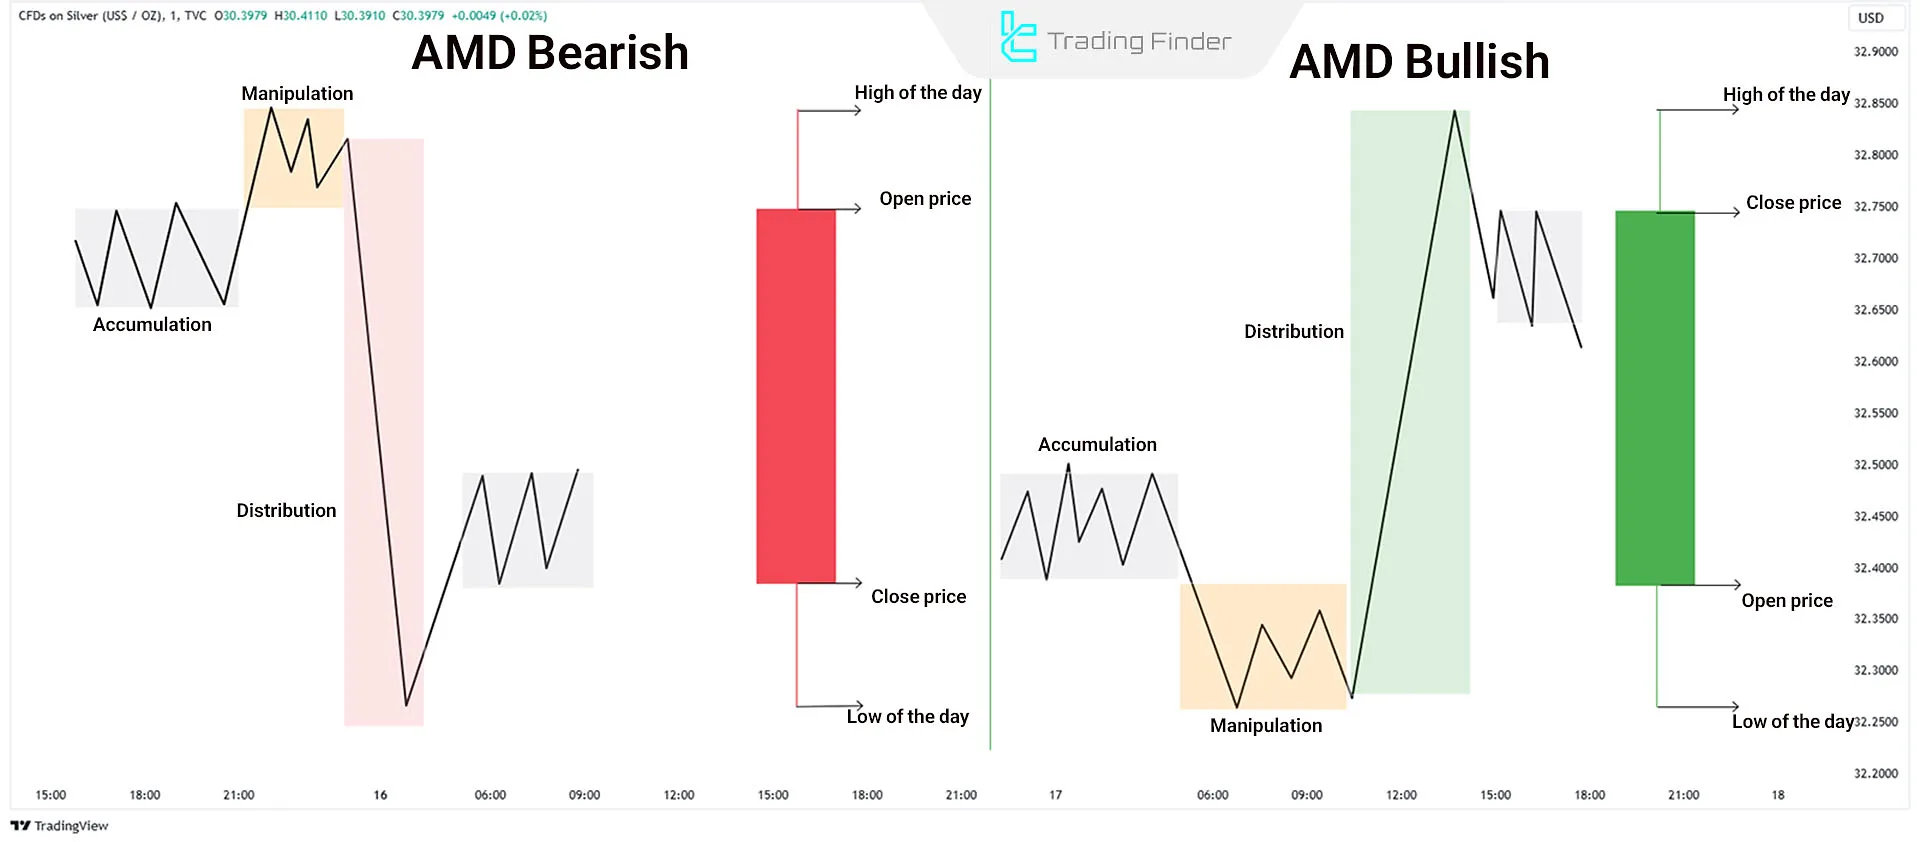
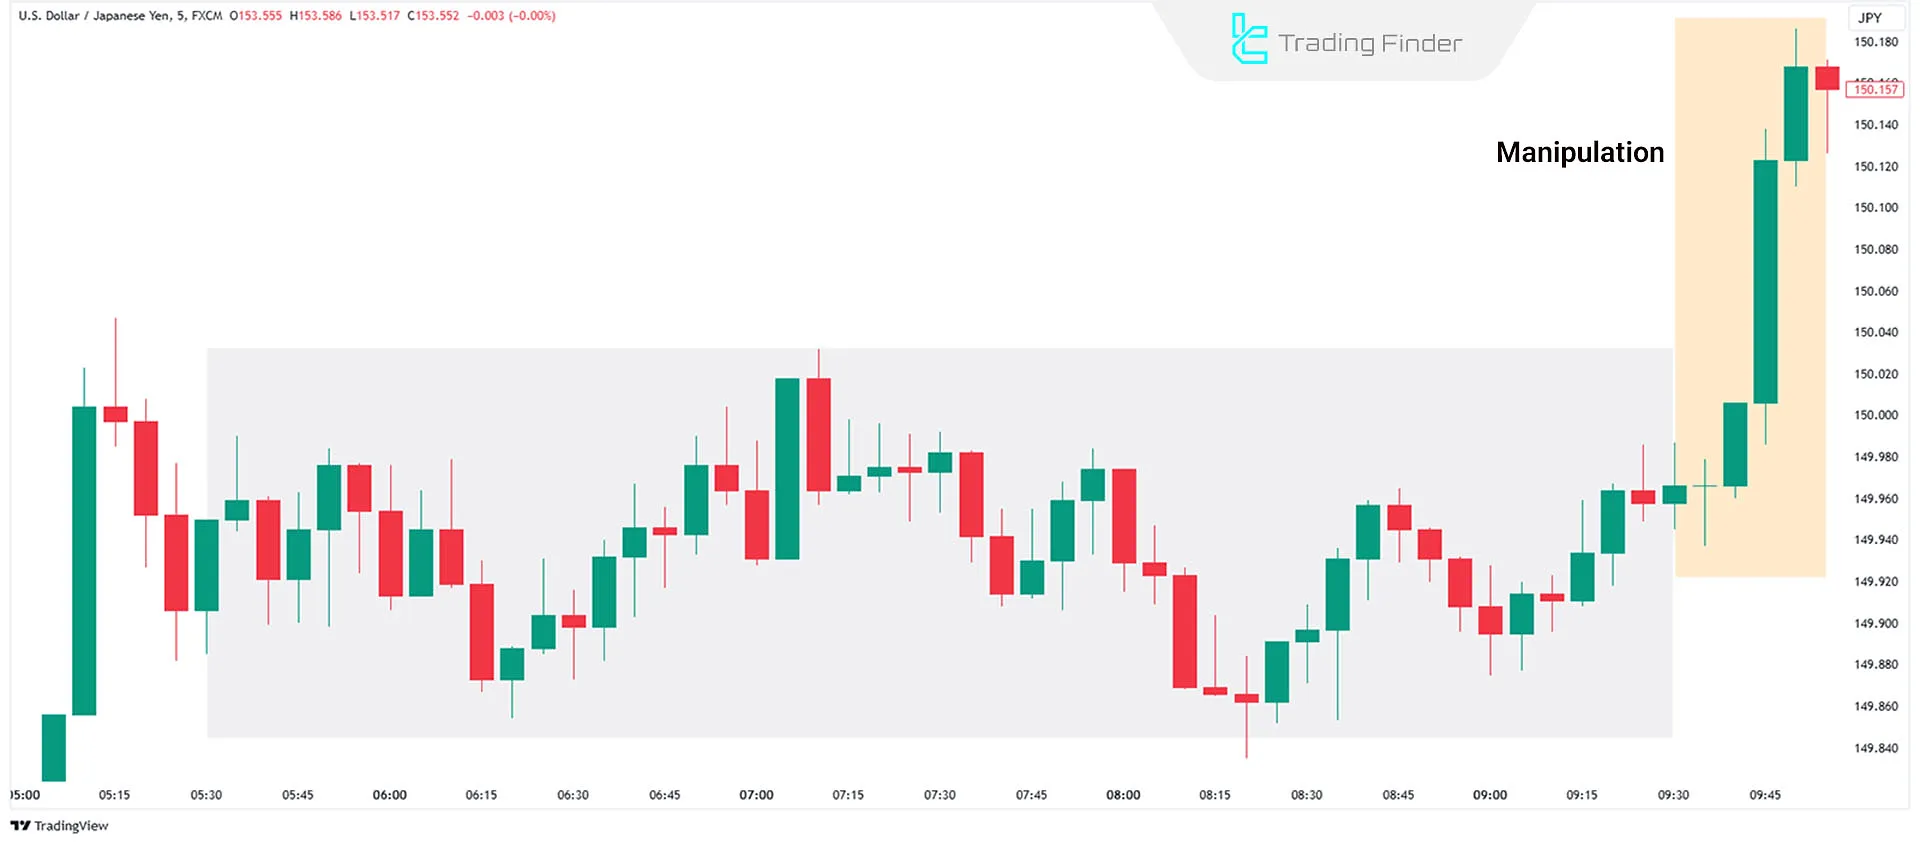
Manipulation Phase
This phase is designed to mislead retail traders. After accumulation, Smart Money drives the market in the opposite direction:
- On bearish days, retail traders are enticed to buy
- On bullish days, traders are persuaded to sell
This is achieved through a false breakout of the accumulation range:
- If the price breaks above the range, it triggers sellers' stop losses and prompts new buyers to enter
- If the price breaks below the range, it triggers buyers' stop losses and prompts new sellers to enter
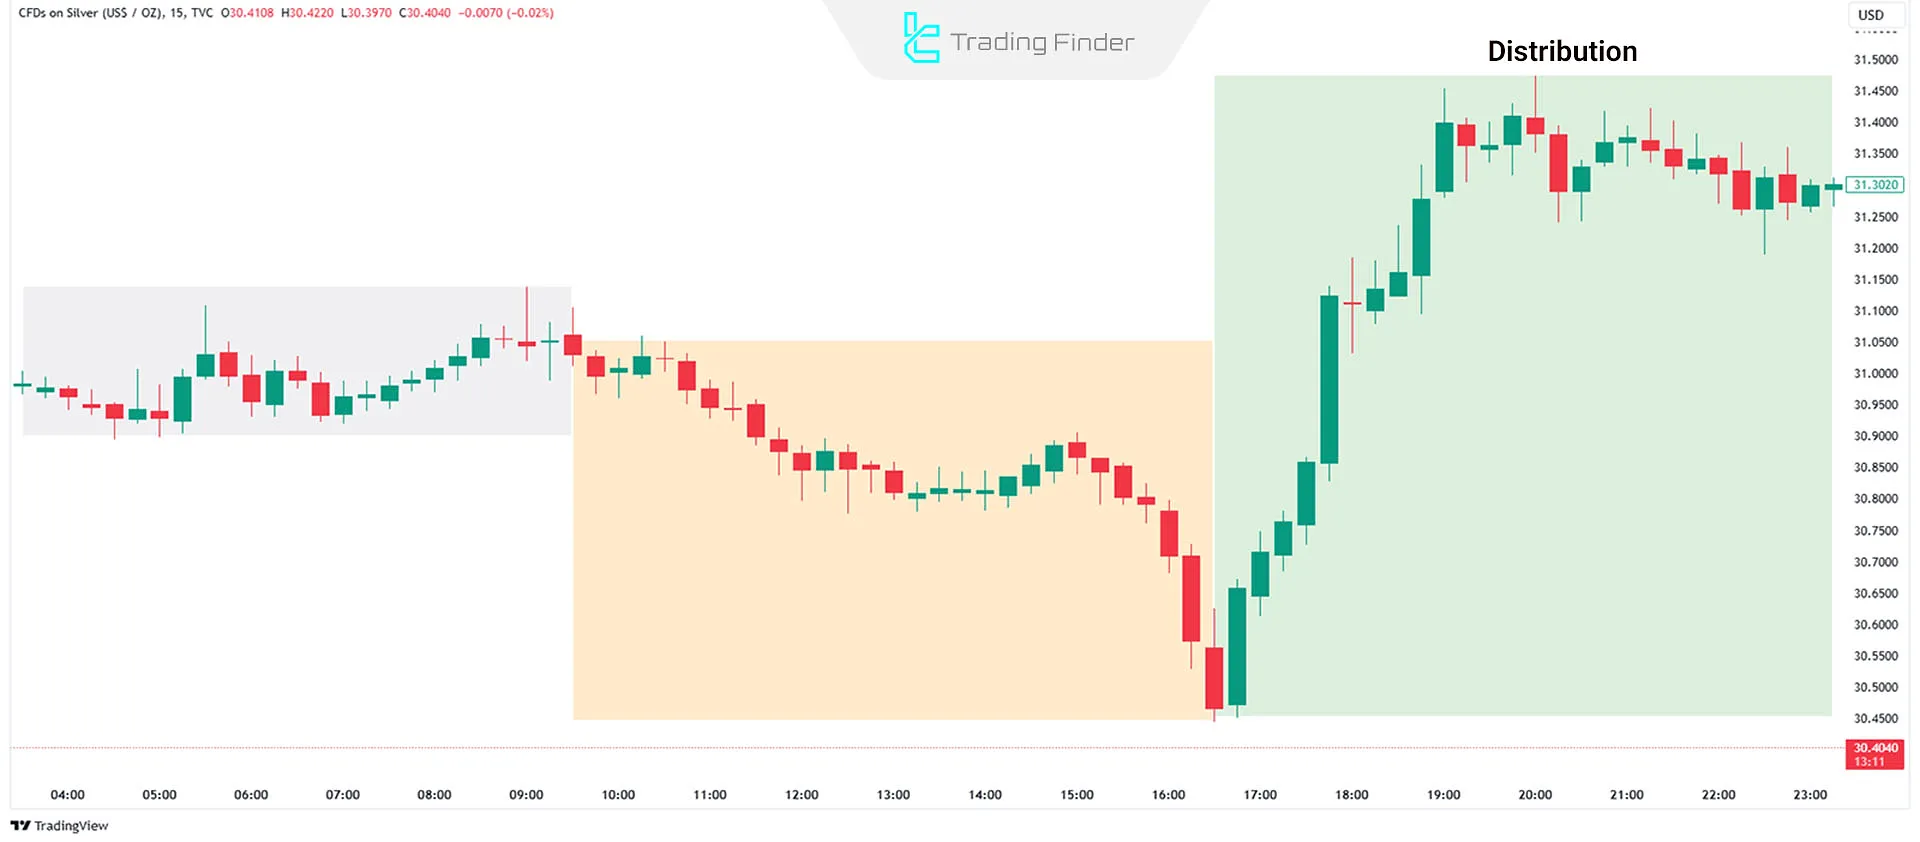
Distribution Phase
The AMD strategy's final stage is the distribution phase, which reflects the day's main market movement.
During this phase, Smart Money strengthens its positions after deceiving retail traders and absorbing their liquidity.
Then the market will move into the opposite direction of retail traders' expectations.
Educational video Power of Three from the YouTube channel T Trades:
Logic of Liquidity Flow in Power of Three
In the PO3 model within ICT, the focus is on the movement of liquidity structure among the three main market phases.
To create directional movement, the market must attract liquidity from both sides. Initially, price consolidates in a balanced area where “Equal Highs” or “Equal Lows” are formed.
Then, a false breakout (Liquidity Grab) occurs to trigger pending orders and release liquidity this represents the manipulation phase.
After liquidity is absorbed and institutional capital enters, the main directional move is formed, and the market transitions into the distribution phase.
Instead of focusing on price signals, PO3 tracks the liquidity flow among accumulation, manipulation, and distribution.
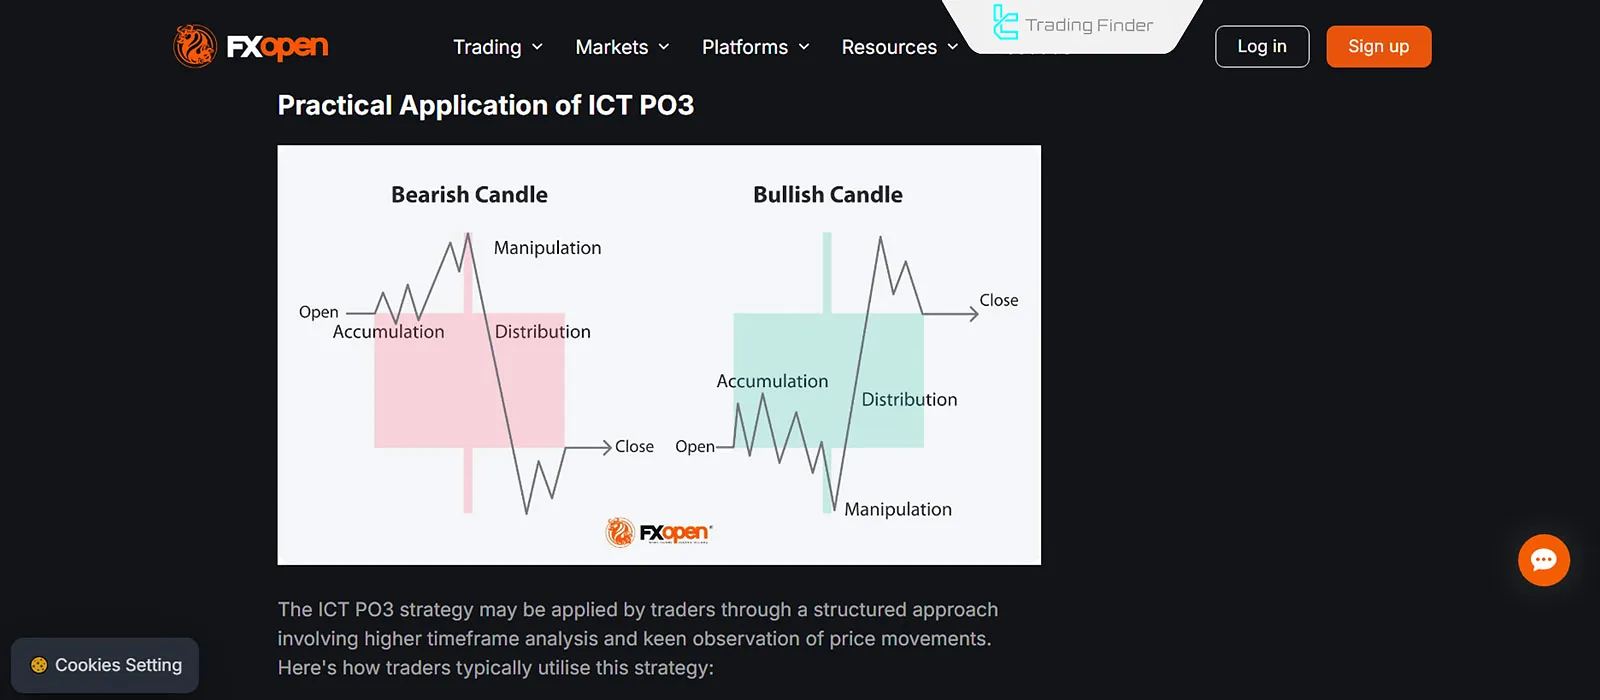
This approach allows traders to identify the path of liquidity and the entry point of smart money before the main move begins. Practical power of three training FXopen:
Daily Bias Analysis Before Executing PO3 in ICT
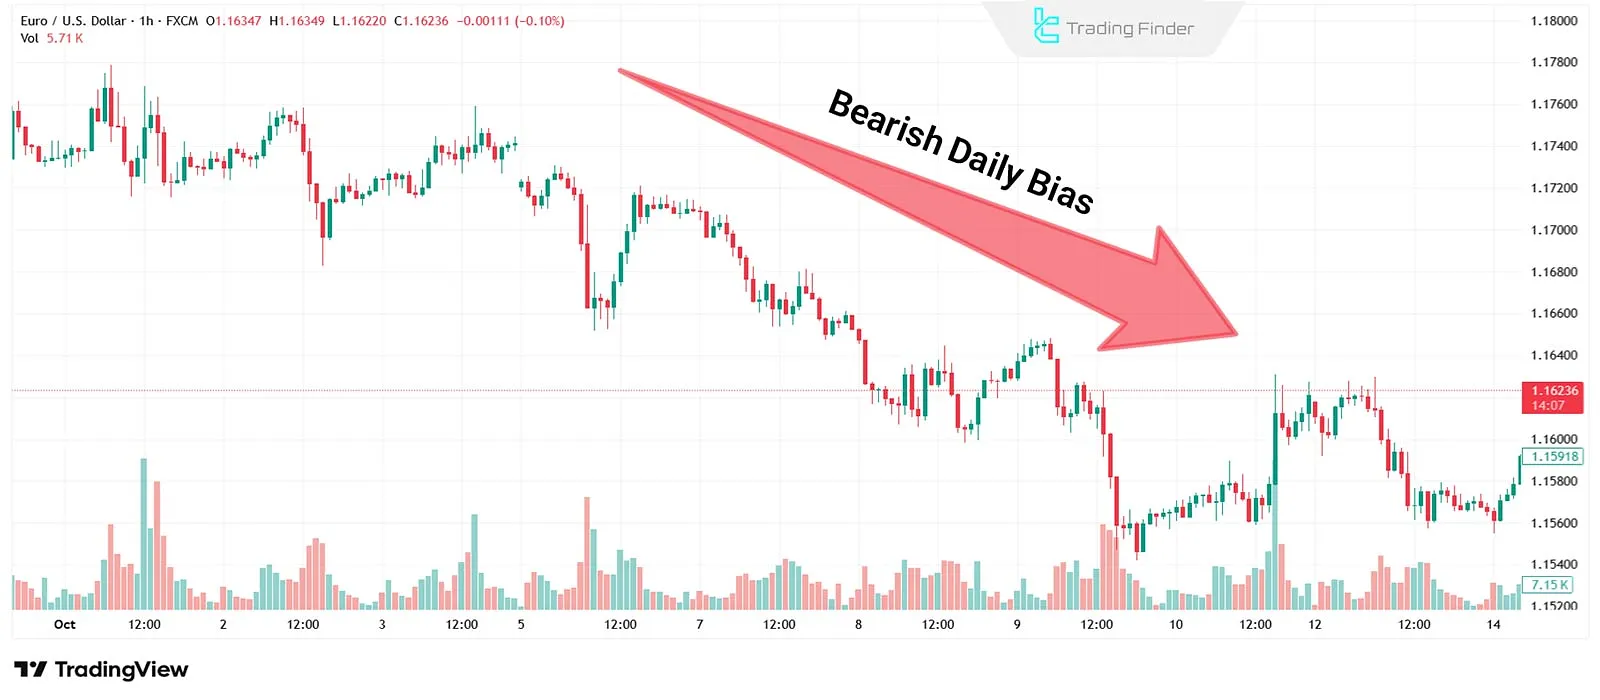
Before applying the Power of Three model, determining the Daily Bias is essential, as the overall daily direction defines the framework for identifying accumulation, manipulation, and distribution phases.
Daily bias analysis is based on Higher Timeframe Structure (HTF Structure), Imbalance Zones, and Order Flow. The trader first reviews the previous day’s candles to identify the daily high and low range to determine where liquidity is concentrated (buyers or sellers).
If liquidity is mainly located above the previous day’s high, the daily bias is bearish, and it is expected that the market will first grab the upside liquidity and then enter the distribution phase.
Conversely, if liquidity is concentrated below the previous day’s low, the bias is bullish, and manipulation usually happens through a temporary downside move.
Advantages and Limitations of the Power of Three (PO3) Model in ICT Analysis
The Power of Three model is one of the core structures in the ICT methodology that interprets smart money behavior through the three main market phases.
Despite its high accuracy in identifying entry and exit points, this model has certain limitations that are important to understand for practical use.
Feature | Advantages | Limitations |
Understanding Liquidity Flow | Focuses on the real location of liquidity and smart money footprints rather than superficial price patterns | Requires deep mastery of concepts like Liquidity Pool and HTF structure |
Entry and Exit Precision | Provides low-risk entry points after the Manipulation phase and Order Flow confirmation | May produce false signals in low-volatility markets |
Timeframe Compatibility | Applicable from daily to scalping timeframes using a unified liquidity logic | Identifying phases in lower timeframes is harder and more error-prone |
Market Psychology Analysis | Understands retail traders’ emotional reactions versus organized smart money moves | Requires analytical experience to distinguish between fake and real phases |
Integration with SMC Tools | Works well with structures like OB, FVG, and BOS | Without structural confirmation, may lead to overfitting |
What Is the AMD Strategy Based On?
The ICT Power of Three strategy focuses on market psychology:
- Accumulation Phase: Encourages traders to wait patiently
- Manipulation Phase: Creates conditions that trigger emotional reactions from traders
- Distribution Phase: Provides opportunities to trade in the correct market direction

How to Trade with the ICT Power of 3 Strategy?
To implement the ICT Power of 3 strategy:
- Identify Daily Bias: Predict the overall price movement and the next daily candle direction
- Analyze Smaller Timeframes: Use lower timeframes to identify the distribution phase
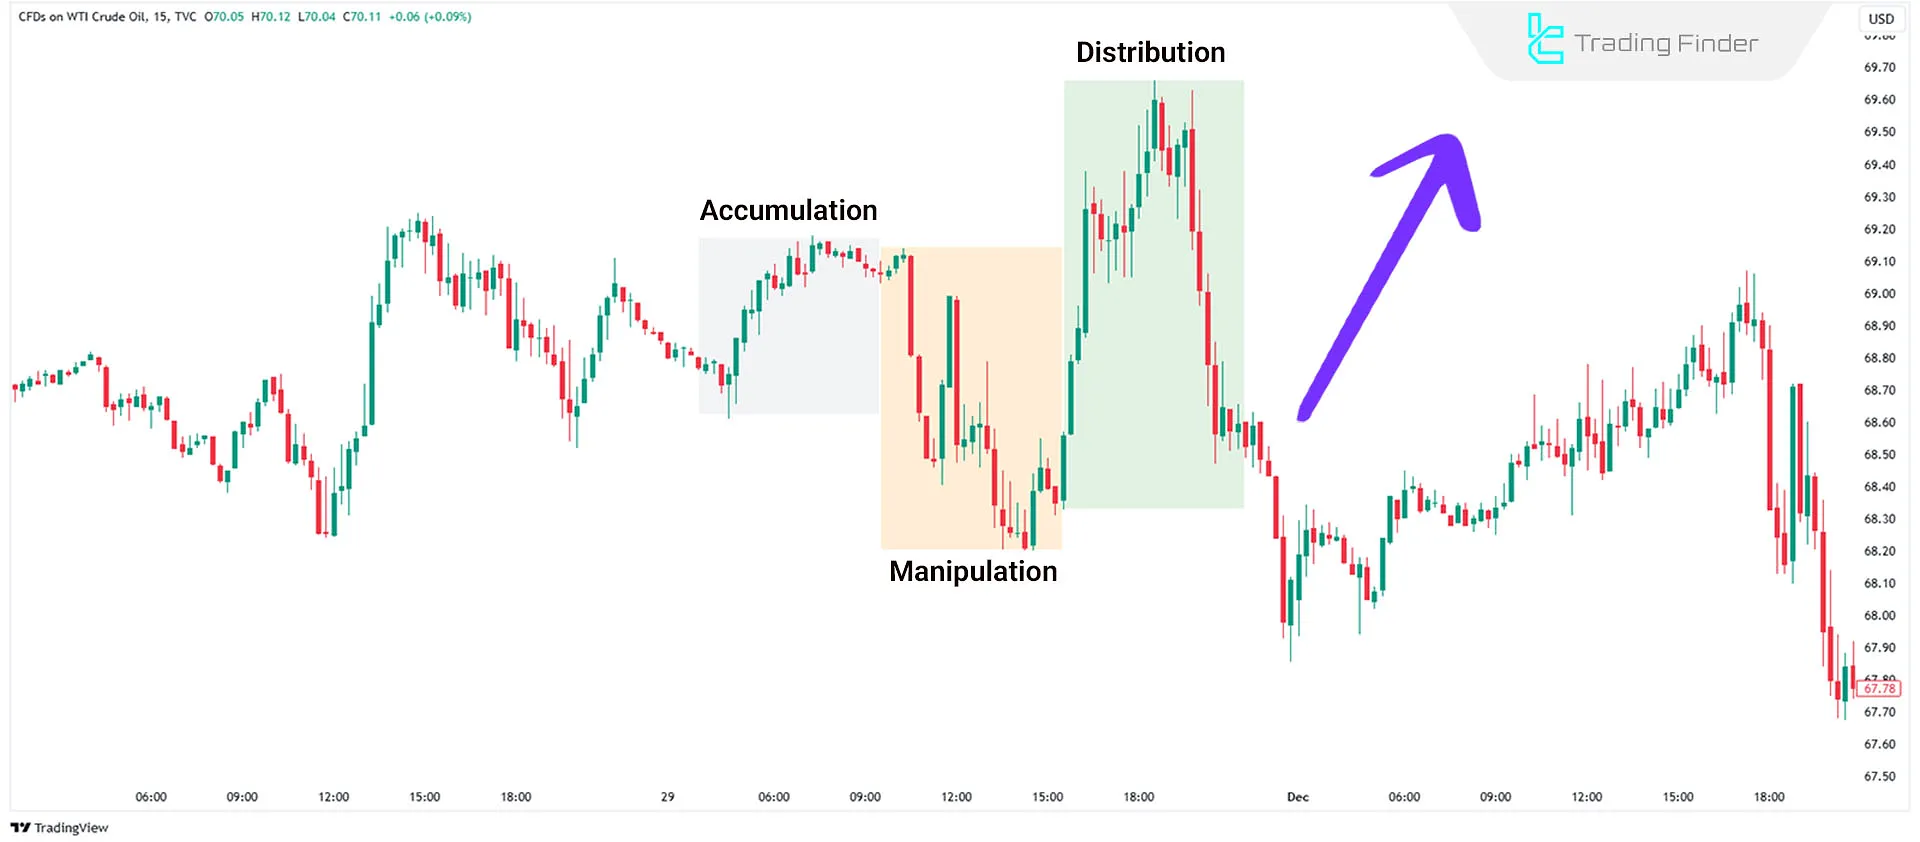
Example of Power of Three in a Bullish Market
The following steps outline trading with the Power of Three in an uptrend:
- Price Consolidation Near Opening Price: Price stabilizes near the daily opening price, and Smart Money builds buy positions;
- Sudden Sell-Off: A quick downward movement traps retail traders and targets old lows;
- Retail Traders' Losses: Retail buyers face losses due to a false breakout, allowing Smart Money to complete their buy positions at lower;
- Upward Move Towards Old Highs: Price moves towards old highs, activating buy stops and gathering liquidity;
- Reaching the Day's High: Smart Money exits buy positions and initiates sell trades at the day's high;
- Return to Daily Range: After liquidity is absorbed, the price returns to the daily range, marking the end of the trading day.
Power of Three strategy in a Bearish Market
The following steps outline trading with the Power of Three strategy in a downtrend:
- Price Consolidation Near Opening Price: Price stabilizes near the daily opening price, and Smart Money builds sell;
- Sudden Buying Pressure: A quick upward movement traps retail traders and targets old highs;
- Retail Traders' Losses: Retail sellers face losses due to a false breakout, allowing Smart Money to complete their sell positions at higher prices;
- Downward Move Towards Old Lows: Price moves towards old lows, activating sell stops and gathering liquidity;
- Reaching the Day's Low: Smart Money exits sell positions and initiates buy trades at the day's low;
- Return to Daily Range: Once liquidity is absorbed, the price returns to the daily range, signaling the conclusion of the trading day.
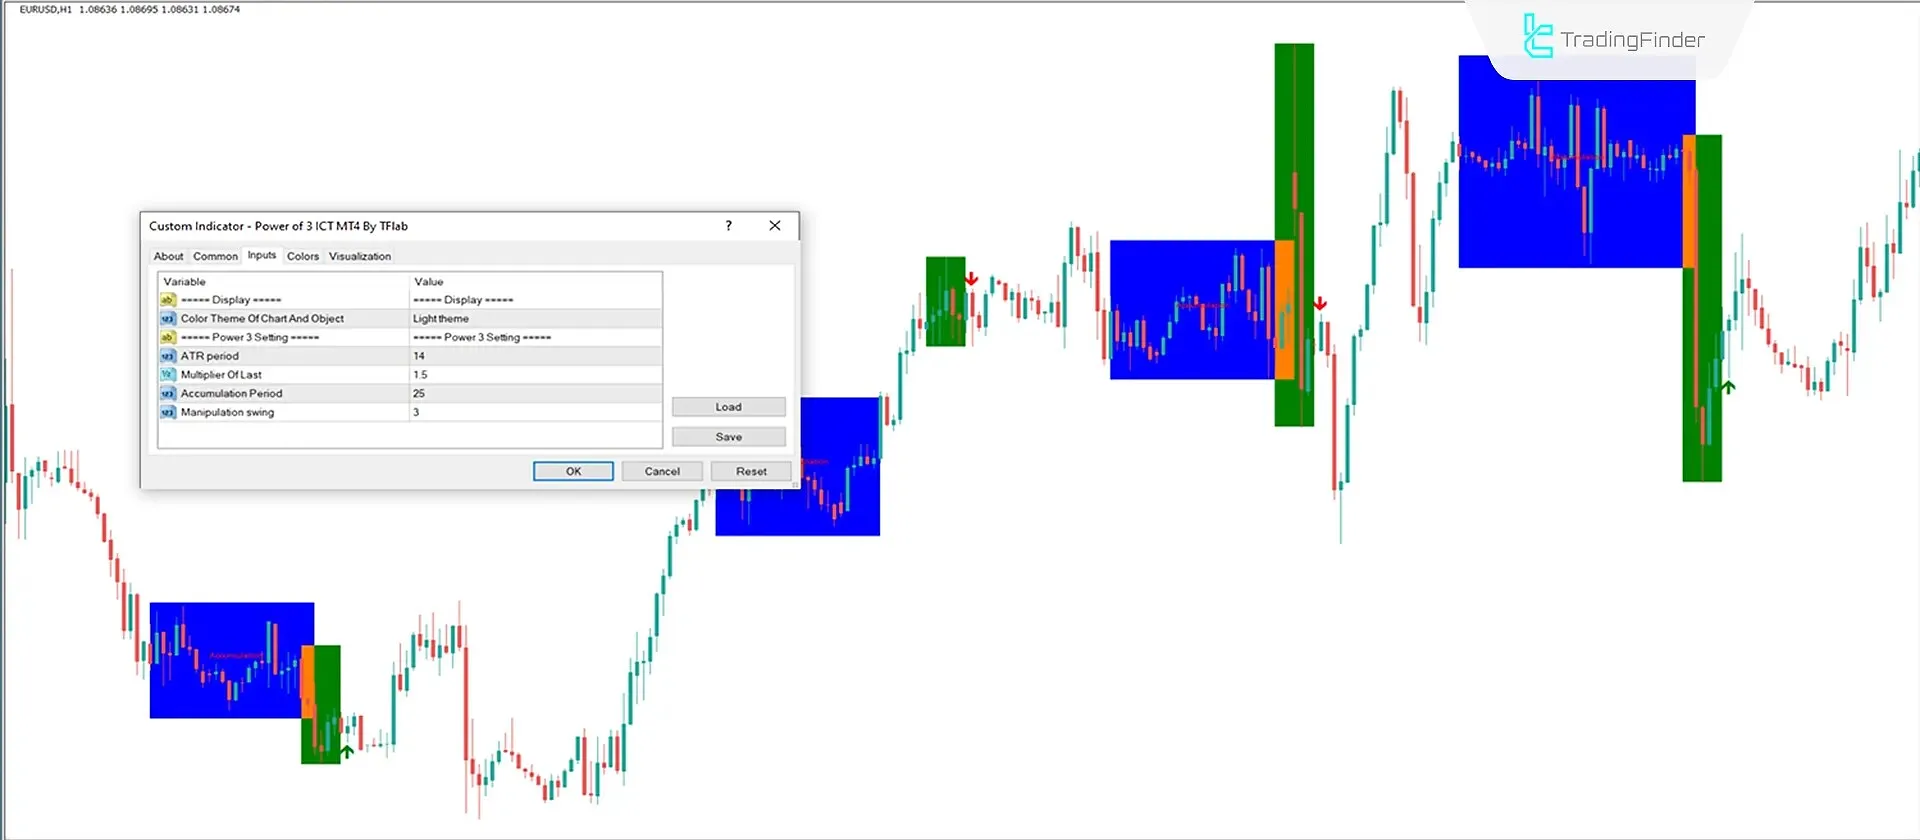
Power of Three (PO3) Indicator
The Power of Three (PO3) Indicator is designed based on Smart Money and ICT trading Strategy. It identifies the three key market phases Accumulation, Manipulation, and Distribution and generates trading signals accordingly.
On the price chart, accumulation zones are highlighted with red boxes, and manipulation zones are shown with green boxes.
After the manipulation phase ends and the main price movement begins, the indicator issues a green arrow (Long signal) for buying and a red arrow (Short signal) for selling.
This feature makes the Power of Three indicator a powerful tool for early detection of trend reversals. Educational Videos:
The indicator can be used across Forex, cryptocurrencies, stocks, and commodities. It is fully compatible with Price Action, ICT, and Smart Money trading styles suitable for both day trading and scalping.
In a bullish trend, when price breaks out of the accumulation zone, the indicator identifies the manipulation phase and issues a buy signal.
In a bearish trend, after price exits the manipulation area, a sell signal is generated.
Within the settings panel, parameters such as ATR Period (Average True Range), Accumulation Period, and Manipulation Swing can be adjusted, allowing full customization of the indicator.
As a market structure-based analytical tool, this indicator helps identify smart liquidity movements and the probable trend direction by analyzing price reactions in key zones.
Its performance significantly improves when combined with tools such as FVG (Fair Value Gap) and Order Block indicators. Download Links for Power of Three Indicator:
- Power of Three Indicator for MetaTrader 4
- Power of Three Indicator for MetaTrader 5
- Power of Three Indicator for TradingView
Relationship Between PO3 in ICT and the Structures of Order Block and FVG
In the PO3 model, the phases of Accumulation, Manipulation, and Distribution often occur simultaneously with the formation of key structures such as Order Blocks and Fair Value Gaps (FVGs).
These two elements serve as clear signs of smart money entry and indicate the continuation path of price movements.
During the manipulation phase, a false breakout often creates a price gap, or FVG, on lower timeframes. This gap reflects the uneven volume of orders and a shift in liquidity flow.
Later, during the retracement phase, the market tends to return to the FVG area to fill the imbalance confirming renewed smart money participation.
On the other hand, Order Blocks typically form at the end of the manipulation phase and the beginning of the distribution phase. These blocks mark the zones where institutional orders are finalized and where trend movements begin.
Combining Order Block and FVG analysis with the three-phase PO3 cycle greatly enhances the precision of entry and exit identification, as it allows traders to track liquidity flow, price equilibrium, and smart money footprints within a single, coherent framework.

Which Currencies Are Suitable for the Power of Three Strategy?
The ICT Power of Three strategy was originally developed for indices such as NASDAQ and E-mini, where it demonstrated strong results.
It was later extended to Forex pairs and precious metals, and today it is widely used in trading major currency pairs like GBP/USD and EUR/USD, as well as commodities such as XAU/USD (Gold).
Conclusion
The ICT Power of 3 style, focusing on market psychology and its three main phases Accumulation, Manipulation, and Distribution is an effective method for identifying Smart Money movements.
This strategy offers high flexibility across various markets, including indices, forex, and commodities, enabling traders to leverage the Power of Three in these markets effectively.
In addition, a proper understanding of the three phases allows the trader to identify entry and exit points with greater precision and alignment with the market’s liquidity flow.


