


The SCOB strategy in the ICT trading style is designed based on a single candlestick (Order Block or Order Block Candle). This candle forms in a specific area with a distinct visual pattern, creating a critical zone. When the price returns to this zone, a trading opportunity arises.
In this structure, the behavior of the middle candle is recognized as the decision making center, and within the context of a single candle order block, the price reaction to it plays a decisive role in identifying the market’s new direction.
When this zone is retested, the liquidity absorbed by smart money becomes active, and this dynamic, commonly analyzed as scob in trading, provides traders with a low risk and reliable entry point.

What is Single Candle Order Block (SCOB)?
A Single Candle Order Block (SCOB) is a candlestick that forms in a Point of Interest (POI) and aligns with price reversals. The appearance of this candle serves as a strong confirmation of a market reversal. By using the highest and lowest points of this candle, a key trading zone can be drawn.
Structural Nature of SCOB and the Role of Three Candles
A single candle order block is not merely one candle, but rather the result of the sequential behavior of three candles that together form a clear structural logic.
The first candle establishes the initial POI zone. The second candle, by breaking above the high or below the low of the first candle, sweeps the hidden liquidity and reveals the presence of smart money.
The third candle confirms this movement and, by closing in the favorable direction, solidifies the reversal condition.
This pattern is built on the concept of “Liquidity Sweep”, and the primary reason for the strong price reaction upon returning to the SCOB zone is precisely this liquidity collection.
In the SCOB educational article on the Writo Finance website, this ICT style concept is explained in full.
Advantages and Disadvantages of the SCOB Strategy
Using this strategy has its own set of advantages and disadvantages:
Advantages | Disadvantages |
Applicable in all trading timeframes | Poor performance during ranging markets |
Identifies suitable entry zones in terms of risk-to-reward ratio | Requires significant experience and skill |
Applicable in all trading timeframes | - |
Suitable and Unsuitable Market Conditions for SCOB
SCOB shows very strong performance in trending markets, because in such conditions smart money continuously accumulates liquidity and creates directional moves, a behavior widely analyzed within scob trading.
In contrast, in ranging markets, fake sweeps and short term reversals are frequent, which reduces the accuracy of the scob pattern.
The optimal scenario occurs when the market first makes a strong directional move, then returns toward the POI through a logical correction, and a scob candle forms in that same area.
Reason for the Strong Price Reaction to SCOB
The powerful price reaction to the scob zone results from the presence of pending orders placed by major market participants. During the formation of the second candle, a significant volume of retail traders’ stop losses is triggered, and the released liquidity becomes available to smart money.
This process creates the foundation for the directional movement of the third candle. Therefore, when the market revisits the scob area, unfilled institutional orders are activated, leading to a fast and strong reaction.
This behavior represents one of the most important differences between scob and common candlestick patterns.
Bullish Single Candle Order Block (SCOB)
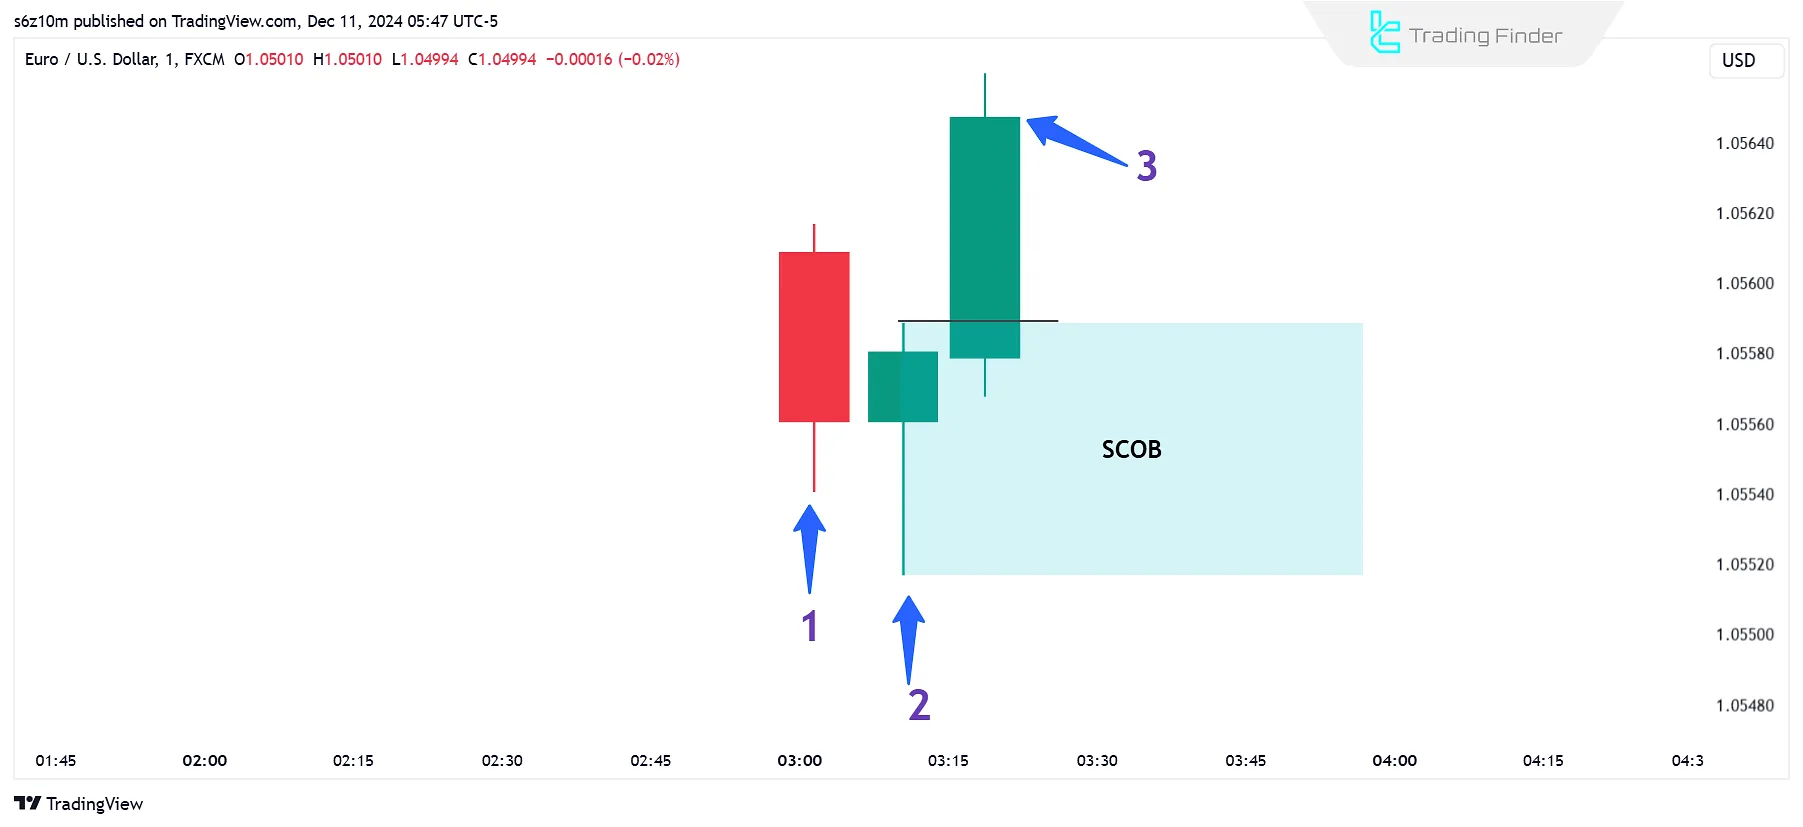
A Bullish Single Candle Order Block forms a favorable zone for price increases. To identify a SCOB, three consecutive candlesticks must be examined, meeting the following conditions:
- The first candle forms in a suitable price increase area. This candle, closes in a bearish state by creating a lower shadow (short or long wick);
- The second candle first drops below the previous candle's low, gathering liquidity beneath it, then rises and closes bullish;
- The third candle must rise and close above the high of the second candle.
Bearish Single Candle Order Block (SCOB)
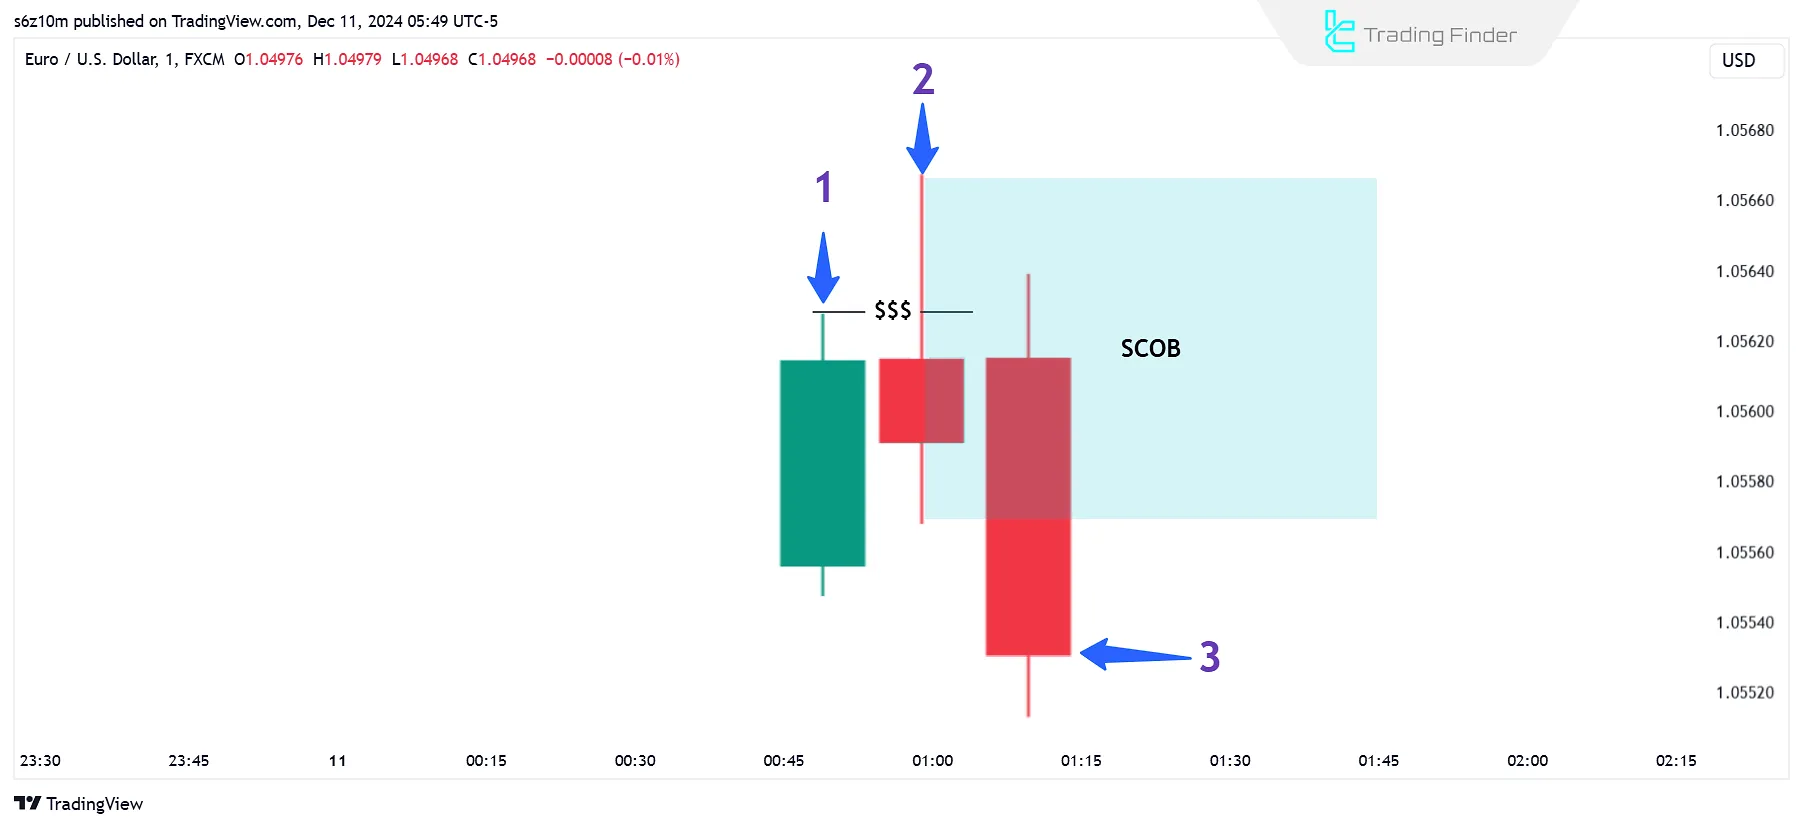
A Bearish Single Candle Order Block forms a favorable zone for price declines. To identify a SCOB, three consecutive candlesticks must be examined, meeting the following conditions:
- The first candle forms in a suitable price decline area. This candle creates an upper shadow (short or long wick) and closes in a bullish state;
- The second candle initially rises above the high of the previous candle, collecting liquidity above it. Then, it falls and closes bearish;
- The third candle must fall and close below the low of the second candle.
How to Correctly Mark the Middle Block
In the SCOB strategy, the middle candle is the most critical element of the structure and reflects the scob meaning in trading. To precisely define the entry zone, the high and low of this orderblock candle must be marked as the block boundaries.
This area should not be confused with the wicks of adjacent candles.
Any multi tick error in this marking leads to early or late entries and increases trade risk.
When price returns to this candle order block, entries should be executed from the lower half of the block for buy positions or the upper half of the block for sell positions, in order to maximize the risk to reward ratio.
Relationship Between SCOB, Fair Value Gap (FVG), and Breaker Block
SCOB usually forms in proximity to high value areas such as Fair Value Gap, HTF order blocks, or Breaker zones. This proximity increases the validity of the setup, because the institutional nature of price movement is reinforced when multiple related POIs overlap.
Combining SCOB with FVG is one of the most powerful reversal structures in the ICT style, as both liquidity collection and imbalance mitigation occur at a single point, often interpreted as single candle mitigation within the scob meaning framework.
The concept of SCOB is explained in video format on the TRADiNG hub YouTube channel:
Comparison Between SCOB and the Classic Order Block
A classic order block is usually a multi candle zone that reflects aggregated price behavior; however, SCOB represents a more compressed and point focused version of the same concept.
In SCOB, the emphasis is placed on the middle candle and the way liquidity behaves around this candle order structure.
Comparison table of SCOB and Classic Order Block:
Feature | SCOB (Single Candle Order Block) | Classic Order Block |
Formation structure | Based on one middle candle identified within a three candle sequence | Consists of multiple aggregated candles forming a broader zone |
Analytical focus | Liquidity behavior in the middle candle and the executed sweep | Overall price behavior across a multi candle zone |
Entry zone size | Smaller, more precise, suitable for low risk entries | Larger, with a wider entry range |
Stop loss (SL) | Very precise and close to the middle block | SL is usually placed further away |
Risk to reward (RR) | Higher RR due to the compact zone size | Moderate RR due to the wider OB |
Number of retests by the market | Fewer and dependent on a precise POI | More frequent and tested in various scenarios |
Sensitivity to zone selection | Very high and requires strong precision | Lower sensitivity to exact POI selection |
Position in ICT style | A compressed and point focused model for fast entries | A classic and broader structure for mid term analysis |
Best Time Frames for Using SCOB
SCOB can be applied across all time frames, but its accuracy increases significantly on higher time frames. On M1 to M5 time frames, the margin of error rises due to market noise and the increased presence of fake sweeps.
The most effective time frames for observing valid liquidity behavior are M15, H1, and H4, where market structure is clearer and smart money activity is more traceable.
Professional traders typically identify SCOB on higher time frames and then execute entries on lower time frames with MSS confirmation, using the order block candle as the execution reference.
How to Trade Using the SCOB Strategy?
The SCOB strategy within the ICT trading style is built on identifying intentional price behavior through a key candle, a candle that appears in a structurally important zone with high liquidity and signals smart money involvement.
This approach focuses on price reaction to a compact and precise block formed after liquidity collection, which defines the scob meaning and makes it a suitable tool for identifying low risk entries in reversal scenarios based on candle order logic.
Executing a Sell Trade (SELL)
To execute a sell trade using the SCOB strategy, first identify an order block in an area with a high probability of price decline.
After locating and defining its relevant zone, wait for price to return to the target area. Once price enters this zone, initiate the sell trade and place the stop loss above the zone.
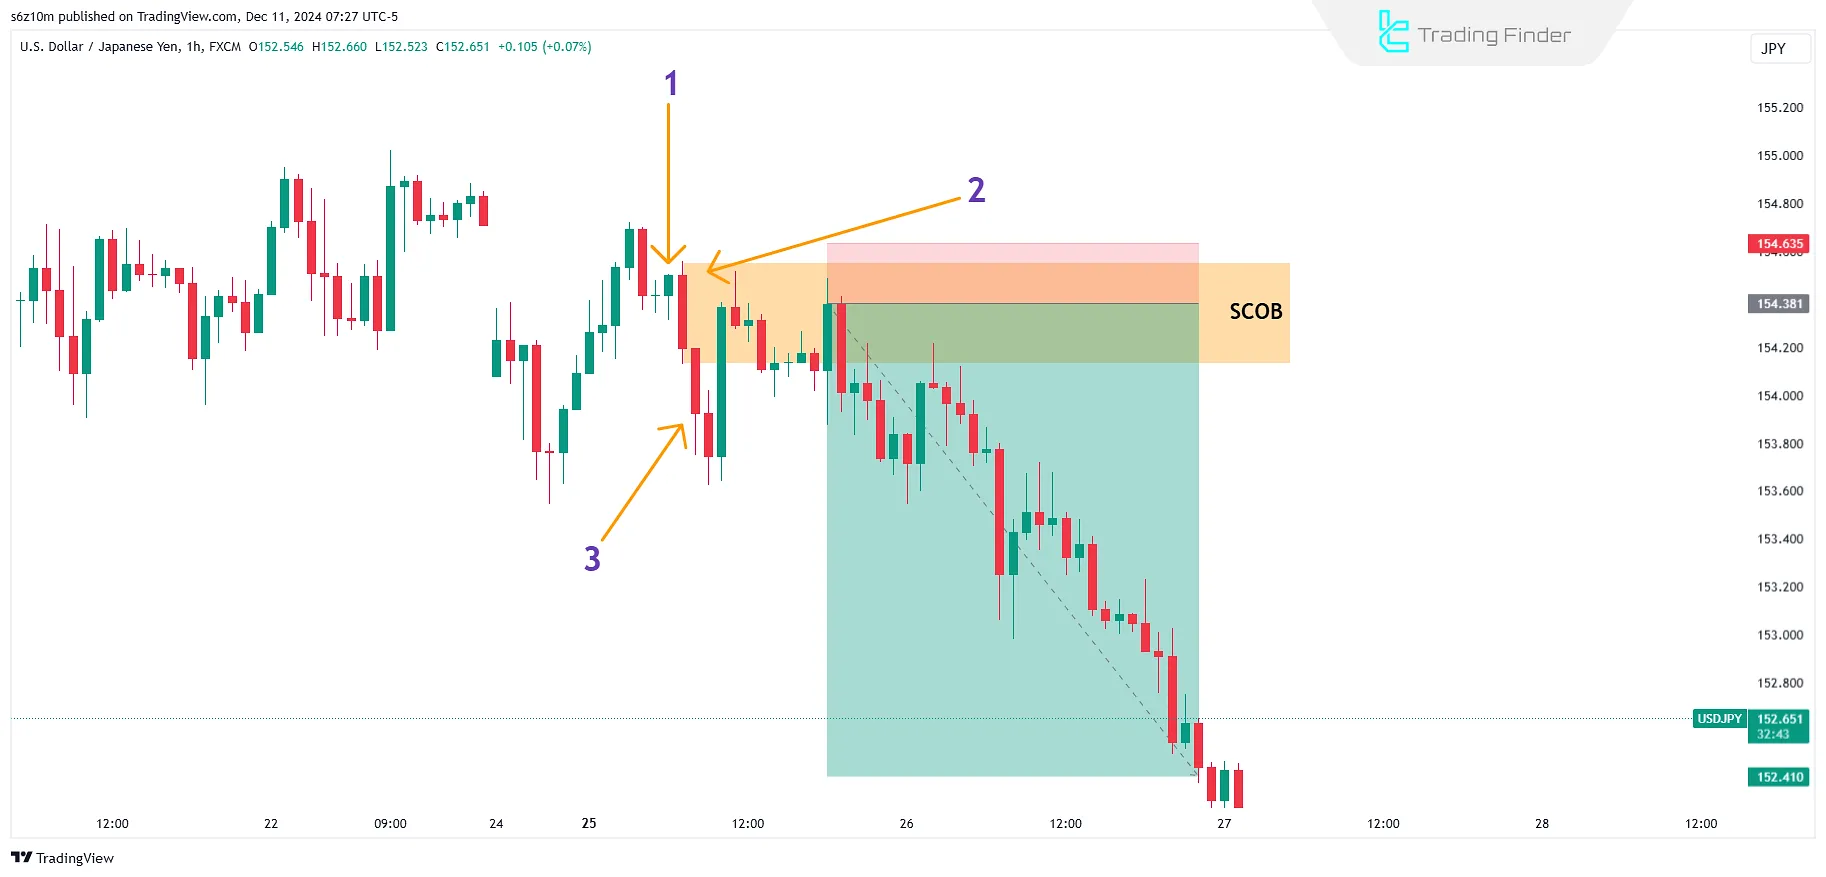
Real Example of a Sell Trade Using the SCOB Strategy
In this chart, after a short upward move, the market forms its reversal structure through the three step SCOB formation, which serves as an order block candle pattern.
The second candle breaks above the high of the first candle, sweeps the liquidity above the structure, and then closes at a lower level. The close of the third candle below the low of the second candle provides final confirmation of seller strength and a shift in market bias.
After the pattern is completed, price revisits the middle block of the SCOB and shows a strong bearish reaction at that level. This retest acts as a clear order block candle example, creating an optimal sell entry point.
The continuation of price movement and the subsequent strong decline indicate that smart money pending orders were activated in this zone, clearly defining the dominant market direction.
Executing a Buy Trade (BUY)
To execute a buy trade using the SCOB strategy, first identify an area with a high probability of price appreciation. After locating and defining the relevant zone, wait for price to return to the target area. Once price enters this zone, a buy trade can be executed, and the stop loss should be placed below the zone.
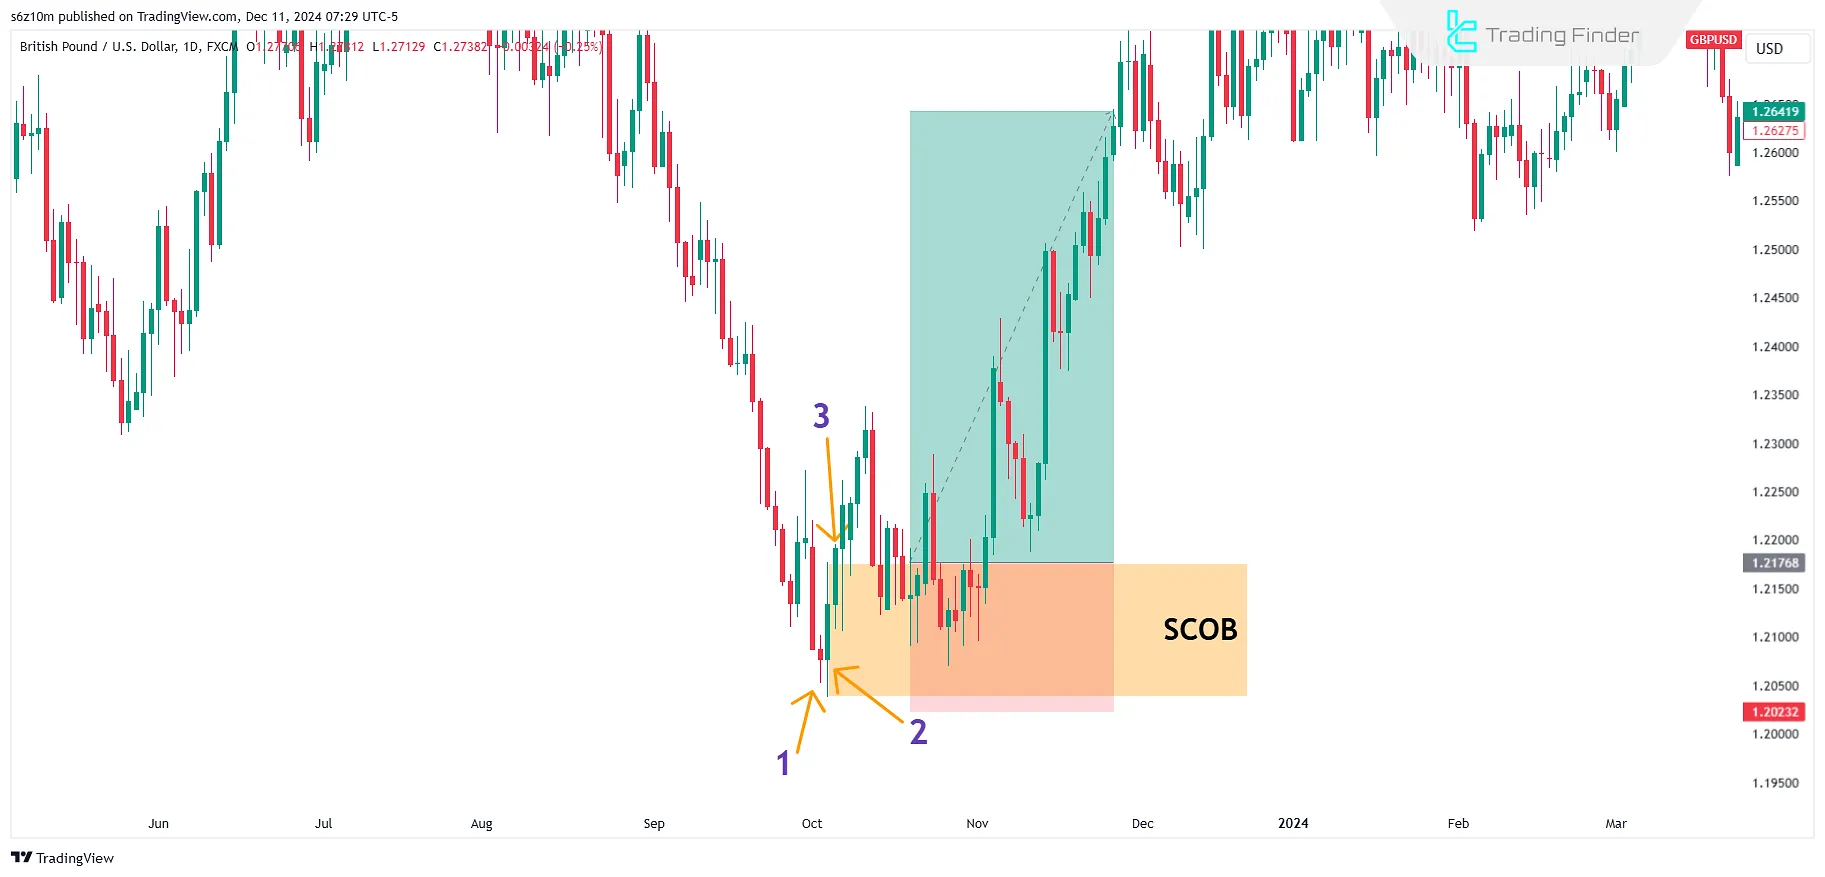
Real Example of a Buy Trade Using the SCOB Strategy
In this chart, the three step SCOB pattern forms a valid reversal structure. The second candle breaks below the low of the first candle, sweeps the downside liquidity, and closes higher, signaling the entry of institutional orders. The third candle then closes above the high of the second candle, confirming the shift in market bias.
After the structure is completed, price returns to the middle block zone and shows a strong bullish reaction at that level. Entering on this retest creates a low risk buying opportunity, and the subsequent upward move confirms that smart money pending orders have been activated in this area.
Volume Behavior During SCOB Formation
Studying trading volume during SCOB formation can increase the validity of the setup. Typically, during the second candle (the Sweep candle), a sudden increase in volume occurs, as stop loss exits and institutional order entries happen simultaneously.
If a Sweep forms without a volume increase, the probability of a fake move is high. In contrast, the third candle should show volume aligned with the reversal direction to confirm that smart money has genuinely entered the market.
Common Trader Mistakes in SCOB
A misunderstanding of the SCOB concept is one of the main causes of trader errors. The most common mistakes include the following:
- Entering trades without checking the trend direction on higher time frames;
- Using SCOB in ranging markets that lack targeted liquidity;
- Entering on the first touch of the zone without additional confirmations such as MSS;
- Failing to identify a valid Sweep and confusing a normal correction with liquidity collection;
- Setting the stop loss based on a fixed distance instead of the liquidity logic of the middle candle.
Additional Trade Management Tips
After entering at the SCOB zone, trade management is best handled based on liquidity behavior. If price forms a new high or low in the direction of the trade after entry, the stop loss can be moved behind that level.
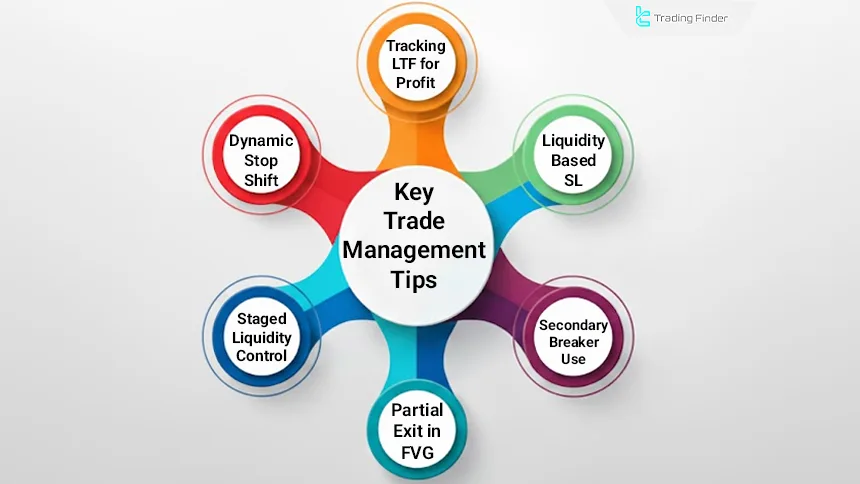
Key Trade Management Notes:
- Dynamic stop loss adjustment: Moving the stop loss after the first new high or low forms in the trade direction;
- Staged liquidity management: Adjusting position behavior based on price reactions to liquidity zones;
- Partial exits at Fair Value Gaps: Taking partial profits when price reaches newly formed FVGs;
- Use of secondary Breaker: Reentering or increasing position size after a strong zone break and its conversion into a Breaker;
- Liquidity based stop loss: Placing SL behind new liquidity levels instead of using a fixed distance;
- Monitoring LTF for profit stabilization: Observing price behavior on lower time frames to prevent reversals and protect floating profit.
When is SCOB Invalid?
SCOB loses its validity if any of the following conditions occur:
- The second candle fails to break the high or low of the first candle, resulting in an incomplete Sweep;
- The third candle does not confirm the trend and closes within the range of the second candle;
- The higher time frame market structure contradicts the setup direction;
- Price reverses before touching the SCOB zone with accompanying liquidity divergence;
- Trading volume shows a significant decrease during the formation of the second candle.
Major Levels Order Block Indicator
The Order Block indicator is one of the prominent tools within the ICT and Smart Money styles, identifying key liquidity zones on the chart. These zones, known as OBs, are areas where price typically reacts and changes direction based on supply or demand pressure.
In addition to fast order block identification, this indicator also displays major levels such as Major High Level and Major Low Level using colored lines, and provides visualization of the 50 percent order block zone with a dashed line.
In bullish trends, the tool identifies Demand OB zones as valid support levels and warns traders of potential directional changes by displaying breaks such as BOS and structures like ChoCH or MSS.
In bearish trends, Bearish OB supply blocks act as resistance, and price approaching these zones can reinforce further downside movement.
The indicator includes a comprehensive settings panel, including Order Block Refine for automatic block structure optimization, as well as selective display of key zones within the Major Levels section.
This flexibility allows analysts to adjust OB visualization according to their trading style. Overall, the Order Block indicator is a composite tool based on liquidity mechanics and market structure, integrating concepts such as BOS, MSS, and major levels to deliver reliable entry points aligned with real market flow.
Furthermore, order block effectiveness reaches its maximum when used alongside liquidity behavior, market structure, and valid break points.
Order blocks alone are not raw trading signals; they gain analytical value only when evaluated within a cohesive framework that includes the dominant trend, major zones, structural breaks, and price interaction with previous levels.
This multi layer approach enables traders to select more precise entry zones and assess future market moves based on order flow and smart money decision making.
- Order Block indicator for MetaTrader 5
- Order Block indicator for MetaTrader 4
- Order Block indicator for TradingView
Conclusion
The SCOB strategy examines the behavior of a single candlestick in key market areas to identify suitable trade entry points. This strategy emphasizes Order Blocks (OB) formed by a key candle, suggesting potential trading opportunities in the direction of price reversal.
The effectiveness of this approach increases when SCOB is analyzed within the context of market structure and liquidity flow, rather than as an isolated candlestick pattern.
Price reaction to the middle block becomes meaningful only when it forms near valid POIs, aligns with the higher time frame direction, and occurs after liquidity has been collected; otherwise, a retest of the zone may represent merely a short term fluctuation rather than the beginning of a sustainable reversal move.


