


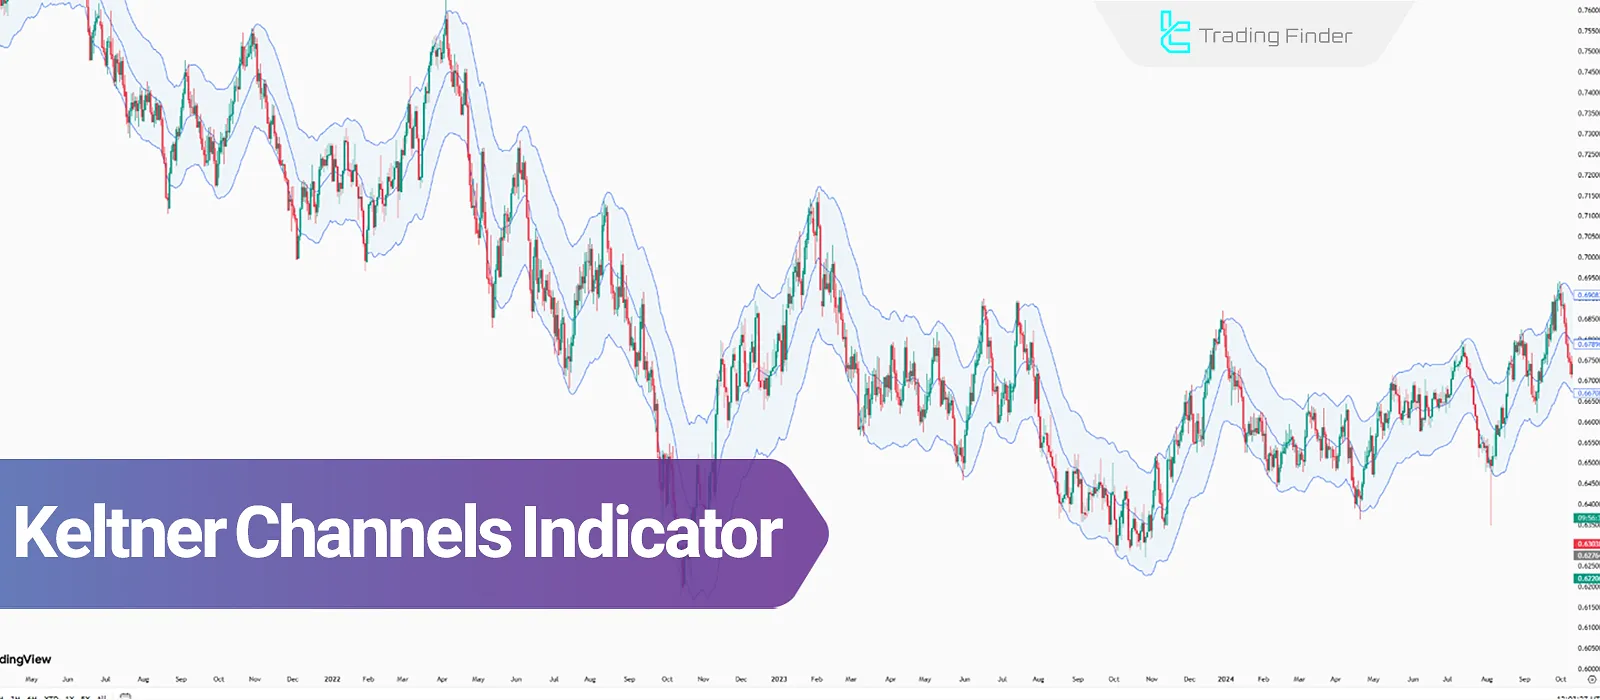
The Keltner Channel Indicator (KC) is constructed using the Exponential Moving Average (EMA) as the middle line, with the channel bands positioned based on the Average True Range (ATR).
This structure allows traders to observe suitable price movement ranges and analyze trend strength changes through band touches or keltner channel breakout signals.
The three main parts of this indicator; Basis Line, Upper Band, and Lower Band; not only show the overall market direction but also provide the ability to evaluate structural breakouts and volatility levels.
For this reason, in analyses that require volatility assessment, trend examination, and dynamic support and resistance levels, the Keltner Channel strategy has a special place.
Introduction to the Keltner Channels Indicator
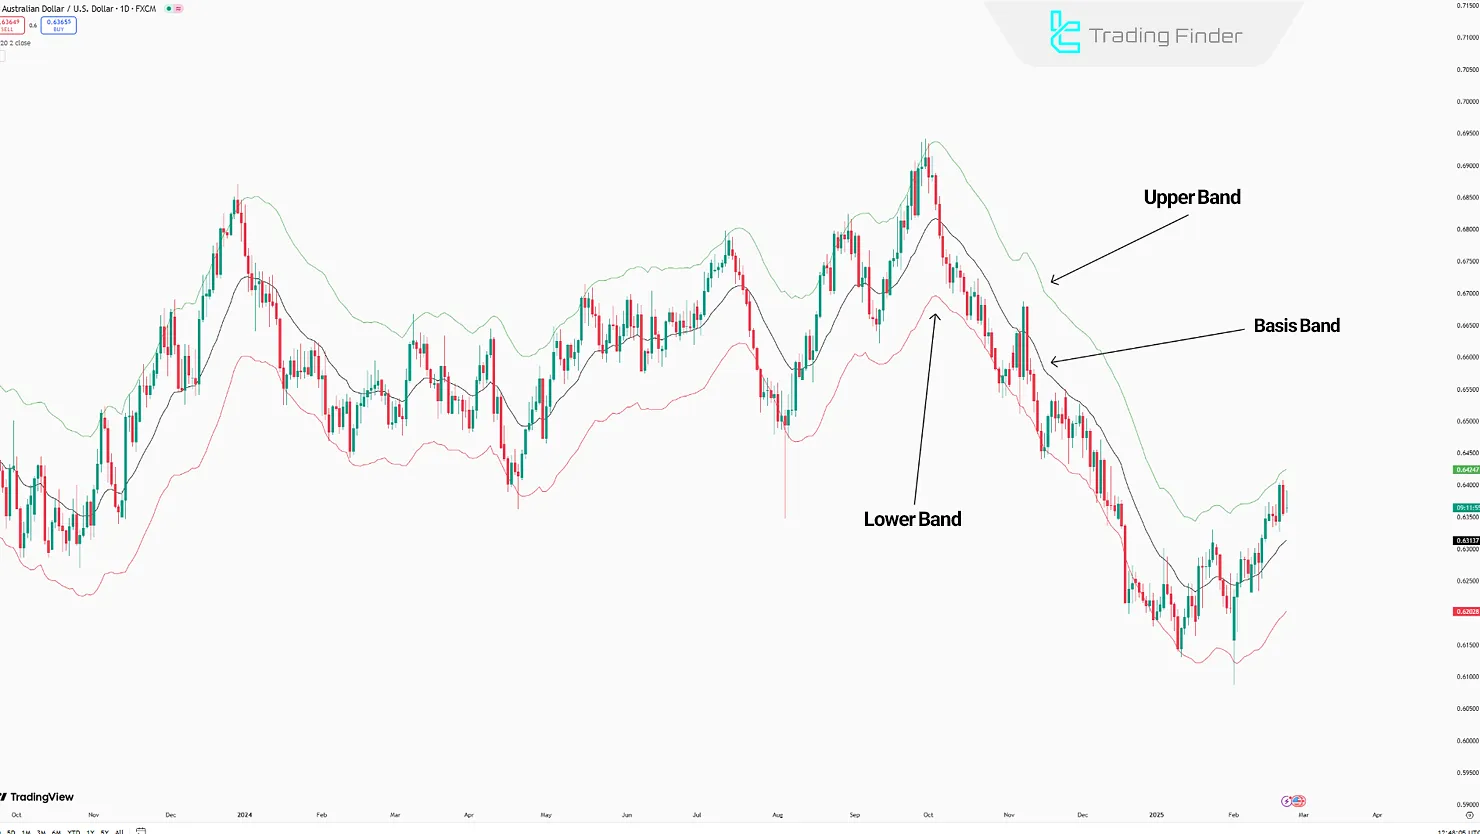
The Keltner channels technical indicator combines the Exponential Moving Average (EMA) and the Average True Range (ATR) to create a channels consisting of three parts around the price.
This channels displays the movements of the chart within a specific framework. Components of the Keltner Channels Indicator:
- Middle Line (Basis Line): This line is the core of the indicator and shows the overall price trend based on the EMA 20;
- Upper Line (Upper Band): This line acts as a dynamic resistance level; if the price crosses this line, a bullish signal is generated;
- Lower Line (Lower Band): This line acts as a dynamic support level; a bearish signal is generated if the price crosses this line.
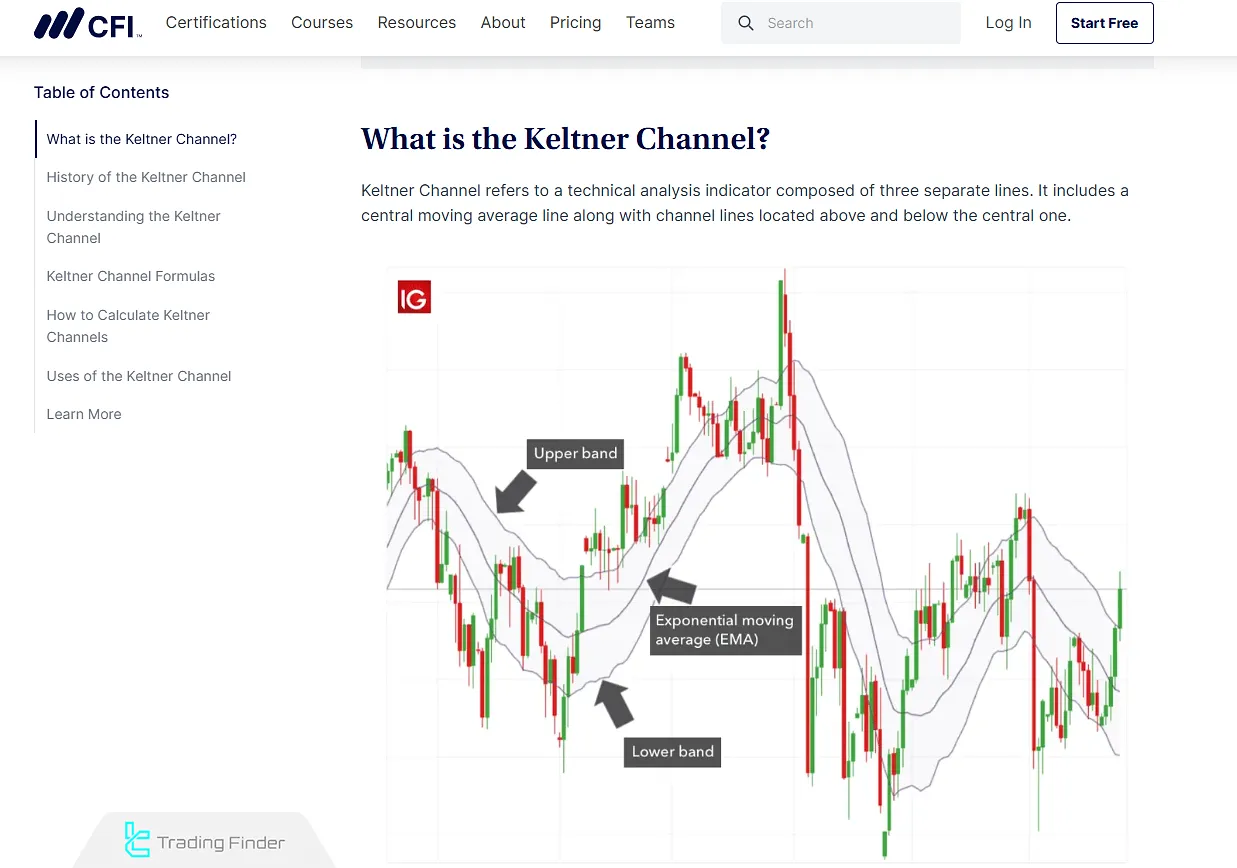
History and Development of the Keltner Channel Indicator
According to information provided by CIF, the Keltner Channel Tutorial dates back to the 1960s when it was first introduced by Chester W. Keltner.
The original version was based on the Simple Moving Average (SMA) and price range, primarily used to follow dominant market trends.
In the 1980s, Linda Bradford Raschke revised this tool by replacing the SMA with the EMA and integrating the ATR, which shaped the modern Keltner Channels chart.
This update enhanced the precision of volatility measurement and allowed traders to identify both ranging and trending conditions with greater clarity.
The history of this indicator highlights how its evolution responded to the market’s need for deeper insight into price behavior and volatility.
Installing and Setting Up the Keltner Channel Indicator on Platforms
To use the Keltner Channel Indicator and strategies, simply activate it from the indicators section of trading platforms such as MetaTrader 4 , MetaTrader 5, or Trading View.
Once added to the chart, the default Keltner Channel settings; including EMA period and ATR multiplier; are displayed.
Adding the Keltner Channel in MetaTrader 4
To install and activate the Keltner Channel indicator in MetaTrader 4, you need to follow a specific path, which is outlined step by step below:
- Download the indicator: Obtain the file with .ex4 or .mq4 extension from a trusted source;
- Open the Data Folder: In MetaTrader 4, click File; Open Data Folder;
- Locate the Indicators folder: Navigate to MQL4, Indicators;
- Copy the file: Place the indicator file inside the folder;
- Restart MetaTrader: Reopen the platform so the system detects it;
- Find in Navigator: Under Indicators, the name should appear;
- Apply to chart: Double-click or drag it onto a chart;
- Adjust settings: Customize EMA or ATR values, enable Allow DLL import, and click OK.
Adding the Keltner Channel in MetaTrader 5
To add the Keltner Channel indicator in MetaTrader 5, the process is more straightforward and can be done directly from the Indicators section:
- Open a chart for the asset
- Go to Indicators: Click Insert, Indicators
- Search “Keltner Channel (KC)”
- Select and plot on the chart
- Modify settings (optional): Adjust EMA and ATR values
- Click OK to confirm
Adding the Keltner Channel in TradingView
On the Trading View platform, the Keltner Channel indicator can be easily searched and added through the Indicators section.
Steps to add the Keltner Channel indicator in TradingView:
- Open a chart of your chosen asset
- Click Indicators (fx) on the top toolbar
- Search “Keltner Channel”
- Select and add to chart
- Open settings: Edit EMA, ATR multiplier, or colors of keltner channel bands
How to Calculate the Keltner Channel Indicator (KC)
The Keltner Channel (KC) indicator is calculated using the values of the Exponential Moving Average (EMA) and the Average True Range (ATR).
The Exponential Moving Average (EMA) usually varies between a 15- to 40-day period (depending on the trading strategy).
The Upper Band of the channel is placed at twice the Average True Range (ATR) above the EMA; the Lower Band is set at twice the ATR below the EMA.
Calculating the Exponential Moving Average (EMA)
To calculate the Exponential Moving Average, the time period must first be defined, and then for each average, the data is computed on the price chart.
At the very first point on the chart, the EMA equals the initial price of the chart; the subsequent EMA values are calculated using the following formula:
Calculating the Average True Range (ATR)
The calculation of this range is done by examining the changes between the highest and lowest prices within a defined period (for example, 10 days); this range is calculated for each point on the price chart.
Calculating the Keltner Channel Lines
The Keltner Channel lines are calculated using the data from the Exponential Moving Average (EMA) and the Average True Range (ATR):
Advantages and Disadvantages of the Keltner Channels
To optimally use the Keltner channels technical indicator, it is essential to understand its advantages and disadvantages. Advantages and Disadvantages of the Keltner Channels:
Disadvantages | Advantages |
Poor Performance in Range-Bound and Low-Volatility Markets | Combines Trend Information (EMA) and Volatility (ATR) for Accurate Signals |
Requires Proper Parameter Adjustment | More Stable than Bollinger Bands in Volatile Conditions |
Does Not Provide Clear Signals for Overbought or Oversold Conditions | Capable of Identifying Strong Trends and Entry/Exit Points |
Slow Reaction to Sudden Price Changes | Reduces Price Noise Compared to Similar Indicators |
Applications of the Keltner Channels
The Keltner Channels Indicator uses the Exponential Moving Average (EMA) and the Average True Range (ATR) to identify trends, breakout signals, and entry points.
On the Mind Math Money YouTube channel, a tutorial explains How to trade using the Keltner Channel (KC) in technical analysis.
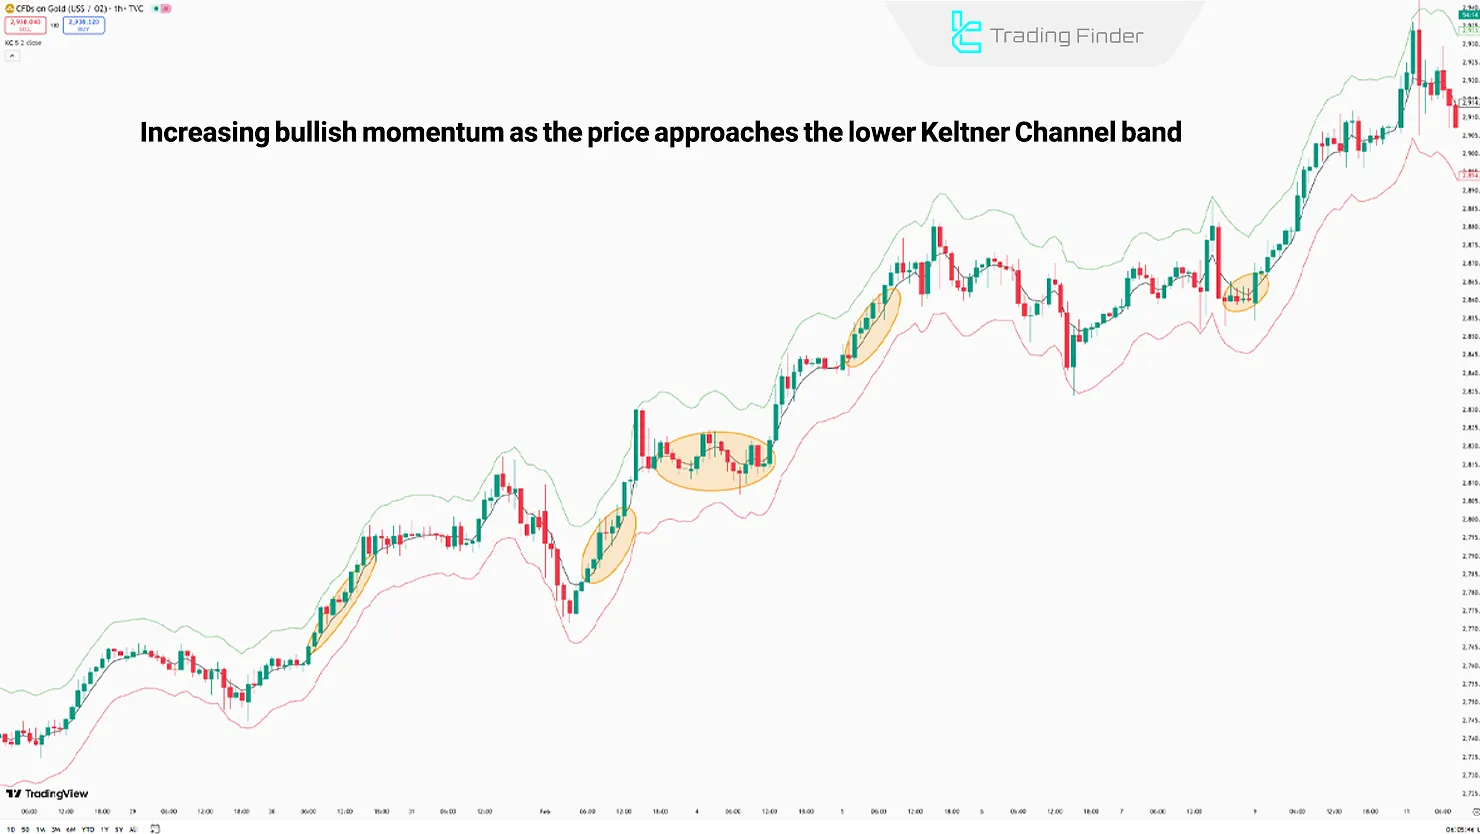
Using the Keltner Channels Technical Indicator to Identify Trends
One of the primary uses of the Keltner Channels is to identify the current price trend; this is determined by the price's interaction with the lines and movement within the channels.
- Uptrend: When the price moves between the Basis Band and the Upper Band, the middle line acts as a dynamic support level in an uptrend;
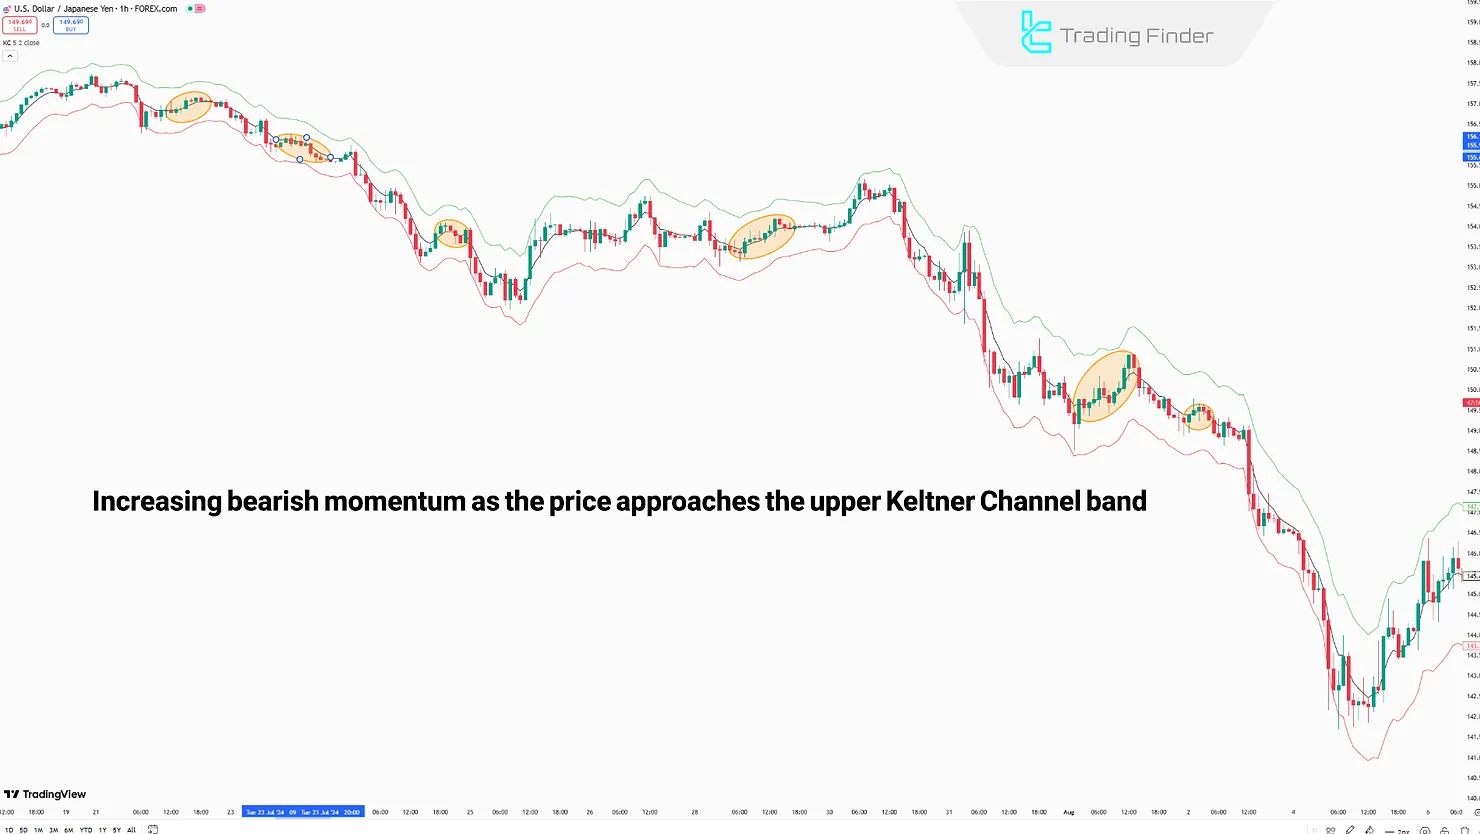
- Downtrend: When the price moves between the Basis Band and the Lower Band, the middle line acts as a dynamic resistance in a downtrend;
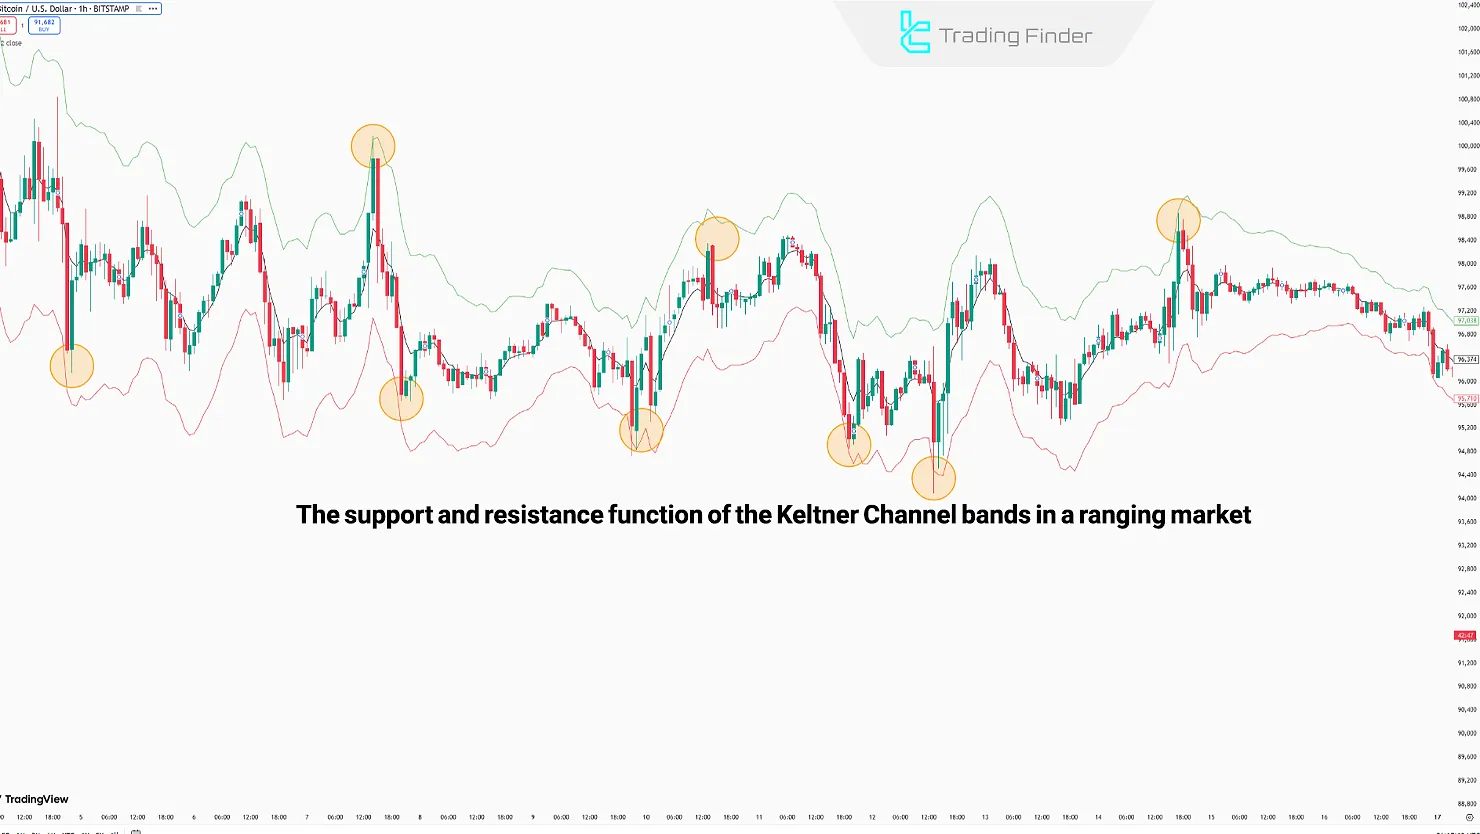
- Range-bound Market: When the price fluctuates within the range, the middle line is often broken, while the upper and lower lines act as resistance and support.
- Keltner Channels Indicator for MT4
- Keltner Channels Indicator for MT5
- Keltner Channel for TradingView
Note: To make easy use of the Keltner Channels, you can use the TradingFinder indicator set.
Receiving Breakout Signals Using the Keltner Channels Technical Indicator
Depending on the market's bullish or bearish structure, the method of identifying breakouts using the Keltner Channel changes.
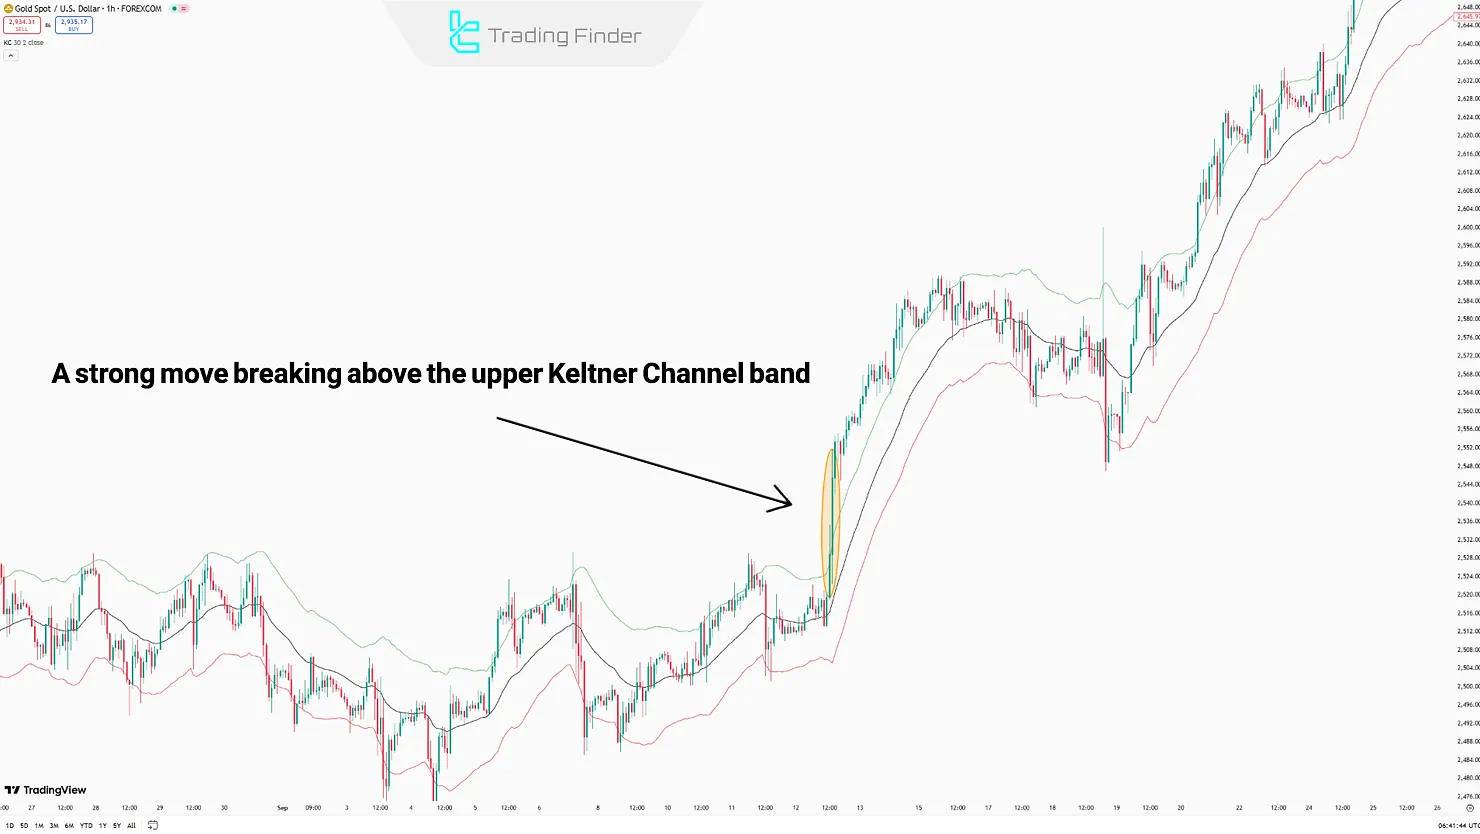
- Bullish Breakout: When the Upper Band is broken with increased volume and strong candles, a bullish breakout signal is generated;
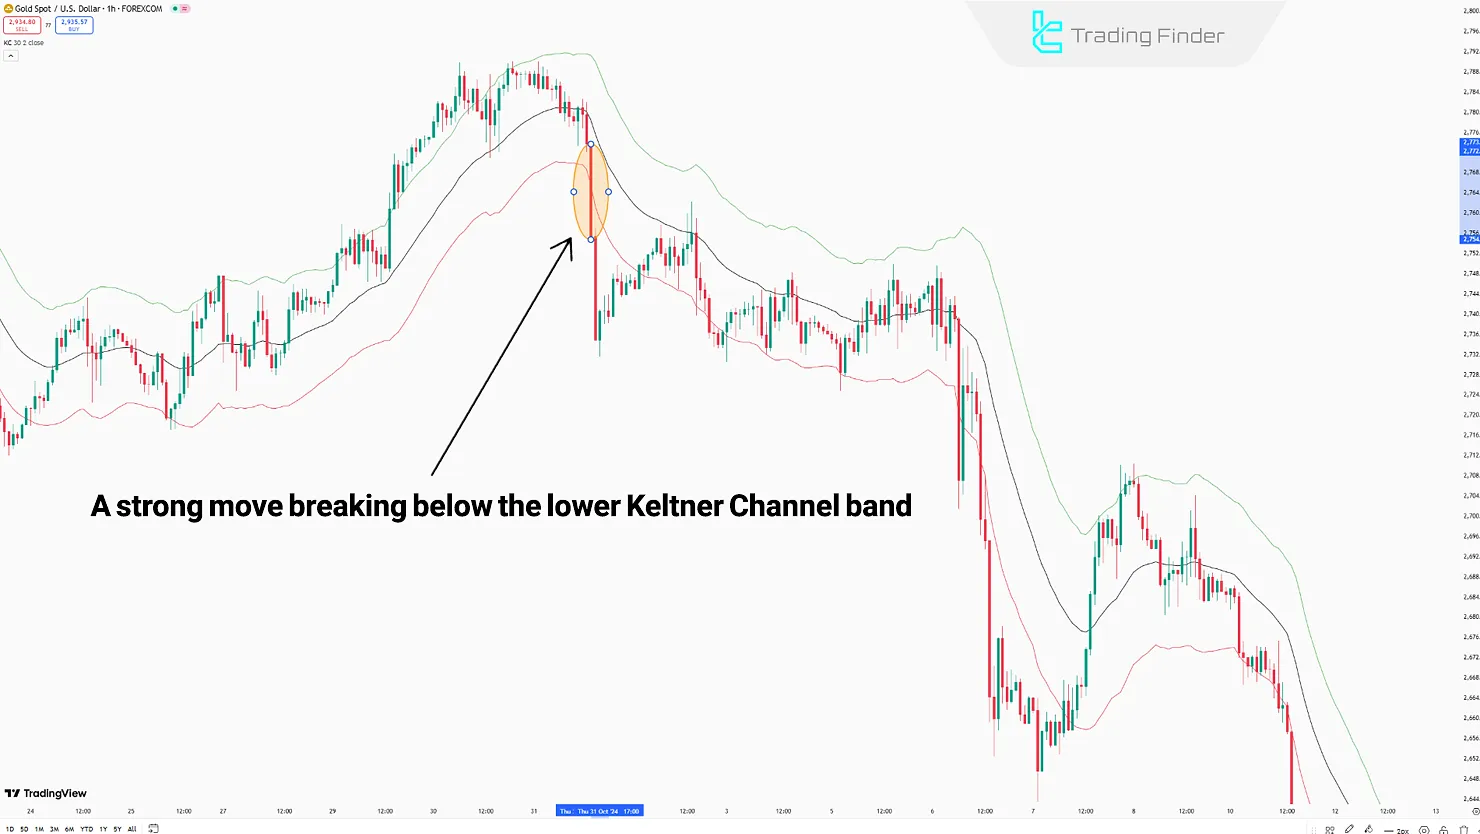
- Bearish Breakout: When the Lower Band is broken with strong candles and increased market volume, a bearish breakout signal is generated.
Applications of the Keltner Channel in Different Markets
The Keltner Channel forex, stock, and crypto applications vary because each market has unique volatility and price action.
The best Keltner Channel strategy depend on adapting the parameters to market conditions.
Market | Functional Features of the Keltner Channel | Suggested Settings |
Forex | Identifying valid breakout confirmation and short-term (scalping) trades | Shorter EMA (10–20), standard ATR |
Stocks | Combine with trading volume to detect overbought/oversold | Medium-term EMA (20–50), balanced ATR |
Cryptocurrency | Adjust to high volatility and sharp moves | Flexible EMA, ATR with larger multiplier (2.5 or 3) |
Trading with the Keltner Channel
The Keltner channels technical indicator uses the concepts of Exponential Moving Average (EMA) and Average True Range (ATR) to identify entry points, exit points, and stop-loss levels.
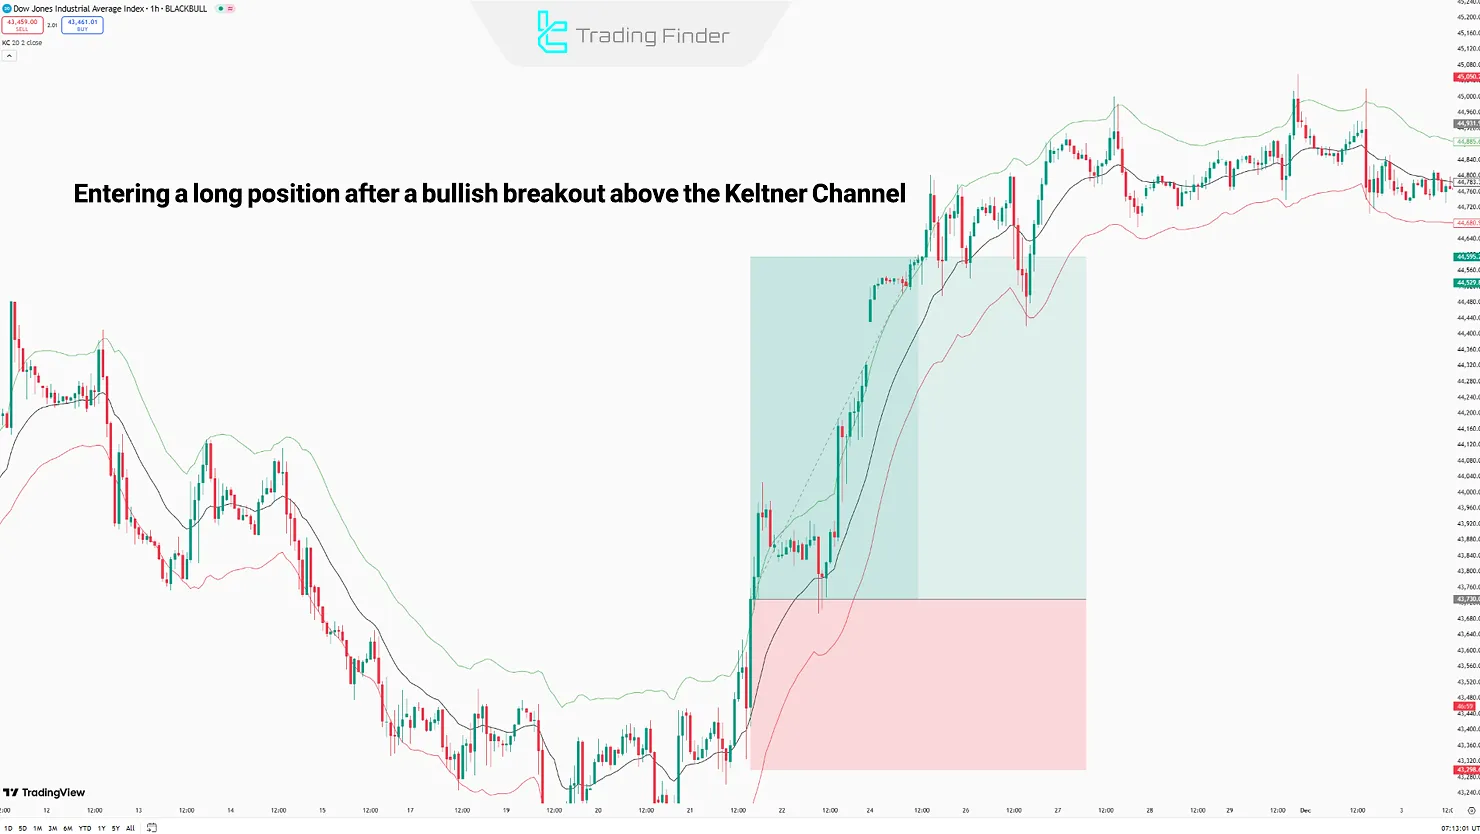
Example of Long Position Trading Using the Keltner Channels Technical Indicator
- Entry: Happens after the Basis Band or Upper Band is broken by a strong candle and increased market volume;
- Stop Loss: The stop-loss order is located below the Basis Band or Lower Band.
Exit: A break below the middle line is the first exit signal; approaching and testing the lower line is the next.
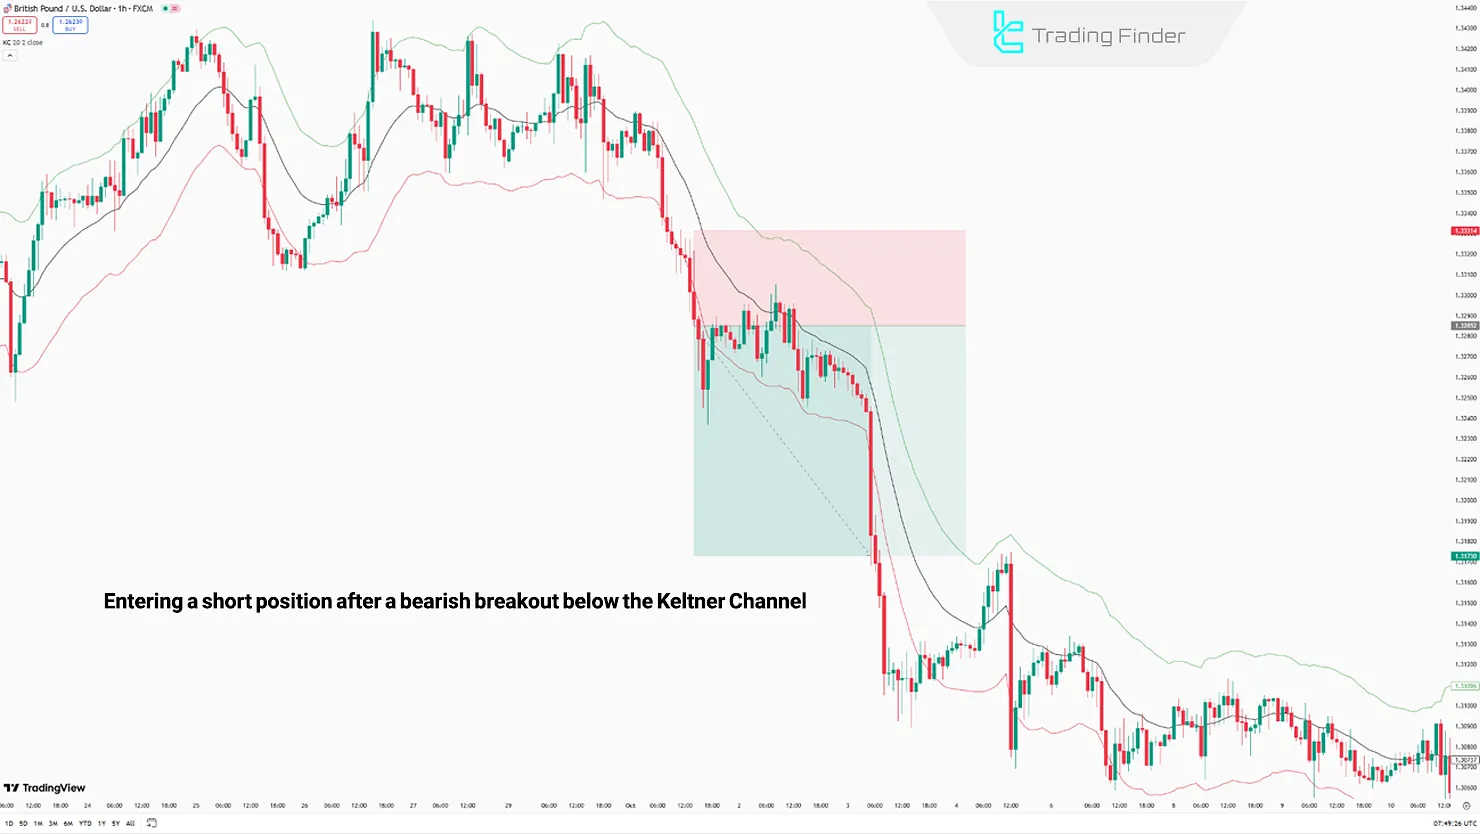
Example of Short Position Trading Using the Keltner Channels Technical Indicator
- Entry: Occurs after the Basis Band or Lower Band is broken by a strong candle and increased market volume;
- Stop Loss: The stop-loss order is placed above the Basis Band or Upper Band.
Exit: A break above the middle line is the first exit signal; approaching and testing the upper line is the next.
Differences Between bollinger bands andkeltner channel strategy
The Keltner Channels has many similarities with the Bollinger Bands; however, they differ in calculation methods, signaling, and trading applications. Comparison of the Keltner Channel vs Bollinger Bands:
Parameter | Keltner Channels | Bollinger Bands |
Moving Average | Exponential Moving Average (EMA) | Simple Moving Average (SMA) |
Volatility Measure | Average True Range (ATR) | Standard Deviation |
Sensitivity to Market Volatility | Moderate | Highly Sensitive |
Performance in Range-bound Markets | Weak | Good |
Primary Application | Identifying trends and breakout points | Identifying volatility and overbought/oversold levels |
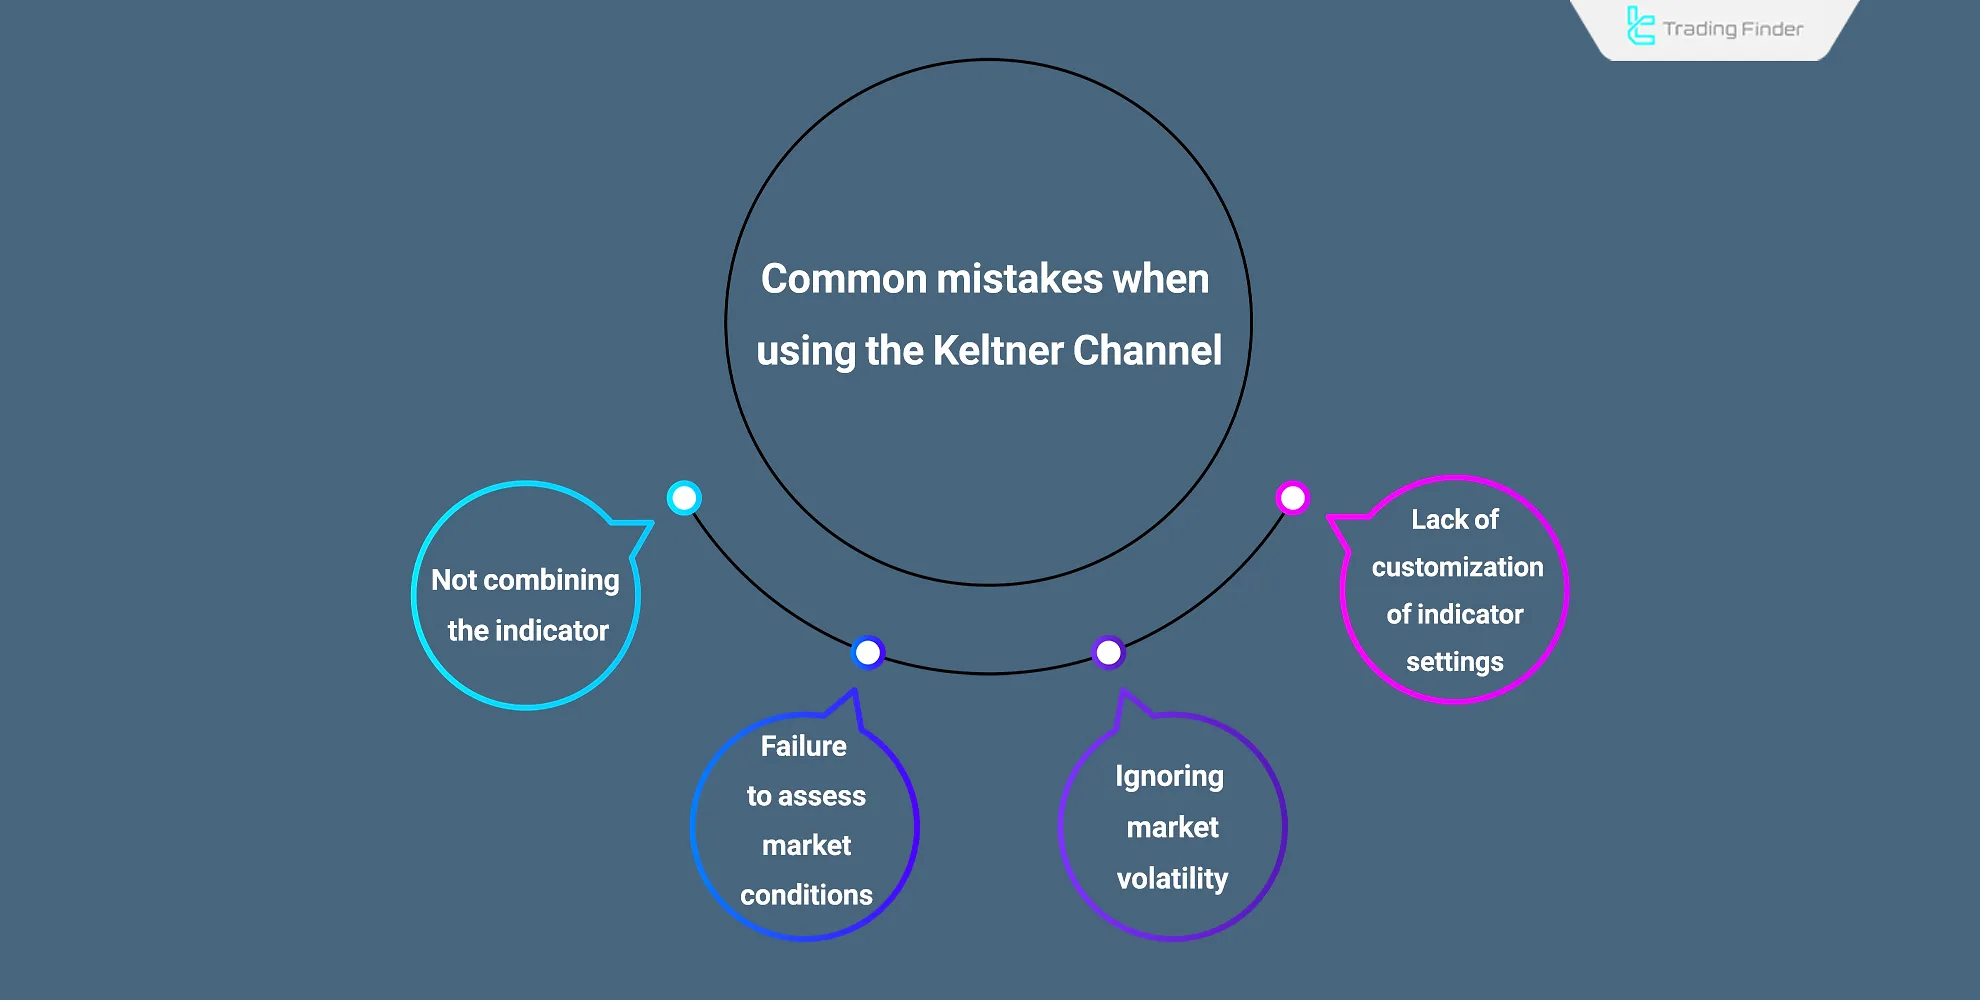
Common Mistakes When Using the Keltner Channel
Even though Keltner Channel Wedges and bands are accurate in measuring volatility, mistakes reduce efficiency:
- Not combining indicators: Avoid relying only on KC; combine with RSI or MACD;
- Fixed parameters: Using EMA 20 and ATR 14 everywhere instead of adjusting;
- Ignoring volatility: Leads to false Keltner Channel breakout signals in calm markets;
- Overlooking conditions: Not personalizing settings per asset’s behavior.
Conclusion
The Keltner Channels is a flexible tool in various short-term and long-term trade strategies.
Although this indicator performs well in identifying strong trends and breakout points, it does not provide very accurate signals in range-bound and low-volatility market conditions; to filter out false signals, you can combine them with volume indicators or oscillators.


