


In technical analysis, moving averages are suitable tools for identifying trends, but on their own, they do not offer sufficient accuracy when facing short-term market fluctuations.
The moving average envelope provides a more precise analytical framework by adding two bands above and below a moving average.
These bands are plotted at a fixed distance (based on a specific percentage of the average) and, in addition to confirming the trend direction, they also make it possible to identify overbought and oversold zones.
The moving average envelope is a practical tool in both trending and non-trending conditions, helping define entry and exit points with a lower probability of error.
What is a Moving Average Envelope?
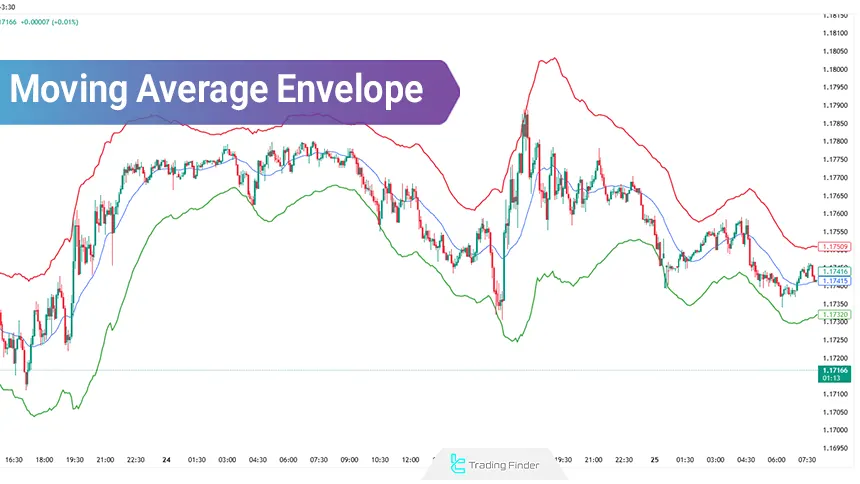
A moving average envelope is a technical analysis tool that consists of a central moving average and two other lines one above the average and another below it.
These two lines maintain a fixed percentage distance from the moving average value and move in parallel with it.
The reason this tool is called an “envelope” is that these two lines surround the moving average like a cover. The goal of using a moving average envelope is to increase accuracy in trend analysis and improve the identification of overbought and oversold zones.
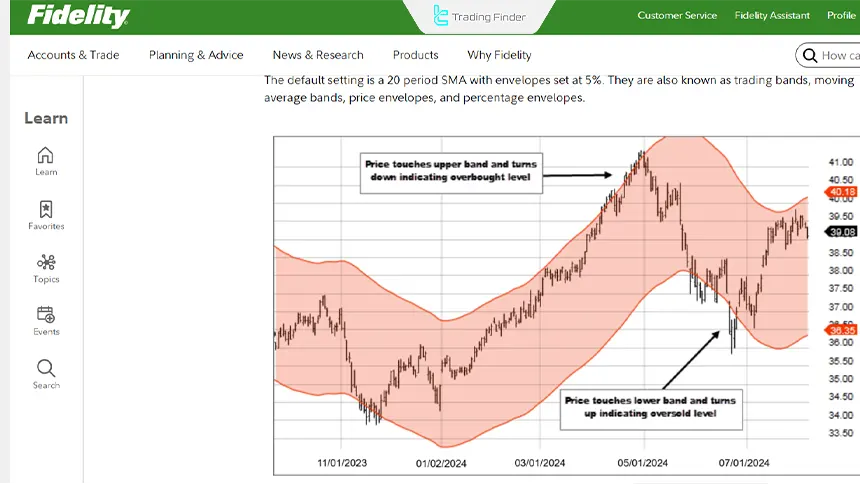
This tool allows the analyst, alongside examining the overall market direction, to also obtain suitable signals for entering or exiting trades based on price behavior relative to the envelope lines. Training on how to use moving average envelopes from the Fidelity website:
Advantages and Disadvantages of Moving Average Envelopes
As one of the classic technical analysis tools, the moving average envelope provides multiple analytical capabilities for evaluating trends and price behavior.
However, the performance of this indicator depends on market conditions and how its parameters are set, and it always comes with specific advantages and limitations. Table of moving average envelope advantages and disadvantages:
Advantages | Disadvantages |
Simplicity of structure and ease of understanding | Low flexibility due to a fixed percentage |
Identifying trend direction and strength | Increased false signals in ranging markets |
Detecting overbought and oversold zones | Insufficient for independent decision-making |
Applicable in trending and neutral markets | Slow reaction to sudden price changes |
Adjustable based on timeframe | High sensitivity to envelope percentage selection |
Acts as dynamic support and resistance | Needs to be combined with complementary indicators |
Helps determine entry and exit points | Possibility of false breakouts in high volatility |
Calculating the Moving Average Envelope
To build a moving average envelope, you must first specify the type of moving average. For this, two types of moving averages are typically used:
- Moving Simple Average (SMA), which calculates the average price of previous periods with equal weighting;
- Exponential Moving Average (EMA), which assigns more weight to newer prices and reacts faster to price changes.
After choosing the type of average, the intended time period must be specified; for example, a 10-day or 20-day average depending on the market type and Moving Average Envelopes strategy.
This number determines how many candles or price data points are included in calculating the average. Next, the envelope percentage distance from the average line must be determined.
This percentage specifies how far the upper and lower bands should be from the average. For instance, choosing 1% means the upper band is 1% above and the lower band is 1% below the average value.
Moving Average Envelope Calculation Formula
The moving average envelope formula is defined based on the central average and a fixed percentage for the upper and lower bands. Moving average envelope calculation formula:
- Upper Envelope:
- Lower Envelope:
Where MA is the selected moving average and %n is the envelope distance percentage.
For example, on the EUR/USD chart using a 10-day SMA and a 1% distance, three lines are plotted:
- 10-day moving average line (central)
- Upper band 1% above the average
- Lower band 1% below the average
The final result is three parallel lines that create a fixed envelope around price and move dynamically along with the average. This structure is considered the foundation for analysis with the moving average envelope.
How to Use the Moving Average Envelope to Confirm Trend Direction
One of the main applications of the moving average envelope is identifying and confirming the direction of the price trend in the market.
Since the structure of this tool is based on a moving average, the direction of the bands directly follows the direction of the central average. Therefore, examining the slope of the envelope can provide a clear picture of the trend status:
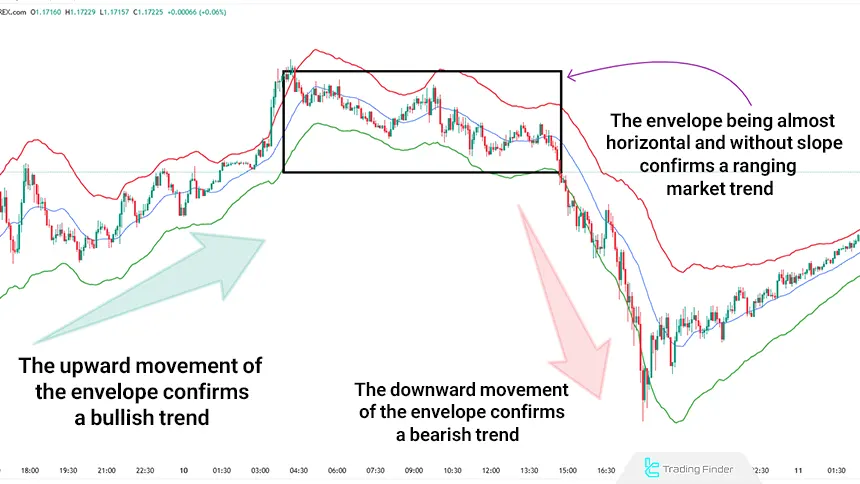
- When the envelope moves upward, the market is in an uptrend;
- When the envelope slopes downward, the market is in a downtrend;
- When the envelope is almost flat and without a clear slope, the market is in a (neutral Range or trendless) condition.
In these conditions, examining how price interacts with the upper and lower bands provides suitable entry or exit signals:
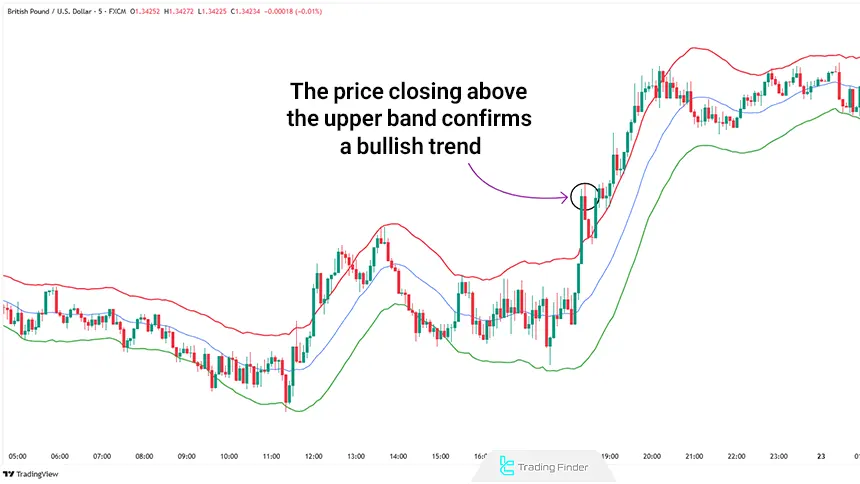
- Buy signal: Issued when price closes above the upper envelope band. This typically indicates strong bullish trend momentum and the start of a new leg;
- Sell signal: Issued when price closes below the lower envelope band. This condition indicates selling pressure and the likelihood of a continued bearish trend.
Tutorial video on using the moving average envelopes indicator:
Moving Average Envelope Example for Confirming Trend Direction
On the GBP/USD chart, using a 20-day simple moving average and bands with a fixed distance, it can be observed that as price crosses the average line and closes above the upper band, the market trend shifts from bearish to bullish.
Using the envelope in this situation can serve as a confirmation tool for entering a trade in the new trend direction.
Using the Moving Average Envelope to Identify Overbought and Oversold Levels
Another important use of the moving average envelope is identifying overbought and oversold zones in sideways or low-volatility markets.
These conditions typically occur when price moves away from the equilibrium range but, instead of continuing the trend, returns to the previous range.
For analysis to be valid in such conditions, it is necessary that the moving average has no clear slope and is almost flat. A flat average line means the market is ranging or neutral, and price movements fluctuate more between specific highs and lows.
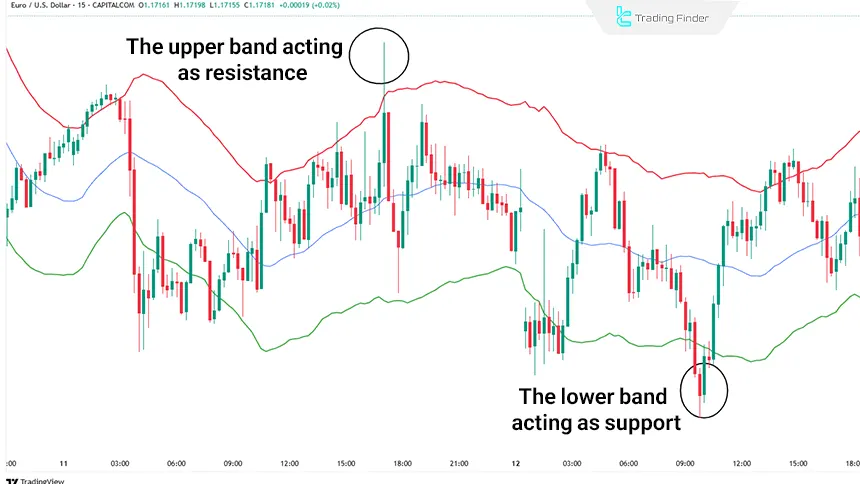
In this case, the upper and lower envelope bands act like dynamic resistance and support levels:
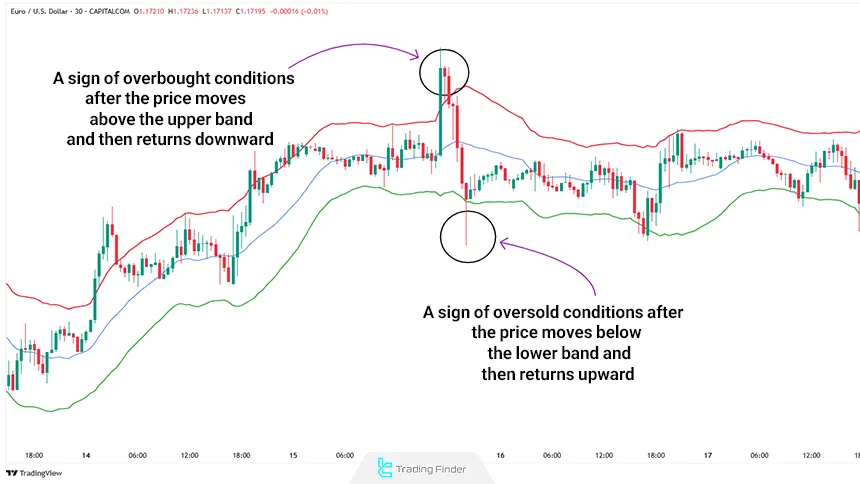
- When price breaks above the upper band and returns, it is a sign of overbought conditions;
- When price breaks below the lower band and returns inside the envelope, it can be considered oversold.
These behaviors can also form the basis for reversal signals:
- Buy signal: Occurs when price touches or breaks the lower band and then returns upward again;
- Sell signal: Forms when price reaches or breaks the upper band and then returns downward.
However, to improve analytical accuracy, combining this tool with classic support and resistance levels is recommended. In fact, if price is near one of the envelope lines and simultaneously reacts to a key technical level, the validity of the reversal signal increases.
Moving Average Envelope Example for Identifying Overbought and Oversold Levels
On the EUR/USD chart using a 30-day SMA and a flat-sloping envelope, it can be observed that the upper band consistently plays the role of resistance and, as price approaches it, price moves downward.
Conversely, the lower band also acts like a support level and prevents further price decline.
This pattern shows that the moving average envelope can effectively define the price fluctuation range in ranging markets and identify entry and exit points with a higher probability of success.
Moving Average Envelopes Indicator
The Envelopes Indicator is one of the practical tools in technical analysis, designed to identify dynamic support and resistance ranges, overbought and oversold zones, and evaluate changes in the price trend.
The structure of this indicator is based on a central moving average and two upper and lower bands that are drawn at a fixed distance and a specified percentage from the moving average.
This feature makes price behavior relative to the market’s equilibrium range more clearly observable. Tutorial video on using the Envelopes indicator:
The envelope lines play an important role in analyzing price fluctuations and can act as dynamic levels. When price approaches or breaks the upper or lower band, the likelihood of the market entering an exhaustion condition increases.
Price returning inside the envelope range after breaking the bands can be a warning of weakening in the prior move and an increased probability of a trend change or correction. Therefore, this indicator can be used both in trending markets and in neutral conditions.
One of the main advantages of the Envelopes indicator is its ability to identify suitable entry and exit areas based on price behavior relative to the bands.
In ranging markets, these bands can define the price oscillation framework and enable trading at the top and bottom of the range.
In trending markets as well, evaluating the slope of the moving average and how price reacts to the bands provides a good view of trend strength or weakness.
The settings of this indicator include selecting the moving average period, its calculation type, the applied price, and the band deviation value.
Correct selection of these parameters plays an important role in signal accuracy and must be adjusted according to market conditions and trading style.
Overall, the Envelopes indicator is considered a complementary tool for analyzing trends and price fluctuations, and using it alongside other analytical tools can increase trading decision-making accuracy. Download links for the Envelopes indicator:
Challenges and Limitations of Moving Average Envelopes
Despite its strong usefulness in analyzing price fluctuations, the moving average envelopes indicator in technical analysis faces specific technical limitations due to its calculation structure and market conditions. Types of challenges and limitations of moving average envelopes:
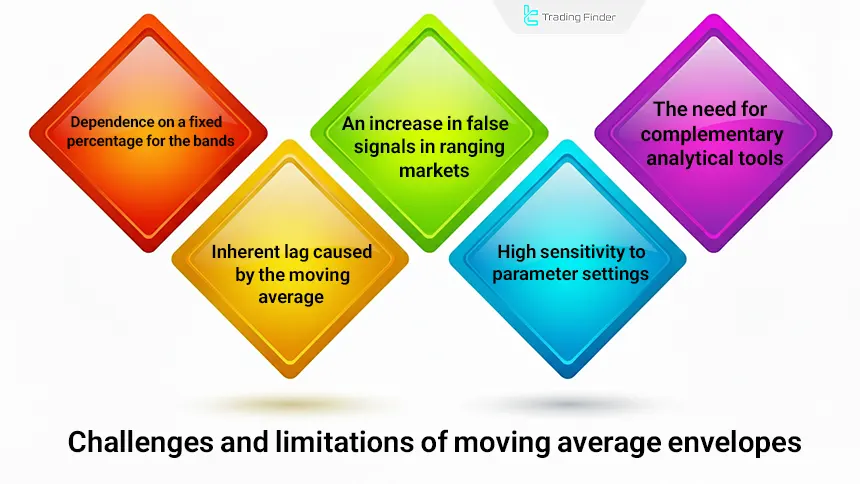
Dependence on a Fixed Band Percentage
The upper and lower bands are drawn based on a fixed deviation from the moving average; this structure reduces the indicator’s adaptability in conditions where market volatility changes suddenly.
In such conditions, the band distance will not sufficiently align with actual price behavior. As a result, to maintain analytical accuracy, the band deviation value must be adjusted live in proportion to market volatility levels.
Inherent Lag Due to the Moving Average
The indicator is calculated based on past data, which causes its reaction to rapid price changes to be delayed; this lag is more apparent at market reversal points.
Part of the initial price move usually forms before the signal is generated. This issue can lead to late entries and a reduced risk-to-reward ratio, especially in fast-moving markets.
Increased False Signals in Ranging Markets
In trendless conditions, repeated price interactions with the bands can lead to the generation of back-and-forth, low-validity signals. This increases the likelihood of premature entries and unsuccessful exits.
In such conditions, using complementary filters to reduce price noise and improve signal validity is essential.
High Sensitivity to Parameter Settings
An inappropriate choice of moving average period or deviation value reduces indicator accuracy and disrupts the identification of valid setups. Incorrect settings fail to filter price noise properly and generate invalid signals.
For this reason, optimizing parameters based on timeframe and market structure plays a key role in improving indicator efficiency.
Need for Complementary Analytical Tools
Using the indicator independently can result in incomplete analysis; combining it with momentum indicators or trend-strength tools increases decision-making accuracy. This combination helps filter weak signals.
Otherwise, the probability of misinterpreting market conditions and increasing low-yield trades rises noticeably.
Conclusion
The moving average envelope is a combined tool based on moving averages that defines trend analysis and price fluctuations by adding upper and lower bands as a percentage of the average.
In addition to confirming the trend direction by evaluating slope, it also acts as a framework in neutral markets for identifying overbought and oversold levels.
Signals generated from price interacting with the bands-considering the band’s position relative to the slope of the average and support and resistance levels can provide entry and exit points with lower risk.


