


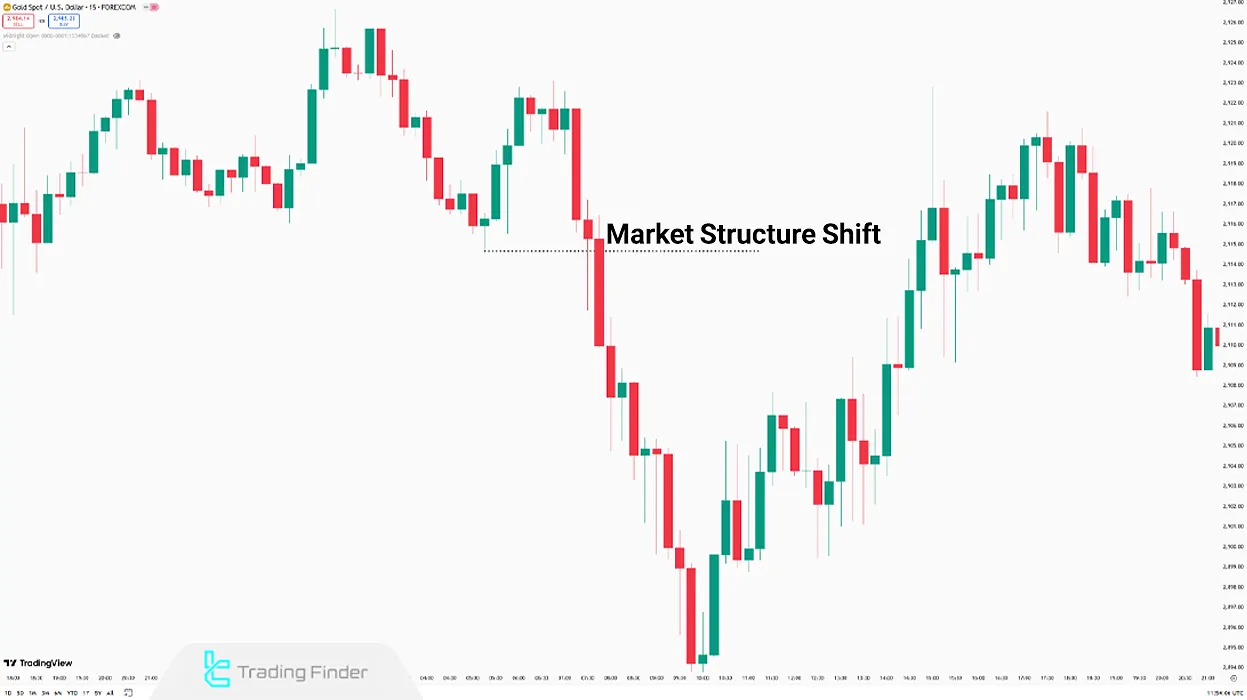
Market Structure Shift (MSS) indicates a genuine trend change that occurs when key support or resistance levels are completely broken.
In practice, traders often ask what is MSS in trading or mss trading meaning, because understanding this concept is essential to capture long-term moves.
For example, identifying MSS in stock market conditions or recognizing mss meaning in forex trading can guide investors toward major directional changes.
In contrast, liquidity grab in forex is a type of false breakout designed to trigger stop-loss orders or collect pending orders, after which the price continues in its previous direction.
Many beginners search for what is liquidity grab in forex trading or the general liquidity grab definition, because knowing this protects them from stop hunts.
Understanding these two concepts helps traders distinguish between genuine reversals and deceptive market moves, leading to more accurate analysis.
Market Structure Shift (MSS)
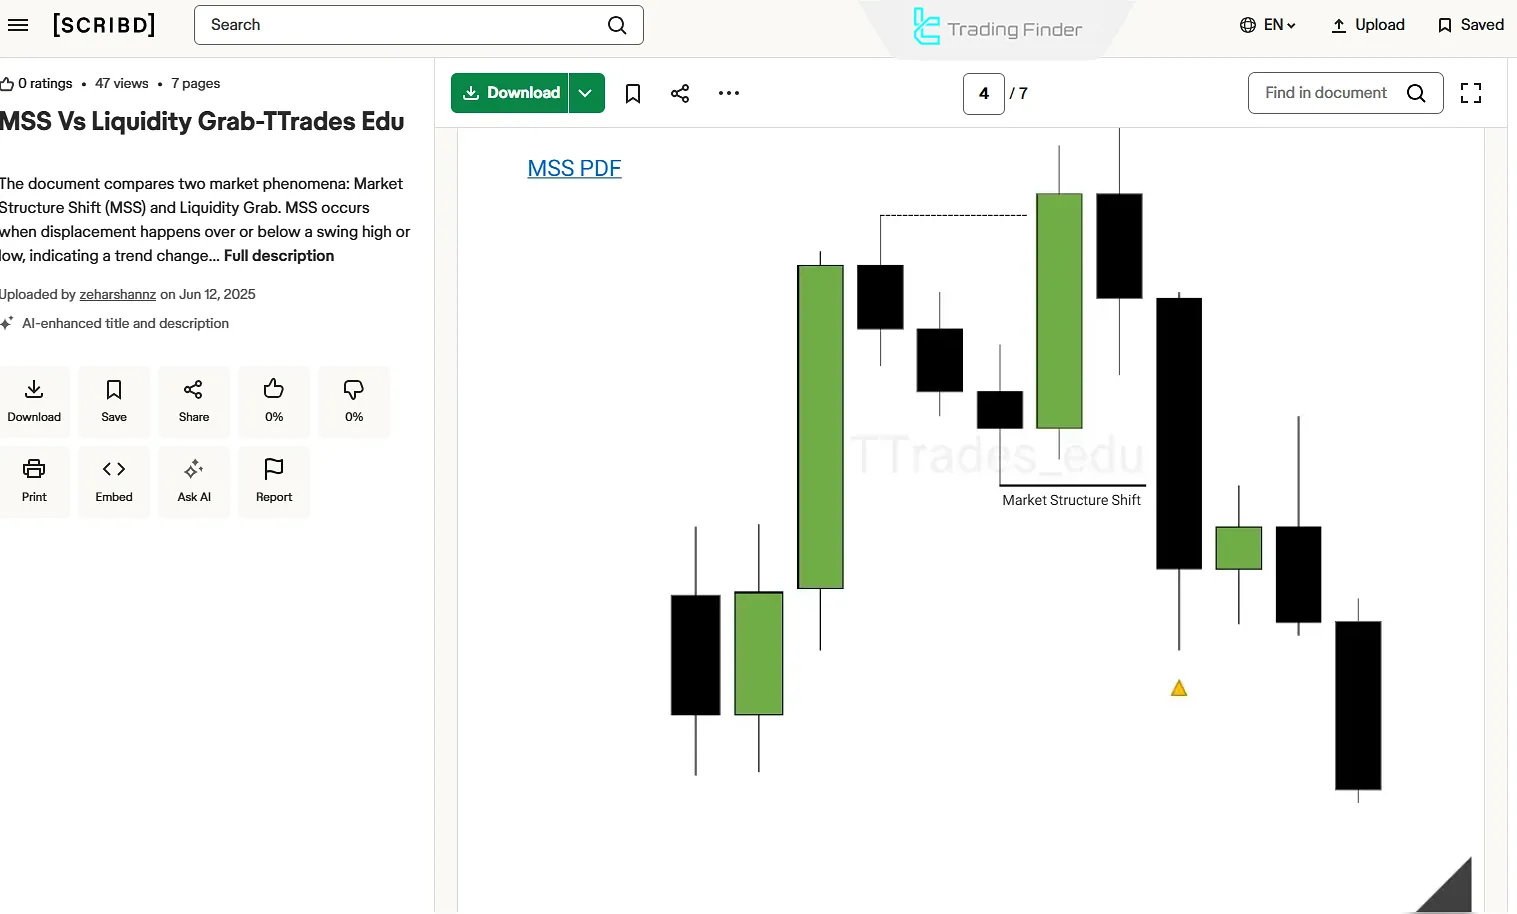
When one of the highs is broken and the price starts forming higher highs (HH) and higher lows (HL), a Market Structure Shift (MSS) occurs.
This event marks a transition in price movement from a downtrend to an uptrend or vice versa.
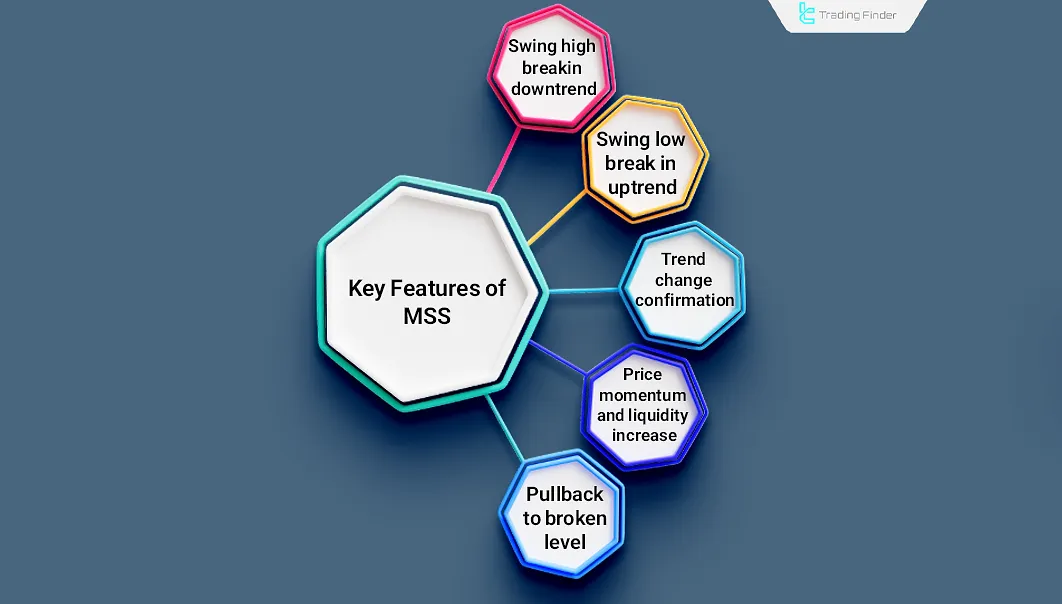
Key Features of Market Structure Shift
In MSS, swing highs and swing lows are broken, revealing specific characteristics in the ICT trading style that help predict price trends. Key features of Market Structure Shift (MSS):
Steps to Identify Market Structure Shift
To recognize MSS, price movements must be analyzed in multiple stages across different timeframes. If confirmation is received at each step, the shift's validity is strengthened.
- Identifying the current market trend (examining highs and lows)
- Checking for a high or low break depending on the current trend
- Confirming the break level (formation of a high or low opposite to the previous trend)
- Assessing changes in price movement strength and liquidity volume
- Reviewing higher timeframes for further confirmation
- Checking for the possibility of a Liquidity Grab
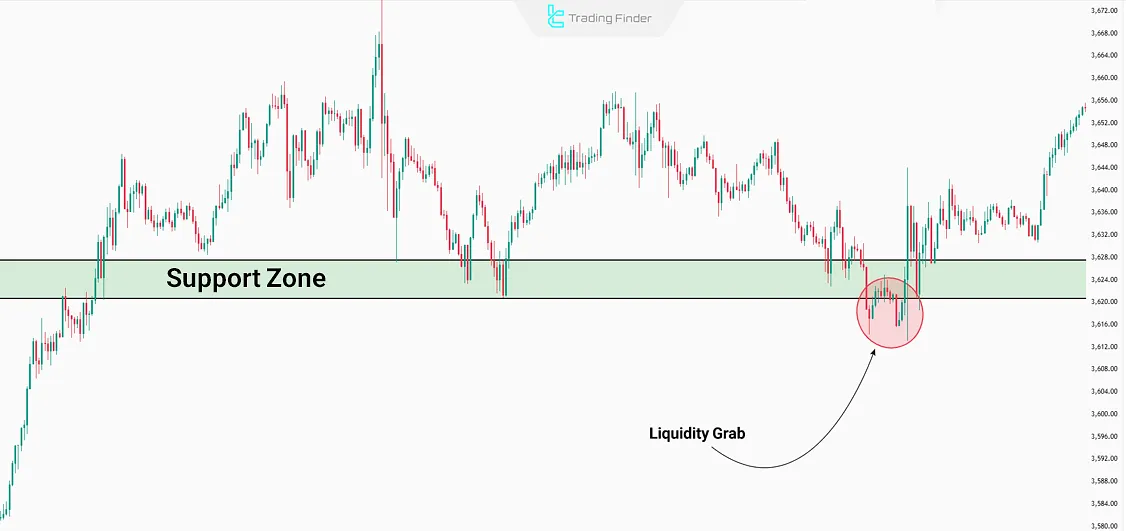
What is a Liquidity Grab?
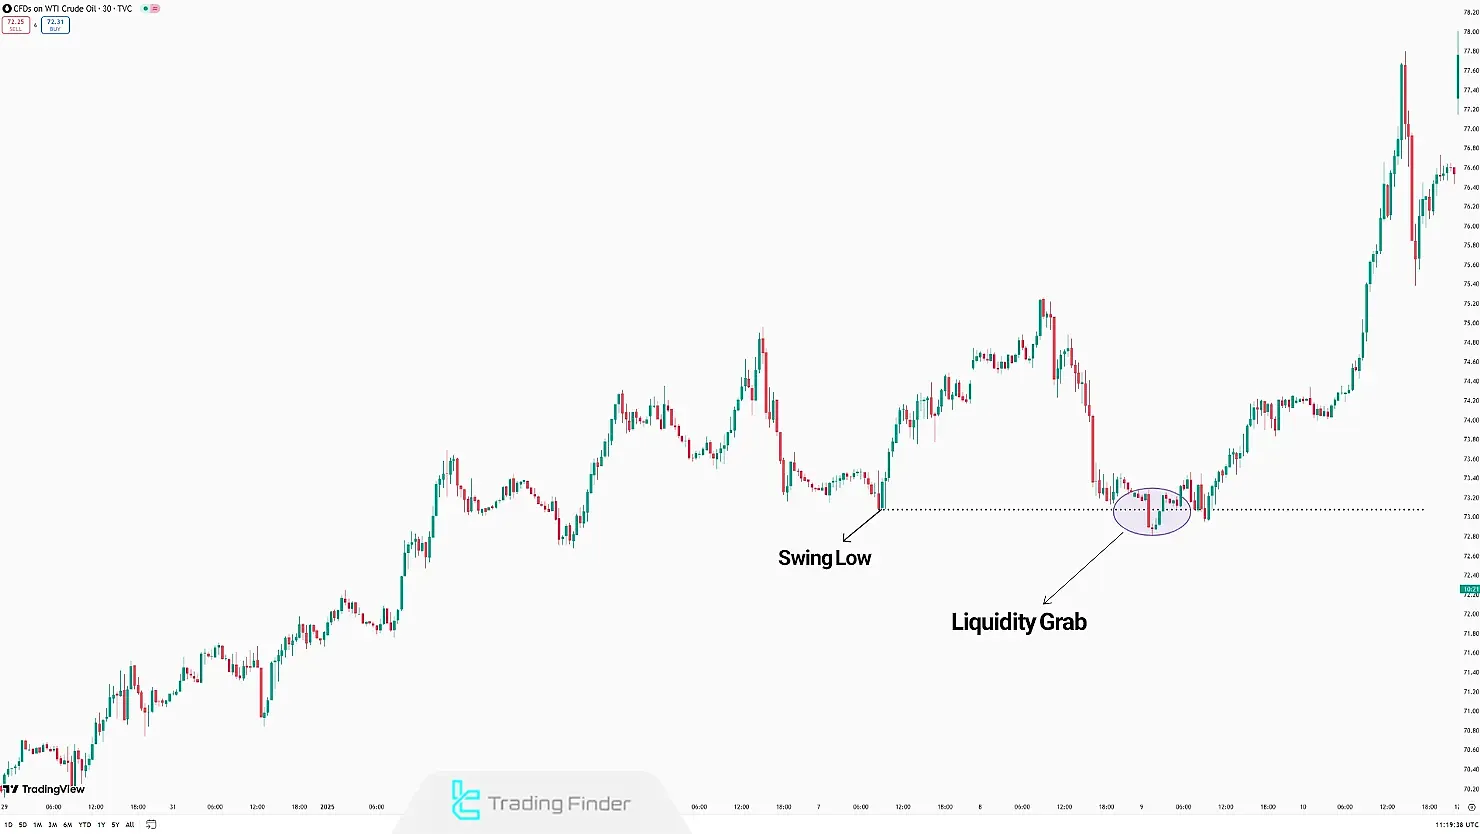
When the price breaks a low and moves past it but fails to sustain, a Liquidity Grab occurs. In such cases, a price reversal to an uptrend can be expected.
Key Features of Liquidity Grab
A Liquidity Grab occurs when a false breakout of support and resistance levels is observed. Characteristics of a Liquidity Grab:
- Mostly occurs near key support and resistance levels
- The price temporarily breaks the level but fails to hold above/below it
- Returns to the previous trend with greater strength and increased liquidity
- Designed to trigger stop losses of retail traders
- It’s More commonly seen in lower timeframes
How to Identify a Liquidity Grab?
Liquidity Grab occurs in three major areas of the market: Support, Resistance, Stop-Loss and Take-Profit Levels.
Retail traders often place sell orders around resistance levels and buy orders near support levels, with stop-losses positioned just beyond these zones.
- The market initially moves toward these levels and triggers orders;
- After activating the orders, the price continues moving toward retail traders' stop-losses;
- Once stop losses are triggered, the necessary liquidity for a major move is collected, and the main price movement begins.
Example of Liquidity Grab Formation
To clarify the concept of a Liquidity Grab, suppose the price in a downtrend approaches a significant support level. In this situation, many retail traders place their stop-loss slightly below this level.
The market quickly breaks the support, triggering stop-loss orders and collecting the liquidity required for the next move. This pattern is often referred to as a liquidity grab reversal or liquidity grab pattern.
Available liquidity in this area to continue the upward move
Immediately after this, the price returns above the broken level, showing that the initial breakout was only a liquidity grab.
This behavior not only forces weak traders out of the market but also creates the path for the continuation of the dominant trend. Advanced traders sometimes build a liquidity grab trading strategy to exploit such short-lived movements.
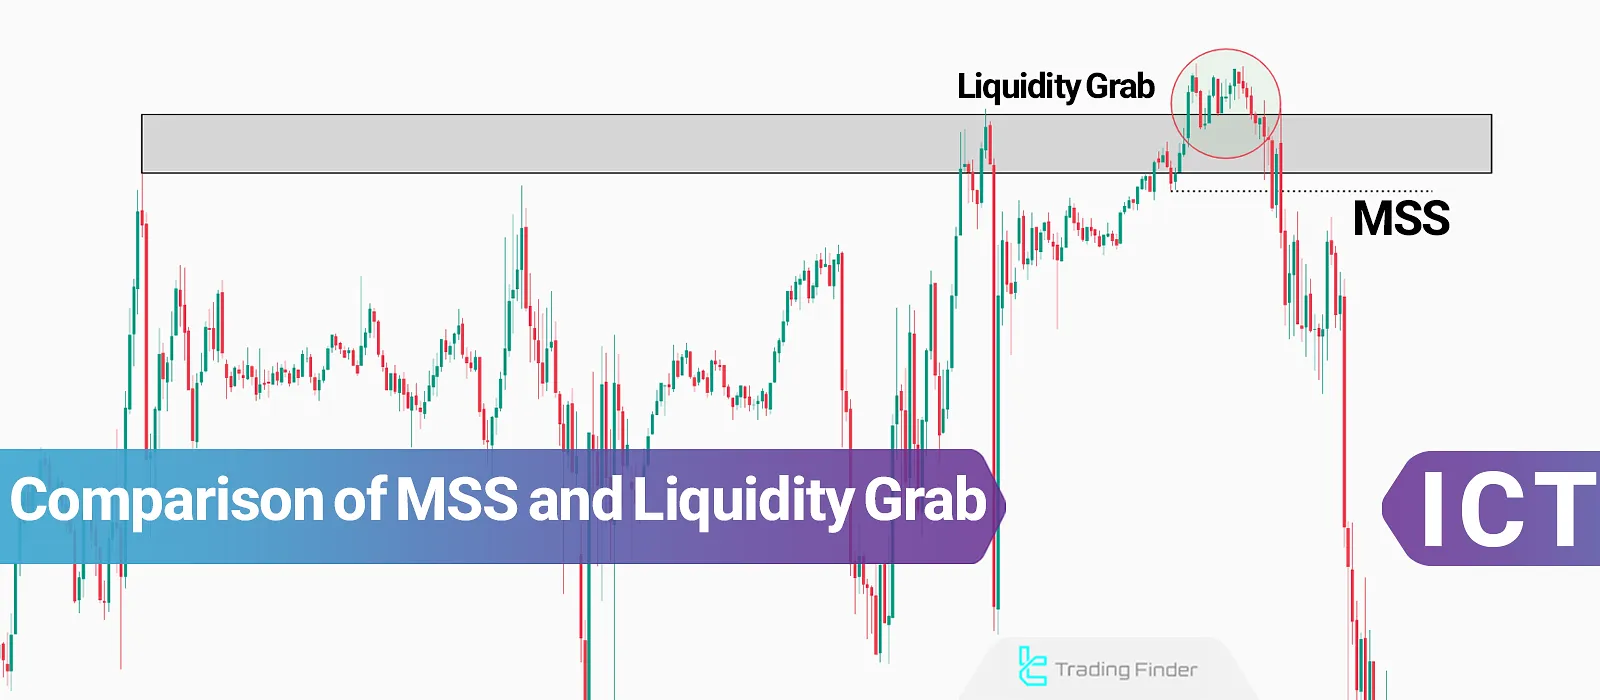
Comparison of MSS and Liquidity Grab
MSS differs from a Liquidity Grab depending on the strength of the breakout and the change in market direction. Difference Between MSS and Liquidity Grab:
Parameters | Market Structure Shift (MSS) | Liquidity Grab |
Characteristics | A real price trend reversal | Liquidity collection for the main move |
Structure | Breaking the last High (H) or Low (L) and forming a new high or low in the opposite trend | False breakout |
Purpose | Identifying the overall trend | Recognizing corrections in the overall trend |
Timeframe | Mostly higher timeframes | Mostly lower timeframes |
Best Trading Style | Swing trading | Scalping |
Differences in Structure
According to the TTrades tutorial on the differences between MSS and Liquidity Grab published on scribd.com, in a Market Structure Shift (MSS), the last swing high or low of the prevailing trend is decisively broken.
This break is usually accompanied by a sudden increase in market liquidity. After the breakout, a pullback to the broken level often occurs.
This pdf can be downloaded from the TTrades YouTube channel on scribd.com
On the YouTube channel (TTrades), these two ICT-style concepts are compared in video format:
In Market Structure Shift (MSS):
- The last high or low of the trend is broken with strong momentum, leading to a sudden surge in liquidity
- After the breakout, a pullback to the broken level is commonly seen
In Liquidity Grab:
- The breakout occurs with low momentum, and no significant increase in liquidity happens initially
- Once stop-losses are triggered, a sudden liquidity surge occurs, pushing the price back to the original trend
Timeframe Differences
MSS and Liquidity Grab signals behave differently across timeframes, and understanding these distinctions is crucial for selecting the right strategy:
- MSS is commonly seen in mid-term timeframes (15-minute and 30-minute charts), offering strong validity
- Liquidity Grab mostly appears in lower timeframes
Trading Styles
Recognizing the difference between MSS and Liquidity Grab helps traders match their approach to the right style, improving timing and consistency:
- Properly identifying MSS allows for swing trading opportunities
- Correctly detecting a Liquidity Grab is ideal for scalping
Why is Understanding the Difference Between MSS and Liquidity Grab Important?
To better understand the difference between liquidity sweep and liquidity grab and how institutions apply these concepts, the table below compares the features of market structure shift MSS ICT with different types of liquidity grab in trading.
This comparison is helpful for those learning how to identify MSS as well as those exploring what is liquidity grab in trading or in forex and crypto markets.
Feature | Market Structure Shift (MSS) | Liquidity Grab |
Nature of Price Action | Full break of support or resistance with trend reversal (key to MSS forex and mss structure) | Brief level break and return to trend (seen in liquidity grabs) |
Impact on Trading | Genuine trend change and start of a long-term move (mss in ict trading context) | False breakout to activate retail stop-losses (liquidity grab meaning) |
Avoiding Wrong Entry | Correct identification of MSS prevents false breakouts (mss in trading chart or mss entry) | Recognizing liquidity grabs prevents wrong trades (how to identify liquidity grab) |
Entry & Exit Optimization | Helps find reliable entry points for a full trend and long-term profit (whatismsstrading) | Creates short-term trades from small price moves (liquidity grab strategy) |
Stop-loss & Take-profit Management | More precise determination of stop-loss and take-profit levels based on real breaks (msshunt) | Avoiding stop-hunts by identifying liquidity zones (liquidity grab indicator) |
Institutional Application | Institutions confirm MSS to continue a trend (ictMSS) | Financial institutions use grabs to collect structural liquidity in forex and mislead retail traders |
Avoiding Entry Mistakes
In a Liquidity Grab, the price pierces support/resistance but fails to sustain, returning to its previous trend.
The level is completely broken in an MSS, leading to a shift in trend. Confusing these two concepts can result in losing trades.
Optimizing Trade Entries & Exits
Understanding how MSS and Liquidity Grab interact allows traders to refine their entry and exit timing for higher accuracy and better risk-reward:
- Identifying MSS helps traders find strong entry points to profit from a complete trend reversal;
- Recognizing a Liquidity Grab prevents failed trades and helps spot short-term entries for quick profits.
Better Stop-Loss & Take-Profit Management
Institutions often use Liquidity Grabs to manipulate retail traders, triggering stop-losses to fuel their desired price move.
Understanding this allows traders to set stop-losses correctly and avoid stop-hunting.
MSS provides reliable breakout confirmation, helping in defining stop-loss and take-profit levels.
Market Structure Inducements Indicator
The Market Structure Inducements Indicator is based on market structure concepts (Market Structure) within ICT trading style and is recognized as one of the advanced Smart Money tools on TradingView.
This tool helps traders who are interested in mss forex or want to understand mss in ict trading better.
This indicator highlights three key concepts Change of Character (CHoCH), Break of Structure (BOS), and Liquidity Sweeps with colored lines and labels on the chart, enabling traders to differentiate between real and false breakouts.
By doing this, it reduces confusion between MSS in trading chart confirmation and situations of liquidity grab in trading.
In bullish conditions, this indicator, after registering CHOCH and multiple liquidity grabs, still validates the upward trajectory.
Its settings panel is highly flexible, including options like ChoCh Detector Period for character change detection, BoS & Liquidity Detector Period for market structure shift (MSS) and liquidity, and Inducement Detector Period for inducement zones.
Additionally, customization of colors, labels, and display levels is available.
In summary, the Market Structure Inducements Indicator is a comprehensive tool for analyzing forex, crypto, stocks, commodities, and indices.
Its focus on combining the three core elements of market structure enables traders in intraday strategies and multi-timeframe analysis to make more accurate decisions regarding trend shifts and liquidity zones.
By recognizing structural liquidity in forex, traders can avoid traps like the difference between liquidity sweep and liquidity grab, and by using tools such as a liquidity grab indicator, they can refine entries and exits.
Some professionals also discuss concepts like mss hunt or mss entry, which highlight how ict MSS integrates with advanced strategies.
- Adding ICT Market Structure Inducements Indicator to TradingView
- Download Market Structure Inducements Indicator with inducements for MetaTrader 4
- Download Market Structure Inducements Indicator with inducements for MetaTrader 5
Conclusion
Comparison of Market Structure Shift and Liquidity Grab highlights the fundamental distinction between these two concepts.
Market Structure Shift (MSS) is a significant trend change typically found in 15-minute and 30-minute timeframes. Identifying MSS helps traders find optimal entry points.
Liquidity Grab is a trap for retail traders. It collects stop-loss orders around support/resistance levels, allowing institutions to gain the necessary liquidity for a major move.
This phenomenon is mostly observed in lower timeframes (1-minute and 5-minute charts).


