


In technical analysis, volume plays a crucial role in identifying the true strength of price movements. The OBV indicator combines price and volume to track market liquidity flow and, as a leading tool, signals before trend reversals.
This feature makes OBV an effective tool for spotting divergence, confirming trends, and analyzing smart money inflows.
What is the OBV Indicator?
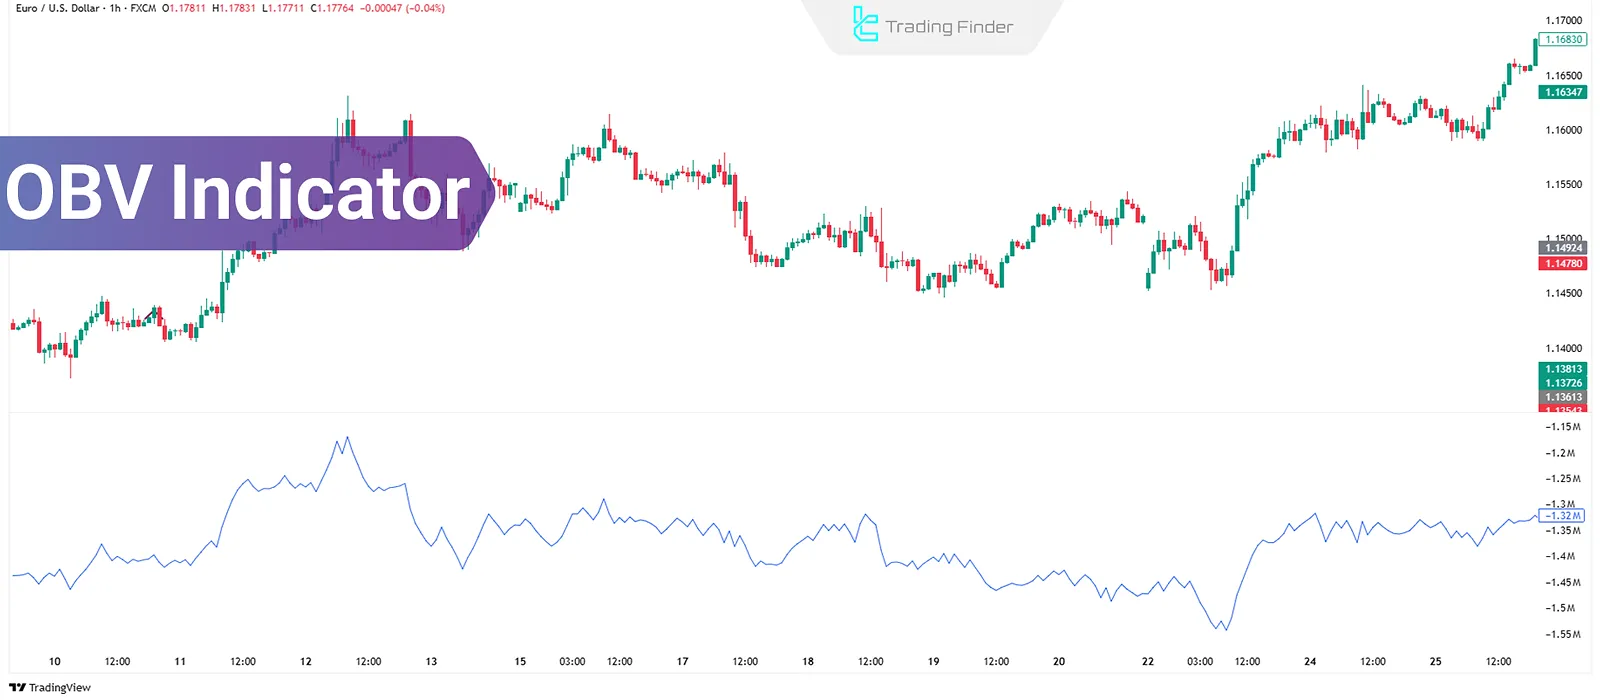
The OBV (On Balance Volume) indicator is a volume-based tool that combines the closing price of each candlestick with trading volume to indicate the direction of money flow in the market.
Its logic is based on the principle that volume changes often precede price changes; therefore, it can be used as a forecasting tool for market trends.
It is displayed as a continuous line in a separate window below the price chart. On platforms like MT4, MT5, and TradingView, this line has no fixed range and moves upward or downward based on added or subtracted volume.
Changes in this indicator may appear before price direction changes. This makes it suitable for identifying divergences, confirming trends, and examining the inflow or outflow of large capital.
How to Calculate and Configure the OBV Indicator
The calculation is based on the default "closing price," although it can be adjusted to other price types in MetaTrader. OBV calculation method:
- If the current candlestick's closing price is higher than the previous one, the volume is added to the OBV value;
- If the price is lower, the volume is subtracted;
- If the prices are equal, the OBV remains unchanged.
Three main tabs in OBV indicator settings:
- Parameters: Select price type, adjust color, thickness, and line style (solid, dotted, etc.);
- Levels: Add horizontal levels to monitor key volume zones, similar to overbought/oversold levels;
- Visualization: Define timeframes where the indicator will be visible.
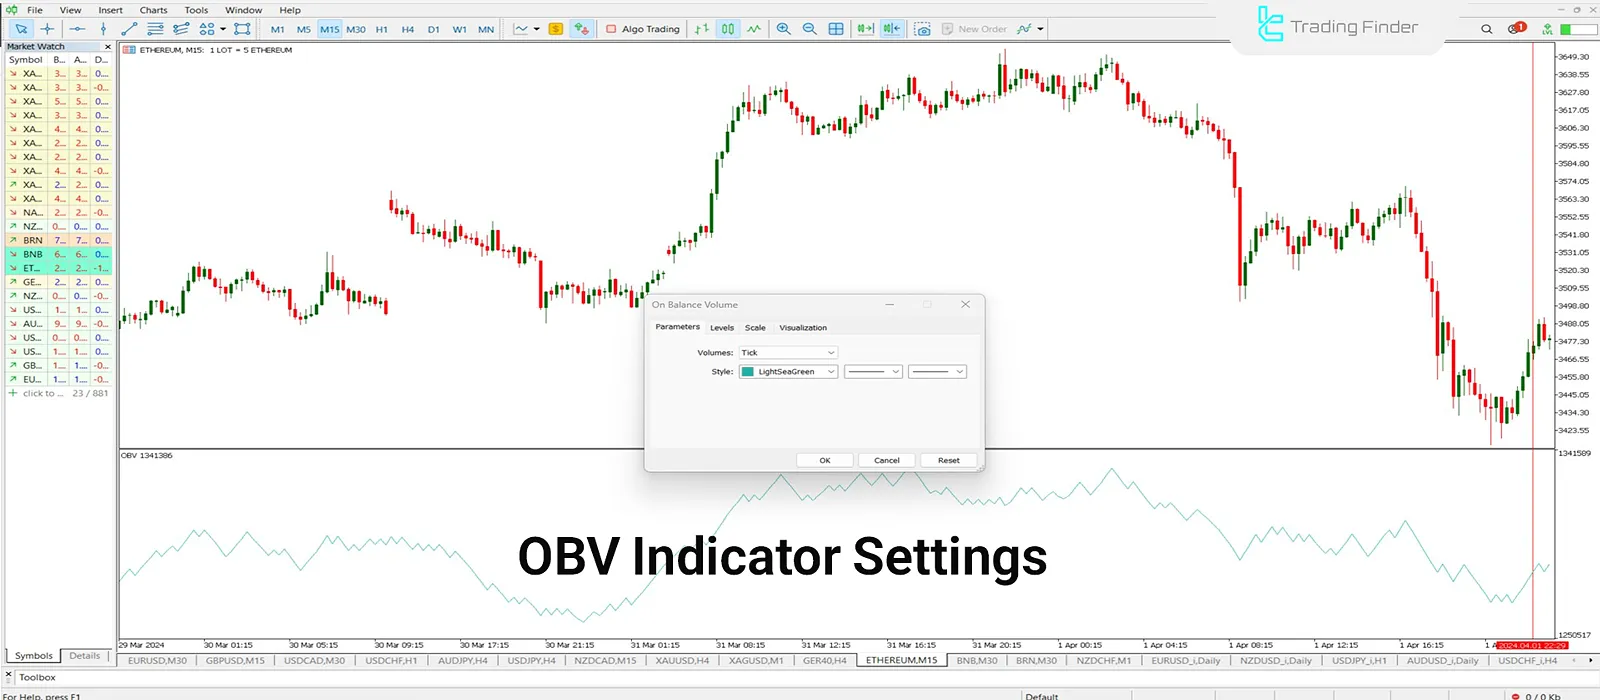
In the Forex market, unlike stock exchanges, real volume is not available; instead of actual trade volume, Forex uses "Tick Volume" (the number of price changes in a time period).
This limits OBV’s accuracy in the Forex market, especially on lower timeframes. However, on higher timeframes (H4 and daily), data aggregation compensates for this weakness, allowing OBV to effectively analyze liquidity flow.
OBV Signals and Analytical Applications
In OBV analysis, four signal types can be extracted, each with a specific application in trading decisions. Four methods of signal extraction from OBV:
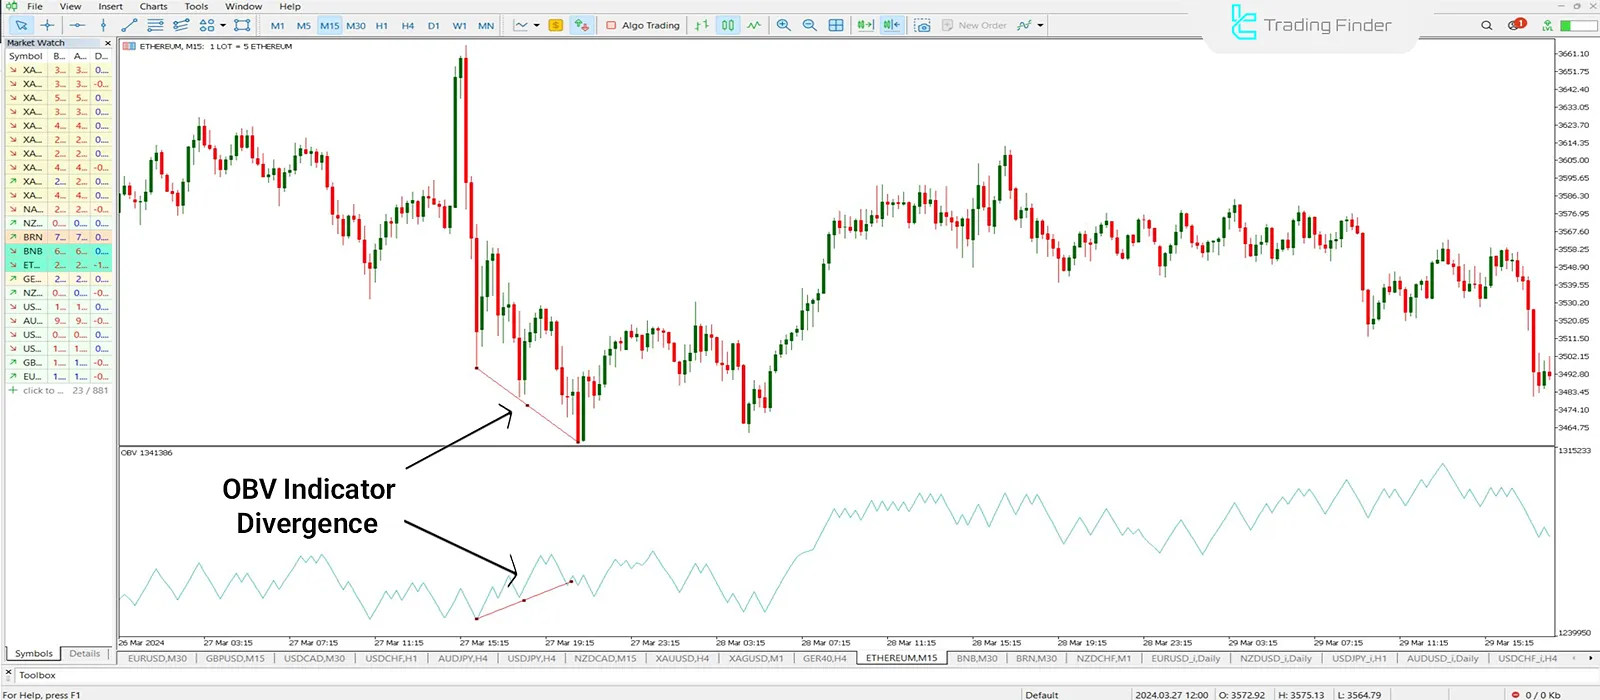
Divergence
One of the most important OBV signals is divergence. In bullish divergence, price creates lower lows while OBV records higher lows signaling smart money entry and a likely upward reversal.
Conversely, in bearish divergence, price makes new highs, but OBV fails to confirm and shows lower highs. This indicates a likely bearish reversal and is a strong signal to exit or take an opposite position.
Trend Confirmation
Trend confirmation occurs when the OBV and price move in the same direction. For example, in an uptrend, a consistent price increase accompanied by a rising OBV indicates confirmation of money flow and trend strength.
This signal is not delayed but requires close monitoring, as trends are not perpetual. It's recommended to use additional methods like price action to spot potential weaknesses.

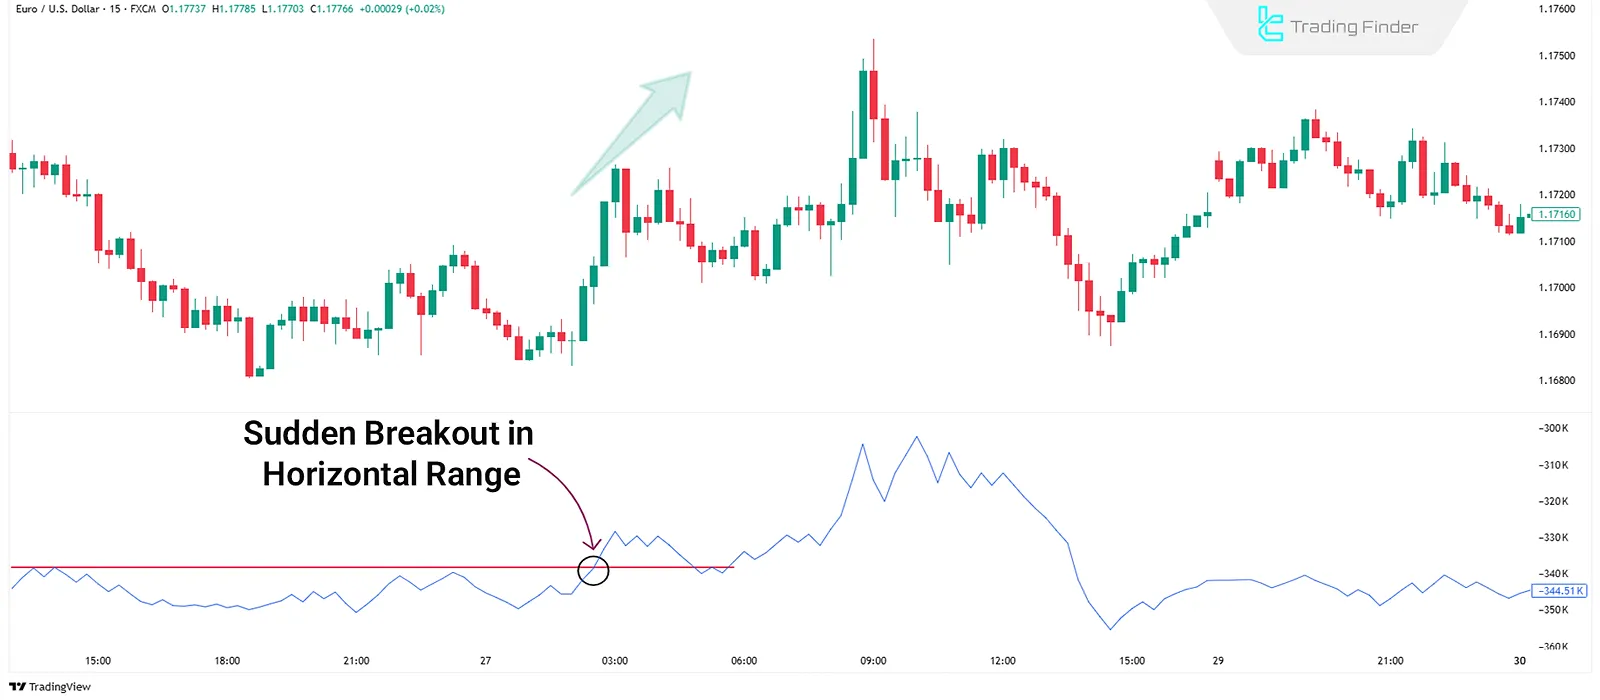
Level Break
Level break is identified by examining volume accumulation zones on the OBV chart. If OBV moves horizontally for a long period and then suddenly breaks out, there is a high probability that price will react shortly after.
This usually occurs due to the entrance or exit of major market players and may initiate a new trend.
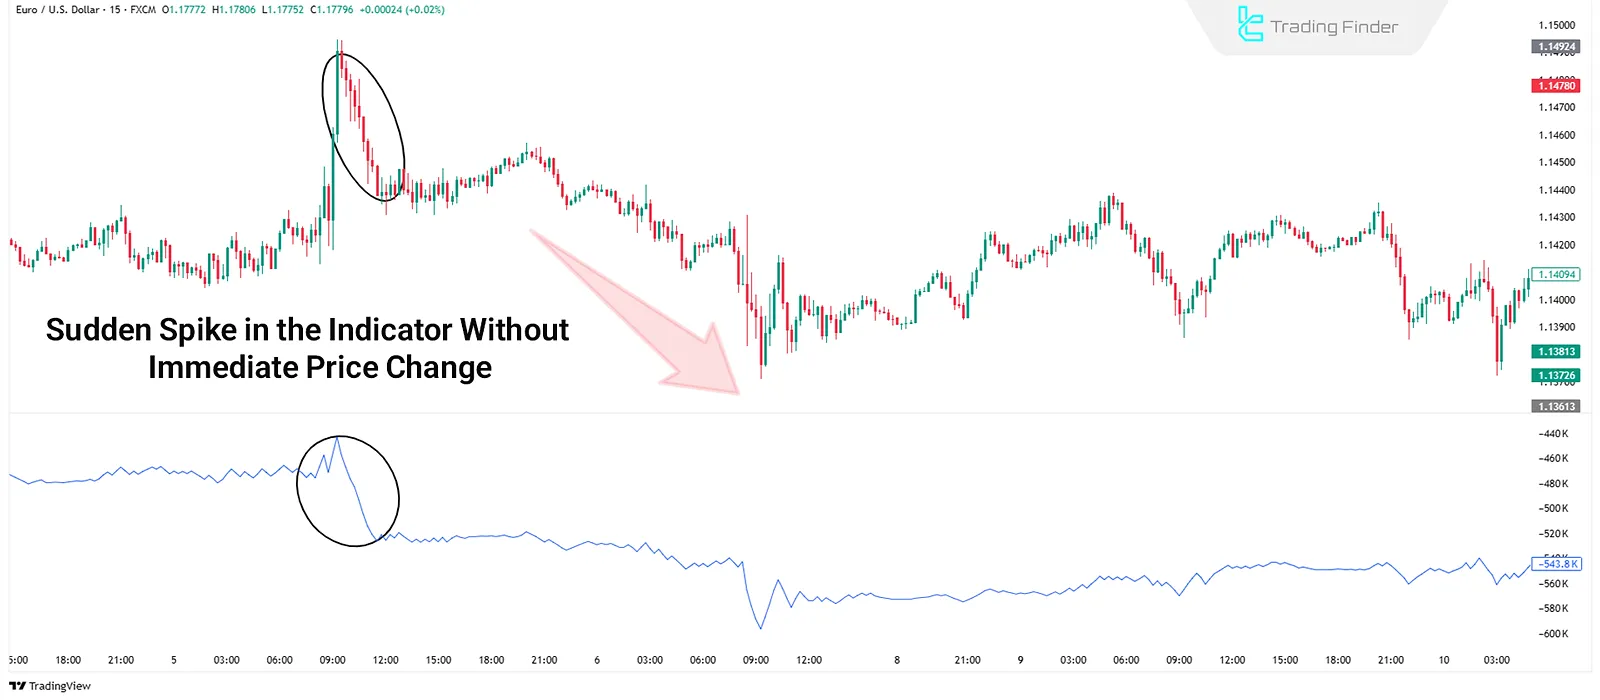
Abrupt Volume Surge
A sudden surge in volume is a key signal that may appear without immediate price movement. A strong OBV jump can indicate institutional investment and the formation of a powerful trend soon.
If this surge is against the current price trend, it increases the likelihood of a reversal. Monitoring OBV momentum in such cases helps traders react ahead of the market.
Trading Strategy Using OBV and SMA
In the OBV trading strategy, a combination with the 14-period Simple Moving Average (SMA 14) is used. The goal is to identify entry points in the trend direction with volume confirmation ideal for beginner traders needing clear and traceable signals.
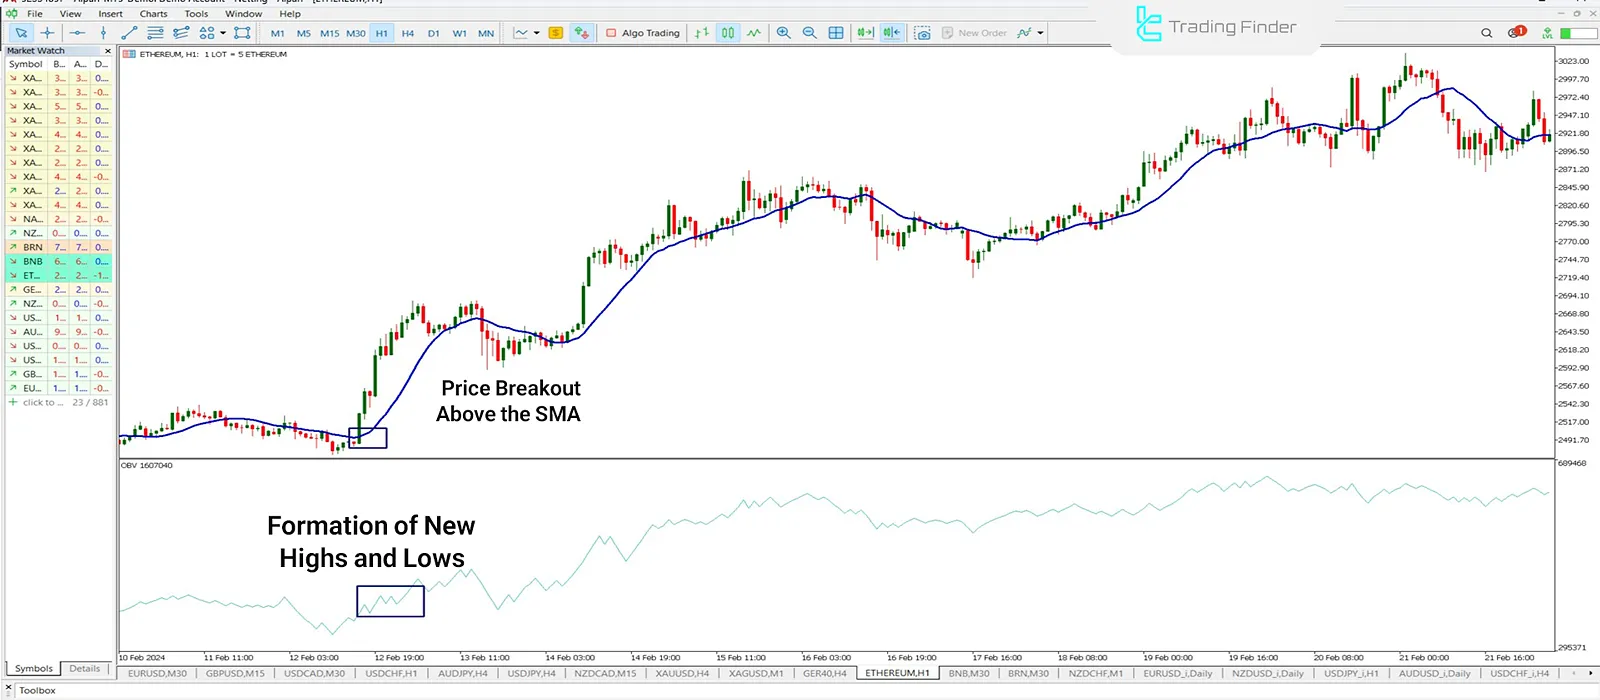
Buy Trades Using OBV and SMA
A buy signal is generated when the price breaks above the 14-period SMA. Simultaneously, OBV should be making new highs or at least be in an uptrend.
This combination indicates positive money flow entering the market and the beginning of an upward move. The trader can enter a long position on the next candlestick.
Sell Trades Using OBV and SMA
A sell signal occurs when the price drops below the SMA. Simultaneously, OBV should be forming new lows or be in a downtrend.
This situation reflects capital outflow and a likely continuation of the downtrend. In this case, entering a sell position on the next candlestick is advised.
OBV Indicator Pros and Cons
The OBV indicator is evaluated based on its performance across different market conditions. OBV advantages and disadvantages table:
Advantages | Disadvantages |
Leading and early signals | False signals on lower timeframes |
Simple and straightforward | Low accuracy in markets lacking real volume |
Suitable for trend and strength ID | Inability to fine-tune parameters |
No need for complex configurations | Over-sensitivity to short-term volatility, especially Tick Volume |
Conclusion
The OBV indicator is a liquidity flow analysis tool that combines price and volume to offer powerful signals for trend direction, divergence, and smart money activity.
Its accuracy decreases in markets lacking real volume, particularly on lower timeframes. Combining OBV with tools like moving averages and price action boosts its effectiveness.


