


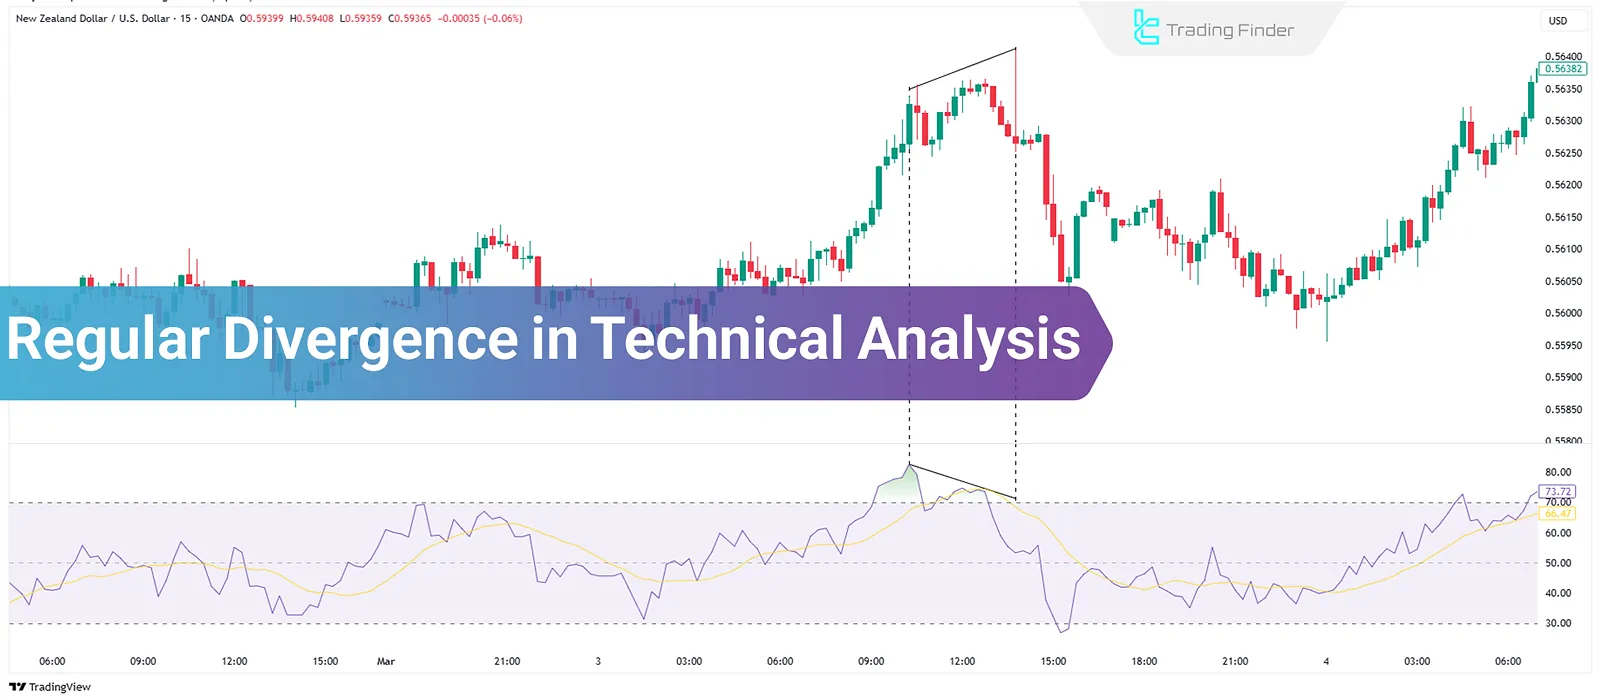
Regular Divergence in technical analysis is one of the methods used to identify potential trend reversal points. This concept uses various indicators such as RSI, MACD, and Stochastic to provide signals of weakness or trenddirectionchanges.
Trading with regular Divergence allows entering near price peaks and troughs to minimizerisk.
What is Regular Divergence?
Regular Divergence in Forex Market and other financial markets occurs when there is a discrepancy between the price movement and technical indicators.
This lack of alignment is usually a sign of weakness in the current trend and is considered a warning for a potential market direction change.
How Many Types of Regular Divergence Exist?
Regular Divergence can be divided into two types:
- Bullish Regular Divergence
- Bearish Regular Divergence
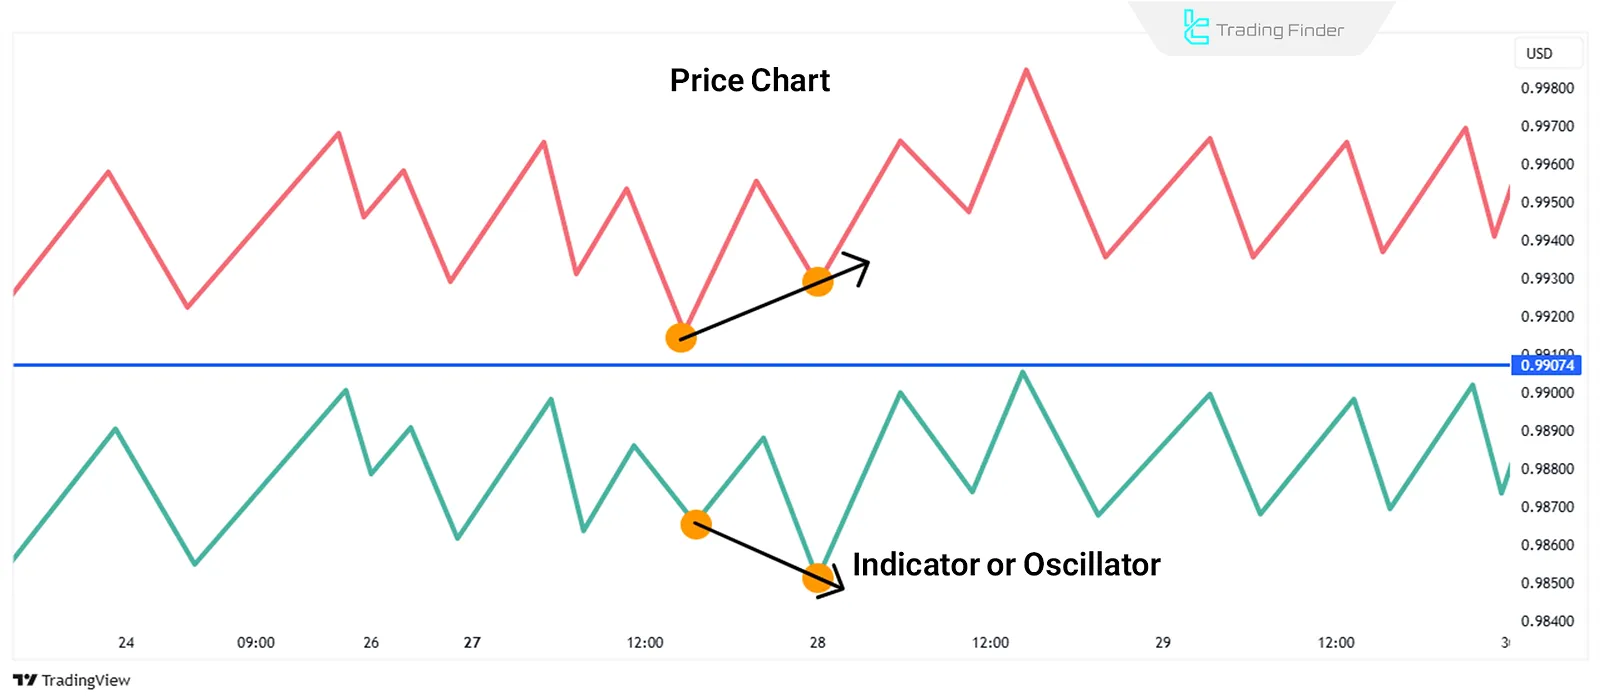
Bullish Regular Divergence
Bullish Regular Divergence occurs when the price of an asset registers lower lows, but the indicator shows higher lows. This type of Divergence typically appears at the end of a downtrend and can signal a potential price increase.
If, after the formation of the second trough, the indicator does not form a lower low, it indicates weakness in the downtrend and strengthens the likelihood of a price increase.
The image below shows an example of this type of Divergence:
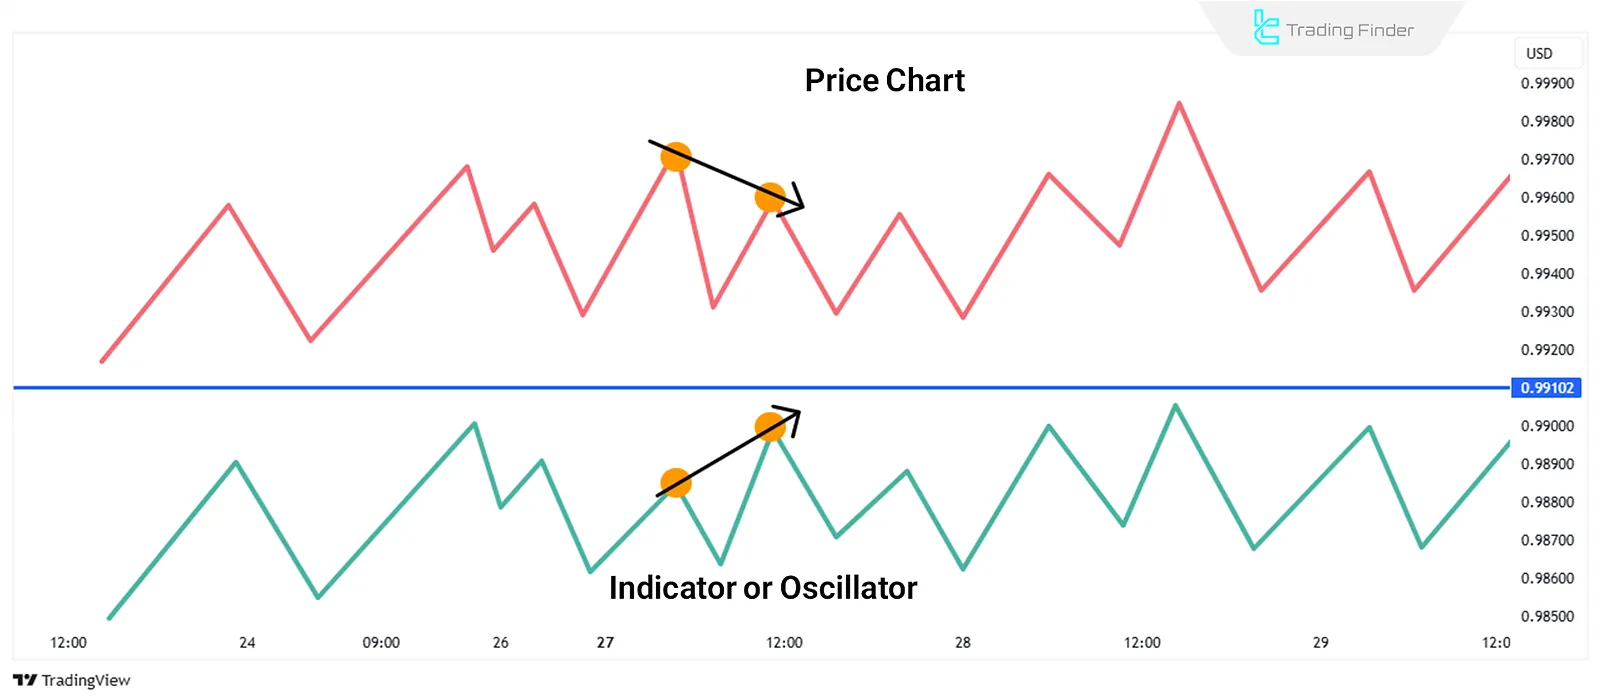
Bearish Regular Divergence
Bearish Regular Divergence happens when the price of an asset registers higher highs, but the indicator shows lower highs. This type of Divergence is usually observed at the end of an uptrend and can signal a potential price decrease.
If the price forms a new high but the indicator fails to surpass the previous high, it indicates a weakening of the bullish trend and increases the likelihood of price correction.
The image below shows an example of this type of Divergence:
How to Use Regular Divergence in Trading?
Trading with regular Divergence is an effective method for detecting market reversal points. In this method, indicators like RSI, MACD Indicator, Stochastic, and CCI are used to identify Divergence.
Once regular Divergence is identified, it can be confirmed with other technical analysis tools, such as support and resistance levels, trendlines, and candlestickpatterns, to determine optimal entry and exitpoints.
Difference Between Regular and Hidden Divergence
The table below highlights the key differences between regular and hidden divergence:
Type of Divergence | Definition | Trading Signal | Additional Notes |
Regular Divergence | Occurs when price and indicator move in opposite directions | Trend Reversal | Indicates a potential end to the current trend and the beginning of a new one. |
Hidden Divergence | Occurs when price makes a higher high or lower low, but the indicator does not | Trend Continuation | Typically seen as confirmation of the existing trend continuation |
Conclusion
Regular Divergence in technical analysis is a practical tool for identifying trend reversal points. This Divergence occurs when a discrepancy between the price and indicators such as RSI and MACD appears.
In bullish Divergence, the price forms lower lows, but the indicator shows higher lows. Conversely, in bearish Divergence, higher price highs are accompanied by lower highs in the indicator.
Combining this signal with support and resistance levels and other technical tools enhances its reliability.


