


The Simple Moving Average(SMA) is a trend-following indicator in technical analysis that smooths price data and reduces market noise, providing entry and exit signals.
Traders sometimes use this indicator as a form of dynamic support and resistance. In addition, combining multiple Simple Moving Averages with different time periods allows traders to build effective trading strategies.
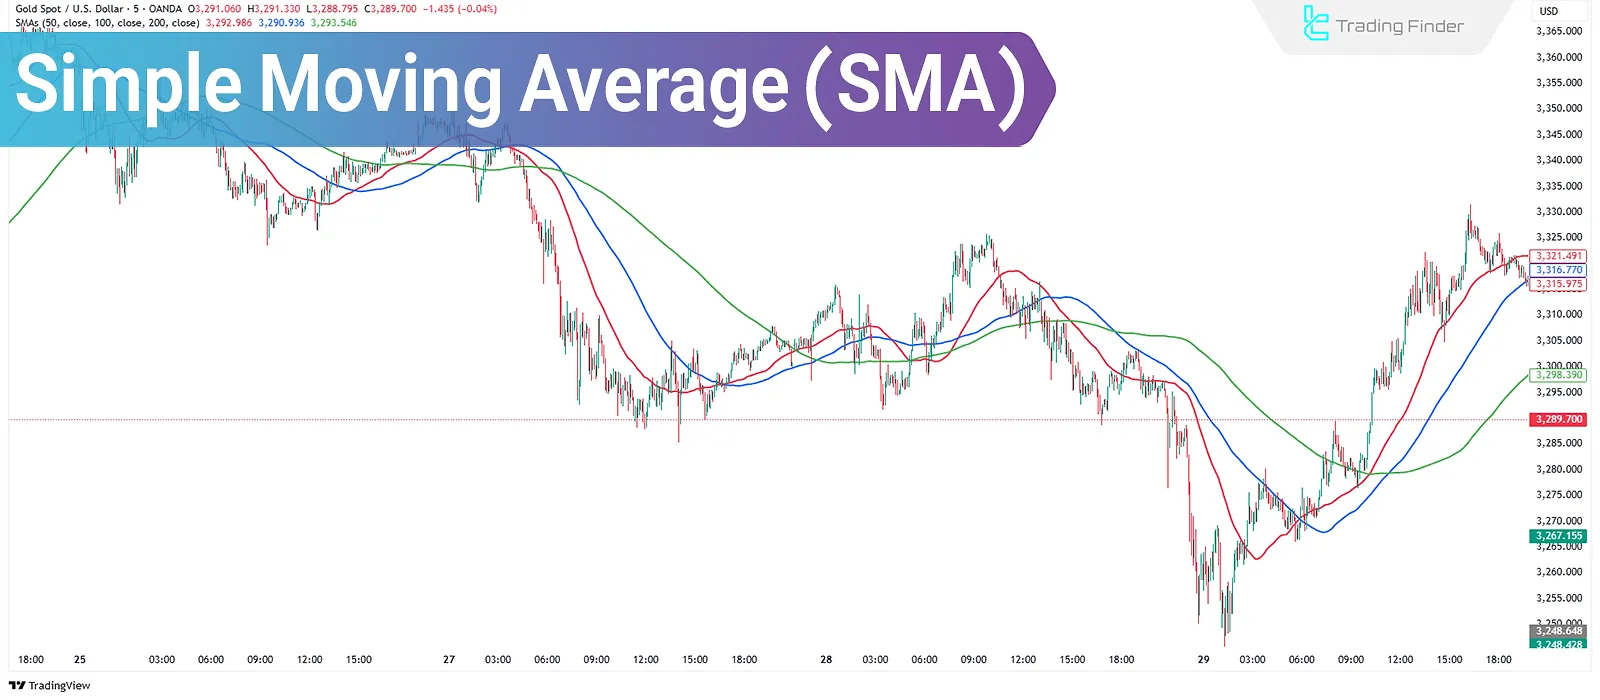
What Is a Simple Moving Average (SMA)?
The Simple Moving Average (SMA) is a tool that calculates the average price data over a specified time period and displays it as a continuous line on the price chart.
Due to its equal weighting of all recent price data, the SMA does not react quickly to sudden price changes, making it a suitable indicator for identifying long-term trends.
History of the Simple Moving Average (SMA)
The concept of the Moving Average was first used in the 18th century to analyze population trends.
In the early 20th century, Charles Dow introduced this idea to the stock market, and since then, the Simple Moving Average (SMA) has become one of the fundamental tools of technical analysis.
Advantages and Disadvantages of the Simple Moving Average
The Simple Moving Average (SMA), due to its transparent structure and ease of understanding, is considered one of the most suitable tools for beginner traders.
This indicator, without requiring complex calculations, determines the overall market trend simply by examining the price position relative to the SMA line. The advantages and disadvantages of the SMA are listed in the table below:
Advantages | Disadvantages |
Simplicity and ease of use | Lagging in response |
Trend identification | Low sensitivity to real-time fluctuations |
Smoothing out price noise | Potential trend misidentification |
Detecting support and resistance zones | Inaccurate signals |
Usable across different timeframes | Less effective in highly volatile markets |
How to Calculate the Simple Moving Average (SMA)?
The formula for the Simple Moving Average is a fixed equation that assigns equal weight to all past data within a specific time period. The formula for calculating the Simple Moving Average (SMA) is:
In the article simple moving average (SMA) tutorial and its calculations on investopedia.com, more details about the SMA are discussed.
Applications of Simple Moving Average (SMA) in Technical Analysis
The Simple Moving Average filters out price volatility. It's ideal for identifying long-term trends and is not suitable for short-term or rapid price swings.
The continuous line of the SMA can also act as a dynamic or moving support/resistance level.
How to Use the Simple Moving Average (SMA) in Technical Analysis?
To use the SMA effectively, traders should align its usage with their trading strategy. For instance, in trend-following strategies like swing trading, the SMA can be applied on higher timeframes.
It can be used standalone or in combination with other SMAs. However, relying on just one indicator is usually discouraged due to potential inaccuracies.
In the educational video on the TraderTV Live channel, the Simple Moving Average and its practical usage are explained in more detail.
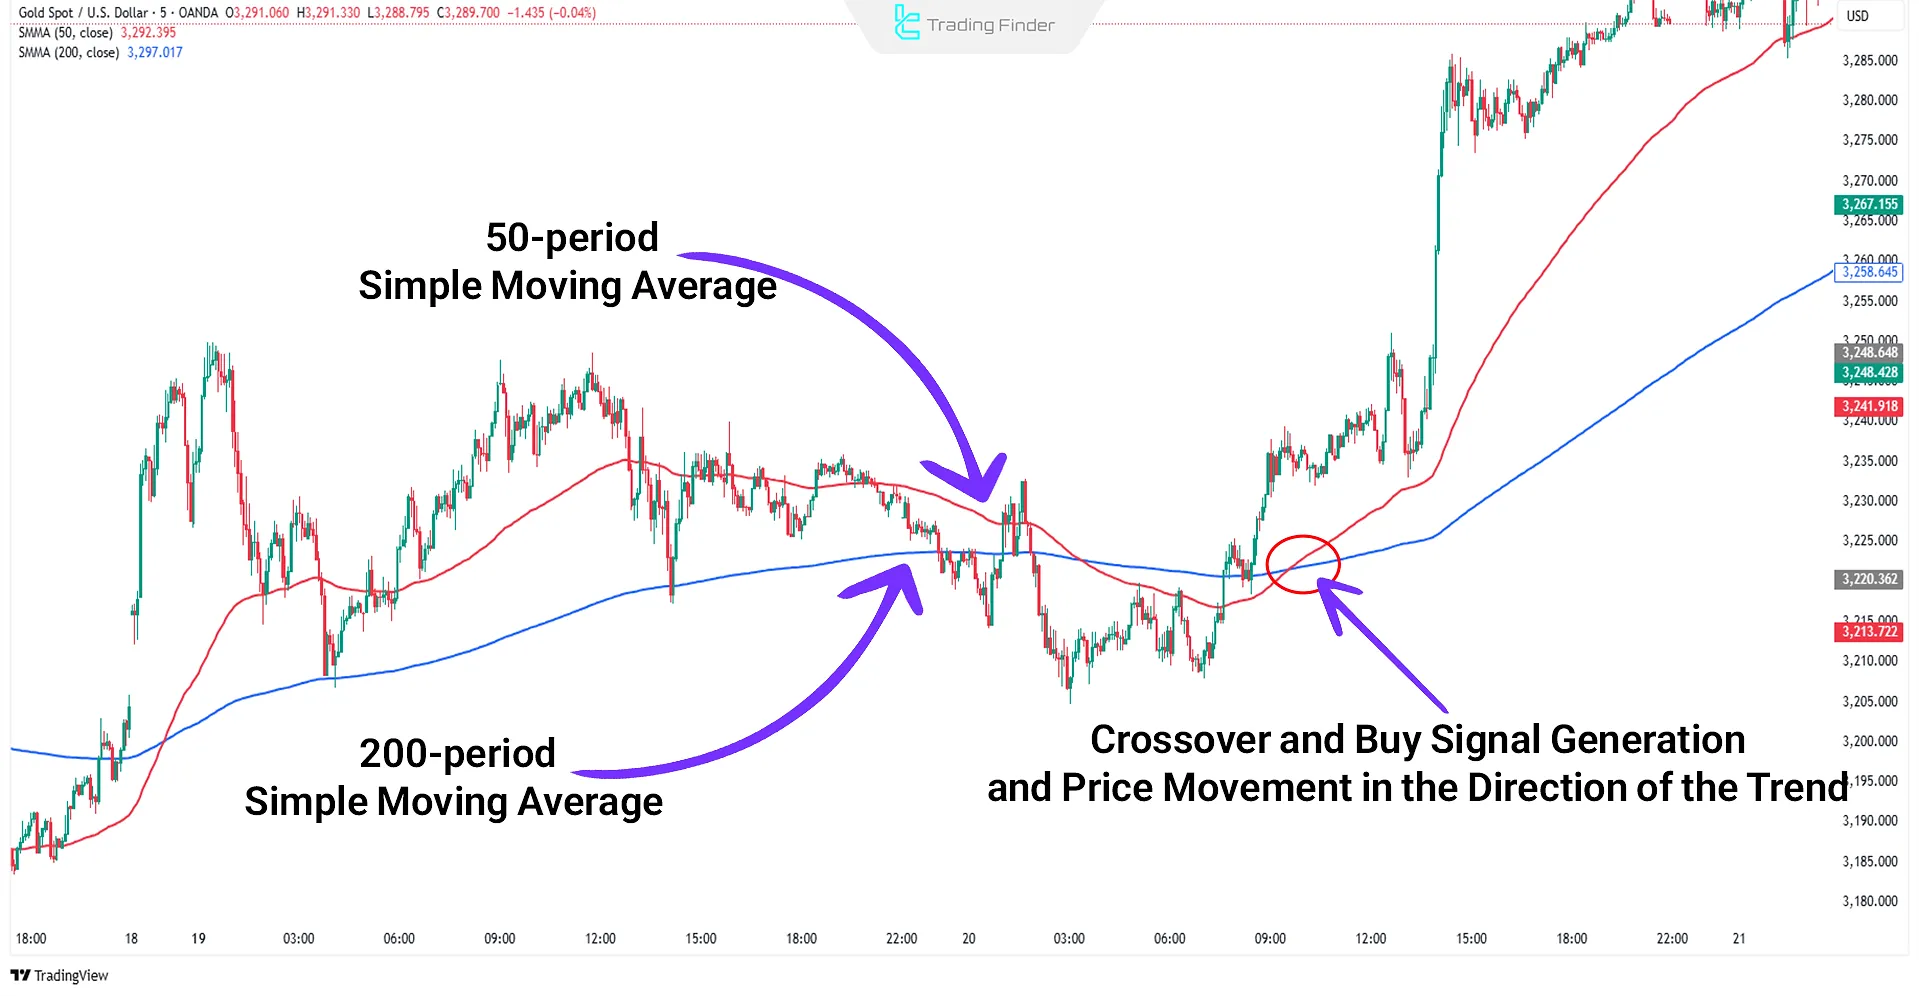
Trading Example Using the Simple Moving Average (SMA)
In the example below, two SMAs (50-period and 200-period) are used. When both appear below the price chart and the 50 SMA crosses above the 200 SMA, it generates a buy signal.
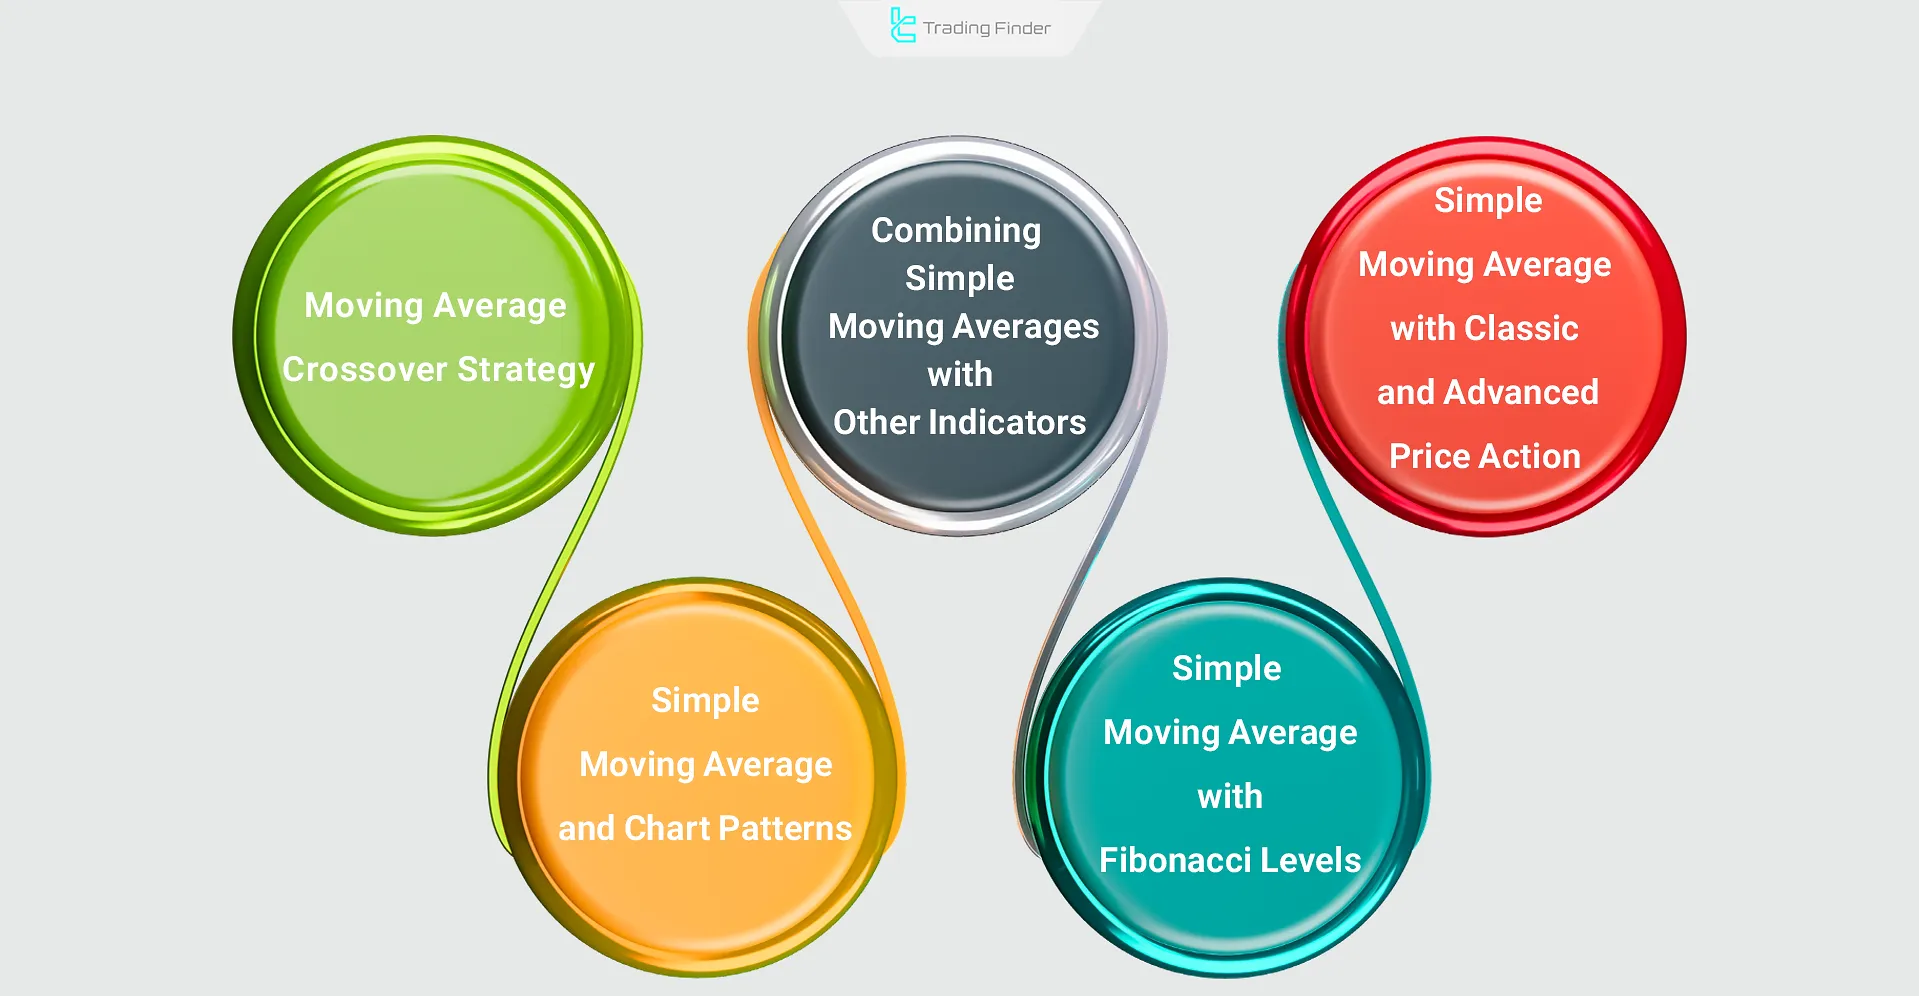
Trading Strategies Using the Simple Moving Average
The Simple Moving Average is versatile in strategies aimed at identifying trends, reversals, and support/resistance levels. Below are several SMA-based strategies:
- Crossover strategy of multiple SMAs
- Combining SMA with other indicators
- Blending SMA with classic and advanced price action
- Integrating SMA with chart patterns
- Using SMA with Fibonacci levels
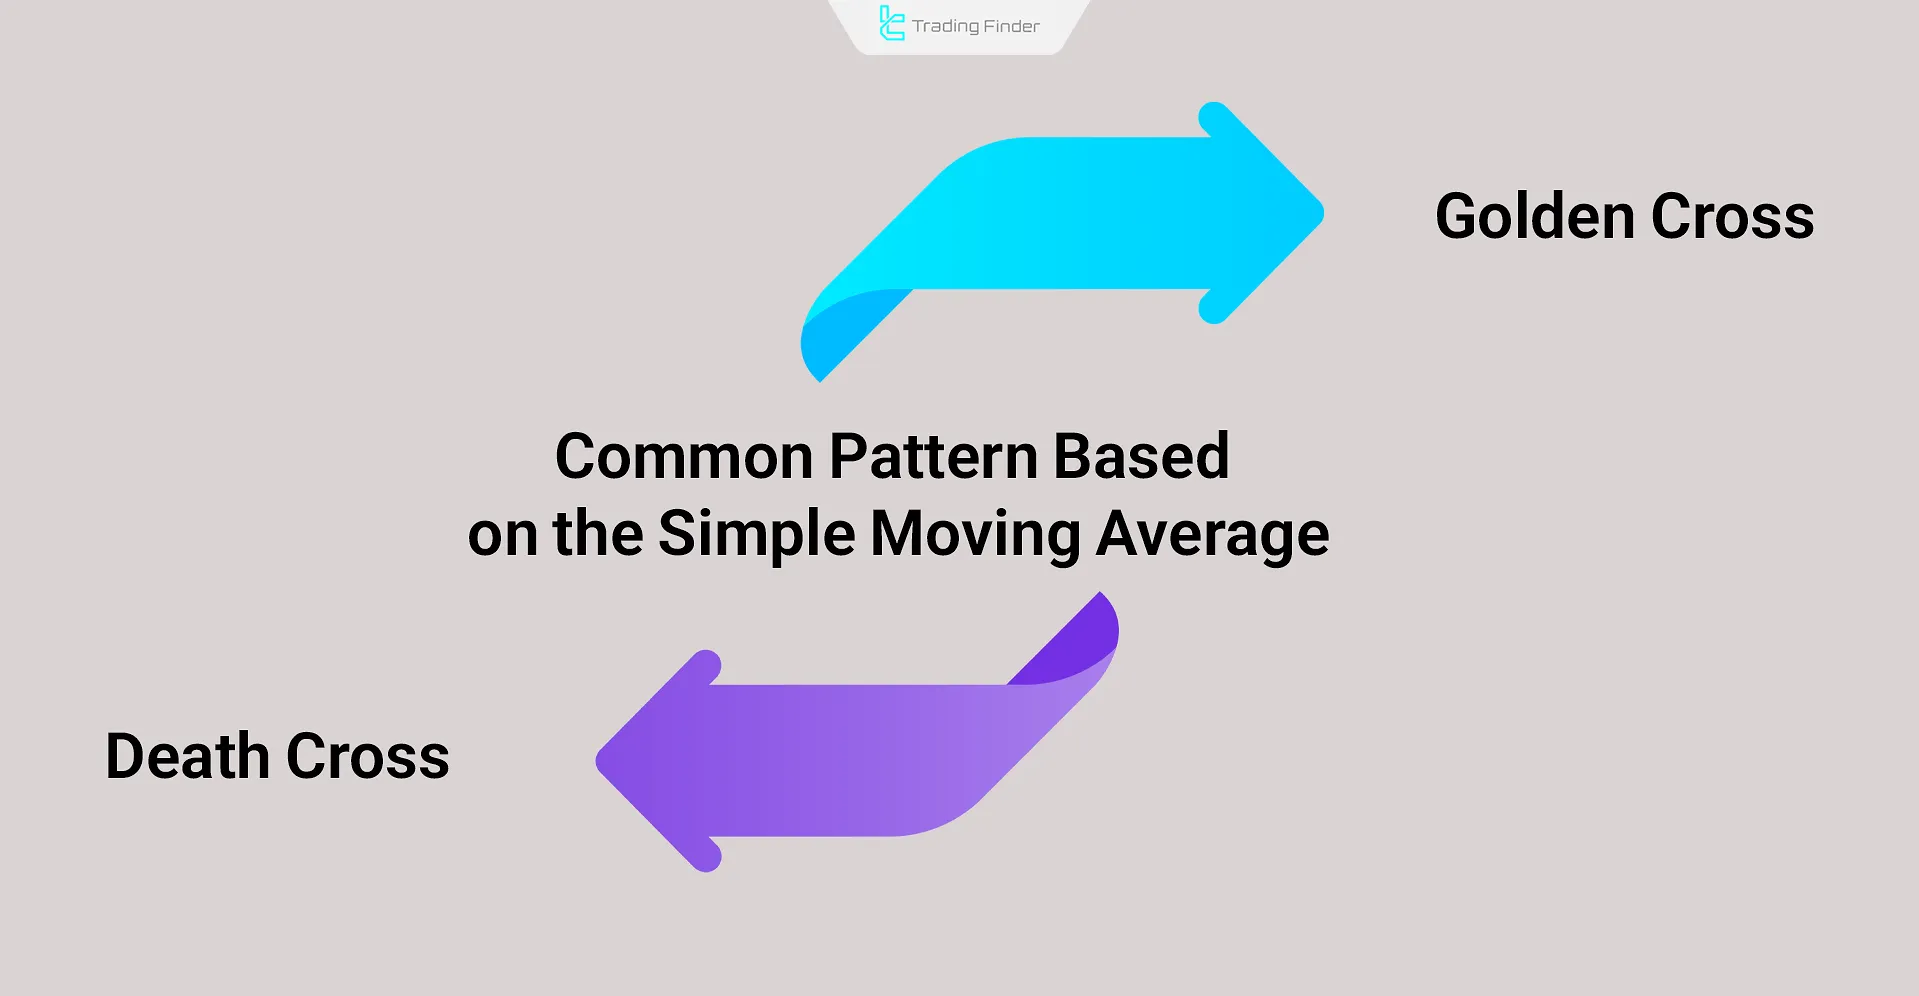
Popular Patterns Based on SMA (Golden Cross and Death Cross)
Two commonly used patterns based on the Simple Moving Average (SMA) are:
- Golden Cross: When the short-term SMA crosses above the long-term SMA, it signals the beginning of an uptrend and an increase in buyer strength;
- Death Cross: When the short-term SMA crosses below the long-term SMA, it indicates growing selling pressure and a potential start of a downtrend.
These patterns, when combined with trading volume data, serve as effective tools for identifying trend reversals in the market.
How to Identify Momentum Using SMA?
When the price is above the Simple Moving Average (SMA), it confirms bullish momentum and the dominance of buyers in the market.
Conversely, when the price is below the SMA, it indicates increased selling pressure and market weakness.
Combining this concept with momentum indicators such as the Relative Strength Index (RSI) significantly enhances the accuracy of entry and exit signals.
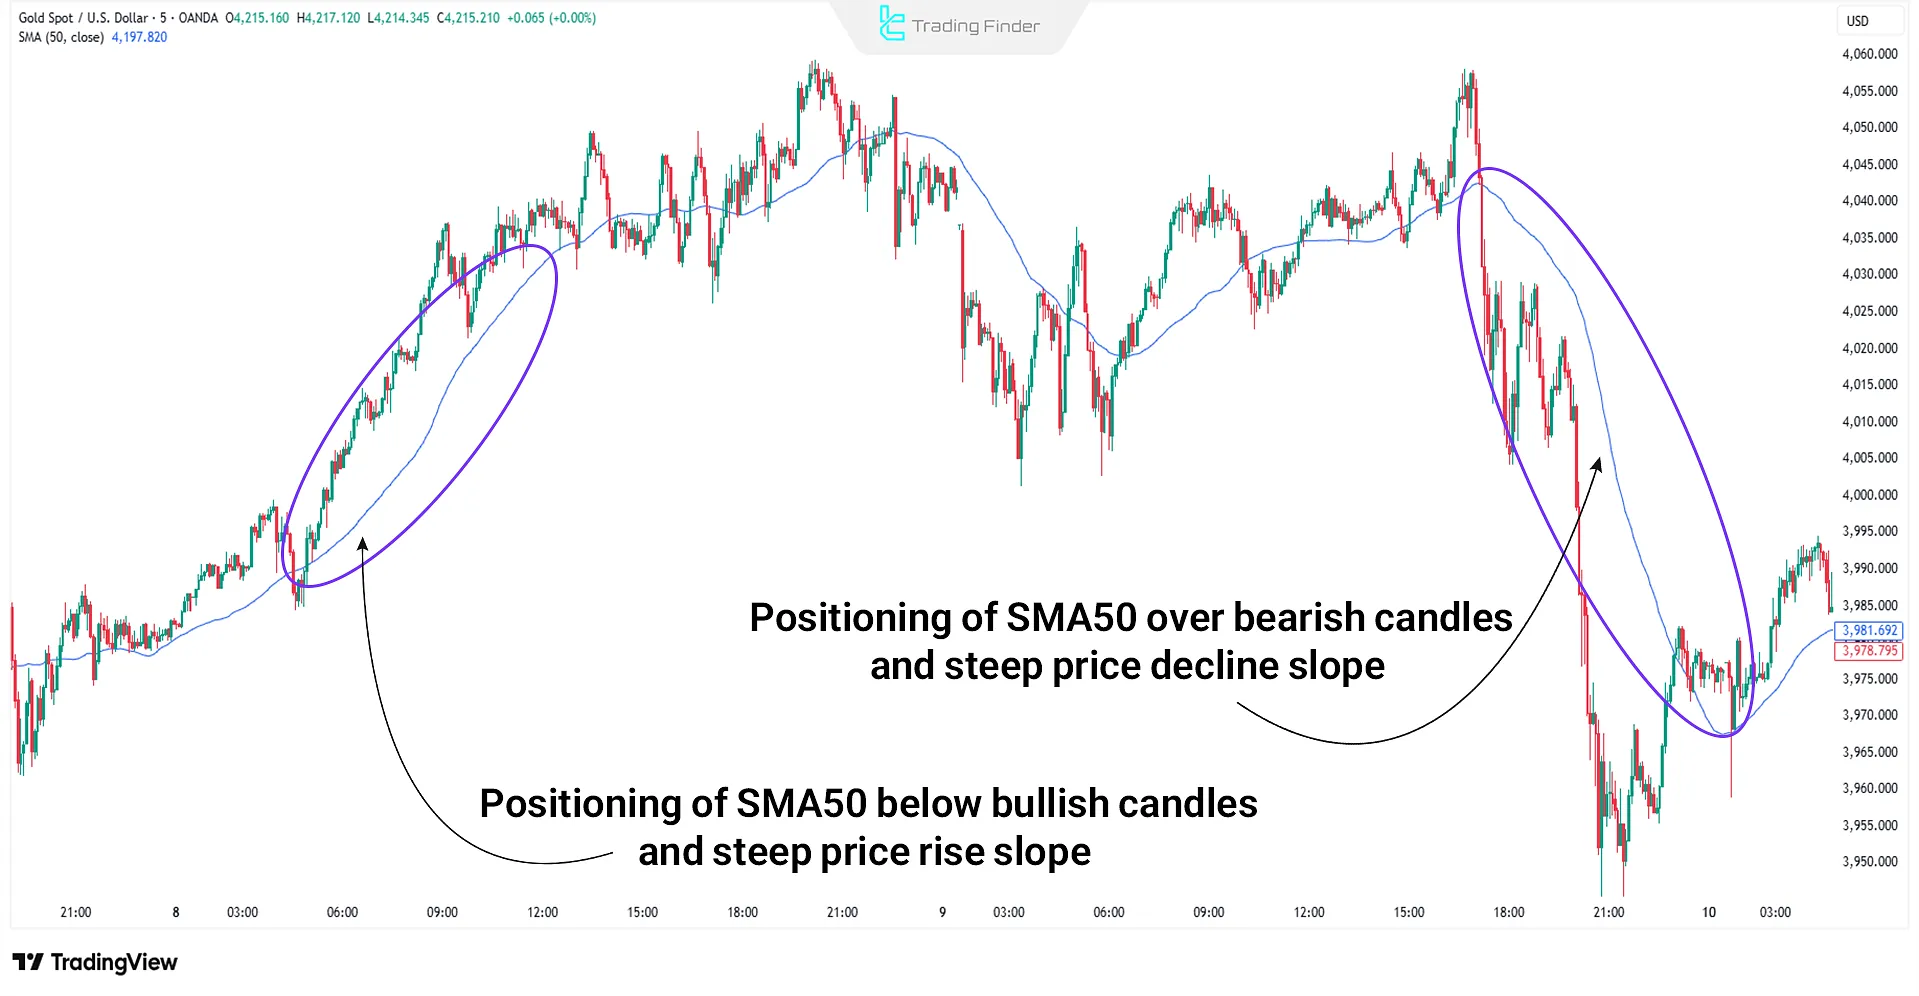
Example of Identifying Momentum Using SMA
In the technical analysis of the gold-to-dollar pair (XAU/USD), the 50-day Simple Moving Average (SMA50) serves as a key indicator for assessing price momentum and trend strength.
When the price is above the SMA50 and the slope is upward, it confirms buyer dominance and sustained bullish momentum; conversely, when the price remains below the SMA50 with a downward slope, it signals rising selling pressure and the start of a bearish phase.
Analyzing the interaction between price and SMA50 allows for more precise identification of momentum shifts, optimal entry and exit points, and the overall directional movement of gold.
Difference Between Simple and Exponential Moving Averages (SMA & EMA)
The SMA provides a smooth and linear visualization of the market by averaging prices over a given period, making it ideal for long-term, trend-following analysis.
In contrast, the Exponential Moving Average (EMA) gives more weight to recent price data and reacts more quickly to market movements, making it better suited for short-term, volatile trading environments.
Comparison table of simple and exponential moving averages:
Feature | Simple Moving Average (SMA) | Exponential Moving Average (EMA) |
Data Weighting | Equal weight for all data | Greater weight on recent data |
Reaction to Price Changes | Slower with more delay | Faster and more sensitive to fluctuations |
Price Noise | Less noise and smoother signals | More noise due to higher sensitivity |
Trend Stability | More stable in long-term trends | More responsive in short-term trends |
Trading Application | Identifies overall market direction and filters trends | Detects trend reversals and provides quick entry/exit points |
Signal Lag | High; significant delay during price reversals | Low; quicker response to directional changes |
Accuracy in Short Timeframes | Less suitable for scalping or fast trades | Highly suitable for reactive and short-term strategies |
Signal Reliability | More reliable but slower signals | Faster signals but with a higher chance of false alerts |
Behavior in High Volatility Markets | Slow but stable reaction | Fast reaction but prone to false signals |
Types of Simple Moving Averages in Different Markets
In financial markets, the Simple Moving Average is typically used across two time horizons:
- Short-Term Moving Averages: such as 20-day or 50-day periods, used to identify short-term fluctuations and define entry points;
- Long-Term Moving Averages: such as 100-day or 200-day periods, used to determine the main trend direction and eliminate price noise.
The combination of short-term and long-term Simple Moving Averages forms the basis of many analytical strategies, including the Golden Cross pattern.
Best Settings for the Simple Moving Average
Since the SMA is used primarily for long-term analysis, common settings include the 20, 50, 100, and 200 periods. Some experienced traders also use 9, 14, 26, and 103 periods.
However, SMA settings should always be customized based on the trader's specific strategy.
Multi Time Frame H4 Moving Average Indicator for MetaTrader
The Moving Average Multi Time Frame H4 indicator in the MetaTrader platform is a precise analytical tool used to assess trend direction and market momentum in financial markets.
By combining a fast and a slow moving average, this indicator allows traders to observe price movement structures across multiple timeframes simultaneously (Multi Time Frame).
This enables decision-making based on a multidimensional view of price behavior and confirmation of primary trends. In this tool, the fast moving average is displayed in red, and the slow moving average in green.
The intersection of these two lines forms the basis for generating signals: when the fast line crosses upward from below the slow line, a Bullish Crossover occurs, indicating a shift in market sentiment toward buying.
- Moving Average Multi Time Frame H4 Indicator for MT5
- Moving Average Multi Time Frame H4 Indicator for MT4
Conversely, when the fast line crosses downward from above the slow line, a Bearish Crossover is generated, typically signaling the beginning of a corrective or downward phase. This indicator is widely applicable to various assets, including Forex, Stocks, and Cryptocurrencies.
For example, in a currency pair on the 30-minute timeframe, a bullish crossover between the moving average lines can confirm the beginning of a new buying wave.
In contrast, in a cryptocurrency on the 4-hour chart, a bearish crossover is often accompanied by increased selling pressure and the start of a downward trend.
The settings section includes parameters such as MA Period, Second MA Period, MA Method, Applied Price, Timeframe, and Show Second MA, providing full customization for different strategies.
Combining this indicator with analytical approaches like Price Action, Smart Money, ICT, and Swing Trading enhances trend analysis accuracy with SMA and reduces the likelihood of false signals.
Overall, the Multi Time Frame H4 Moving Average Indicator is a powerful tool for traders seeking structural and multi-timeframe market analysis.
By merging visual simplicity with analytical depth, it paves the way for precise and intelligent decision-making in dynamic markets.
Conclusion
The Simple Moving Average (SMA) is an indicator used to identify dynamic support/resistance levels andlong-term price trends.
Because it assigns equal weight to each data point within the chosen period, it helps eliminating price noise and presents a clear and smooth overview of market direction.


