


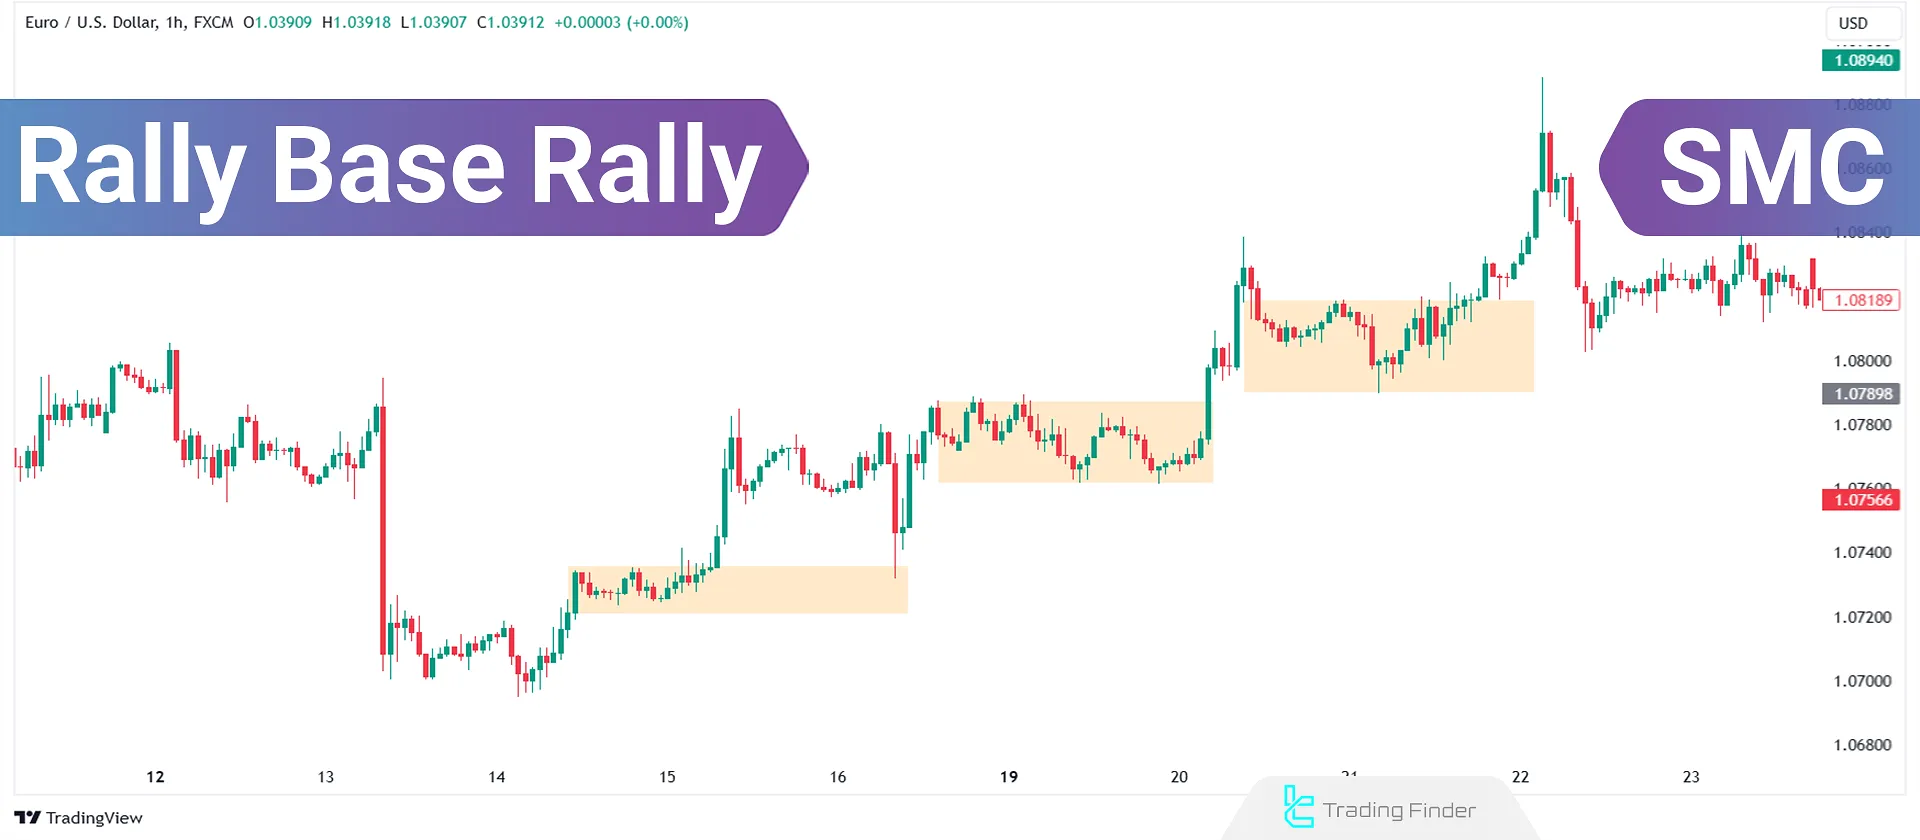
The Rally Base Rally (RBR) trading strategy is a popular technical analysis method for predicting future asset movements in various markets. Derived from Smart Money Concepts (SMC), it is based on the principles of supply and demand.
This pattern forms when, after a strong bullish move (rally), price enters a short-term consolidation phase (base) and then, with the renewed entry of strong demand, initiates a new rally.
The base area in this structure is recognized as a valid demand zone, which is often the location of institutional order entry; therefore, a price retracement to this area can provide low-risk, high-probability opportunities for entries in the direction of the trend.
What is Rally Base Rally?
The Rally Base Rally (RBR) is a powerful bullish continuation concept within the supply and demand trading strategy. It highlights the consolidation of price movements between rally phases.
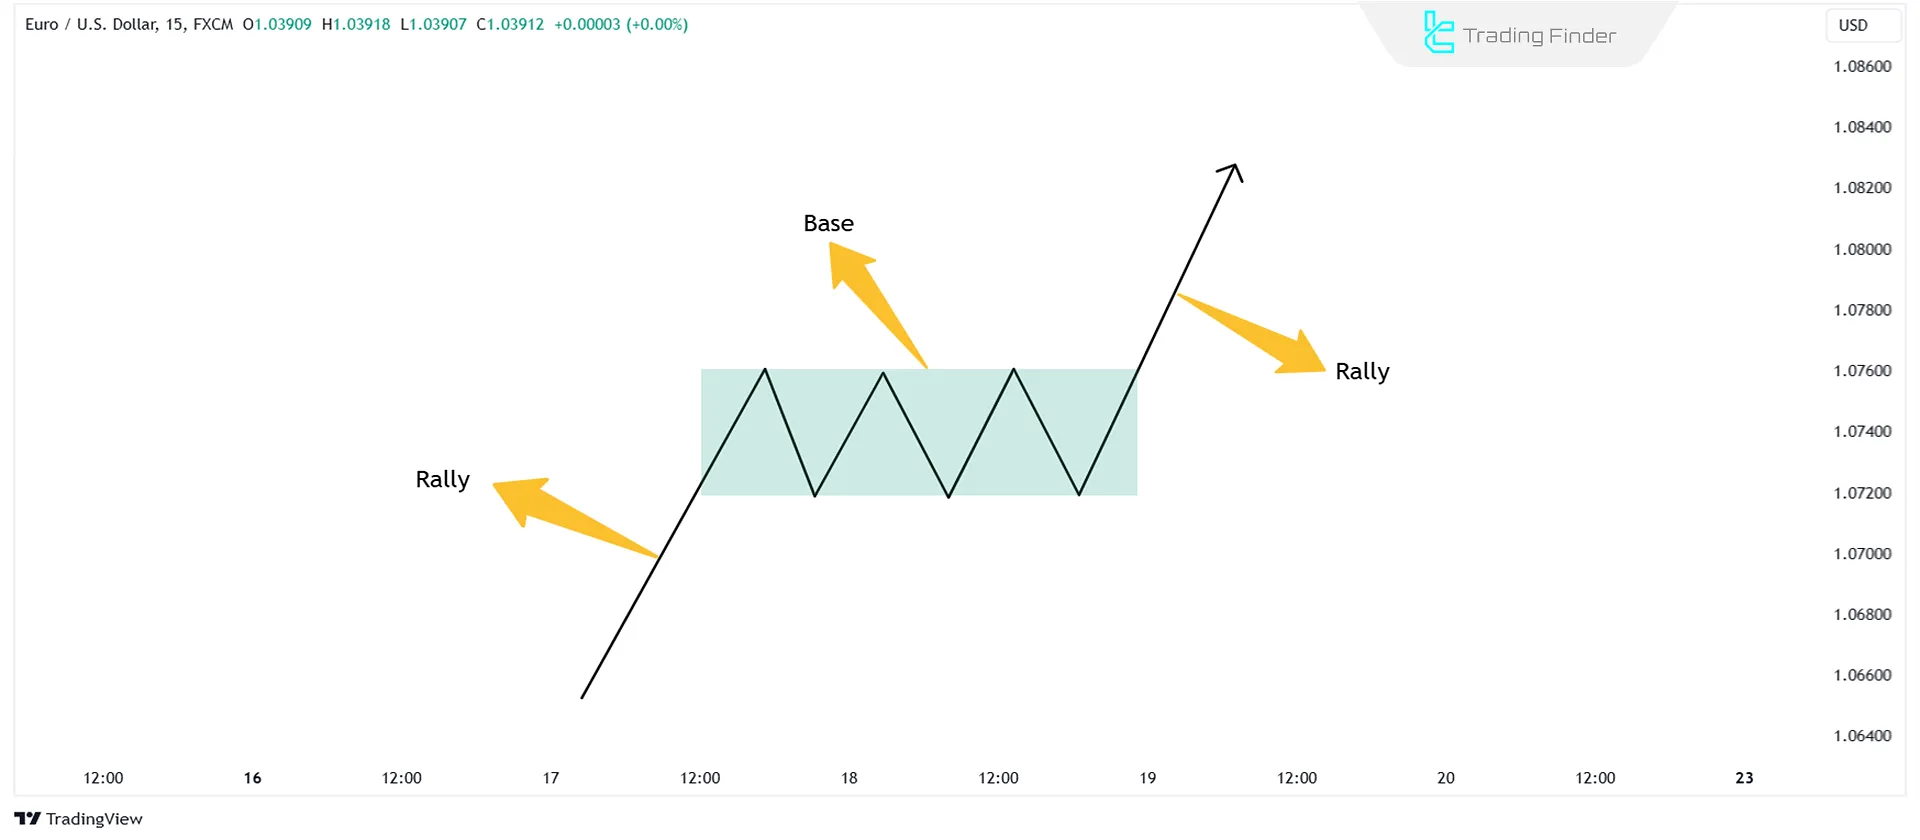
Components and Stages of the RBR Pattern:
- Rally Phase: Indicates strong market demand as prices move upward;
- Base Phase: Occurs when prices consolidate within a specific range, and the market stagnates;
- Second Rally: After breaking the consolidation zone, prices resume their bullish movement.
How to Identify a Rally Base Rally?
To identify a bullish RBR pattern, it is necessary to carefully examine the price movement structure in terms of the strength of the move, the type of retracement, and the way price exits the consolidation zone.
This is because the pattern indicates smart money entry, a brief market pause to accumulate orders, and then the continuation of the bullish move.
Correctly identifying each of these three parts guides the trader in identifying a valid demand zone. The bullish rally-base-rally pattern consists of three main parts:
- The initial rally
- The base
- The second rally
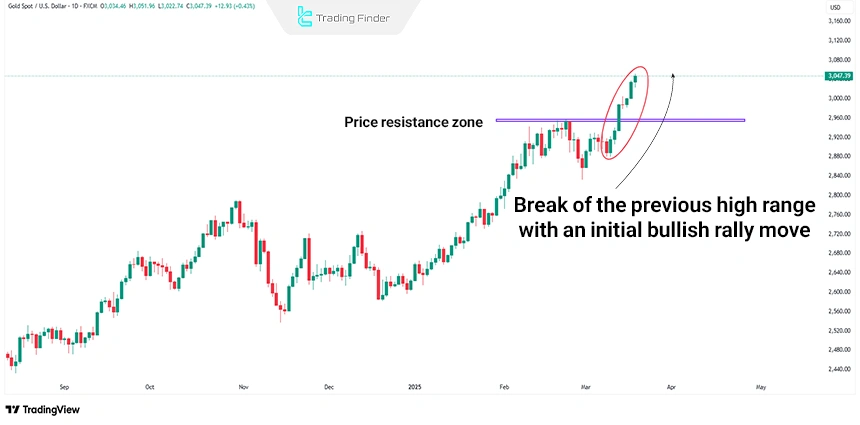
#1 Initial Rally
The initial rally is the first strong bullish wave in the rally-base-rally pattern, which forms with powerful candles and high price momentum and indicates the entry of heavy demand and the activation of smart money in the market.
This move is usually accompanied by the break of key resistance levels, an increase in momentum, and the rapid absorption of supply, indicating that buyers have taken control of the market.
The strength and clarity of this rally play an important role in the overall validity of the pattern and the strength of the subsequent base zone.
#2 Base
Formation of the base is a stage of the rally-base-rally pattern in which price, after a strong bullish move, enters a phase of consolidation and compression.
In this area, the market moves with small candles, compressed bodies, and limited volatility, indicating a temporary balance between supply and demand and, at the same time, the accumulation of orders by major players.
The base is essentially a short pause for liquidity absorption, filling remaining orders, and preparing the market for the next move.
The shorter, more compact this area is and the stronger the exit from it, the greater its validity as a reliable demand zone for low-risk entries on subsequent pullbacks.

What is a Base Candle in the Rally-Base-Rally Pattern?
The base candle is one of the most important components of the rally-base-rally pattern and indicates a temporary pause in price and a relative balance between buyers and sellers.
These candles usually have small bodies and long wicks, which reflect market indecision in that area. Key points for identifying a base candle include:
- The candle body is very small
- The wicks are longer relative to the body
- These candles usually form at the end of a bullish or bearish move
- In some cases, price gaps can also play the role of a base candle
The article on training base candles in price action on the arongroups.co website provides more comprehensive explanations about different types of base candlesticks, which can also be used for further study.
Note: Gaps are usually formed as a result of major economic news and act as strong support or demand zones.
#3 Second Rally
The second rally is the confirming and completing stage of the RBR pattern, which occurs after a strong breakout of the base zone and, with increasing bullish momentum, indicates the renewed dominance of demand over supply.
In this phase, price moves with strong and continuous candles in the buying direction and is usually accompanied by rising momentum and rapid absorption of sell orders.
The second rally confirms the validity of the base zone and shows that the market has entered a bullish continuation phase; therefore, subsequent price pullbacks to the base zone are often considered low-risk opportunities for entries in the direction of the trend.
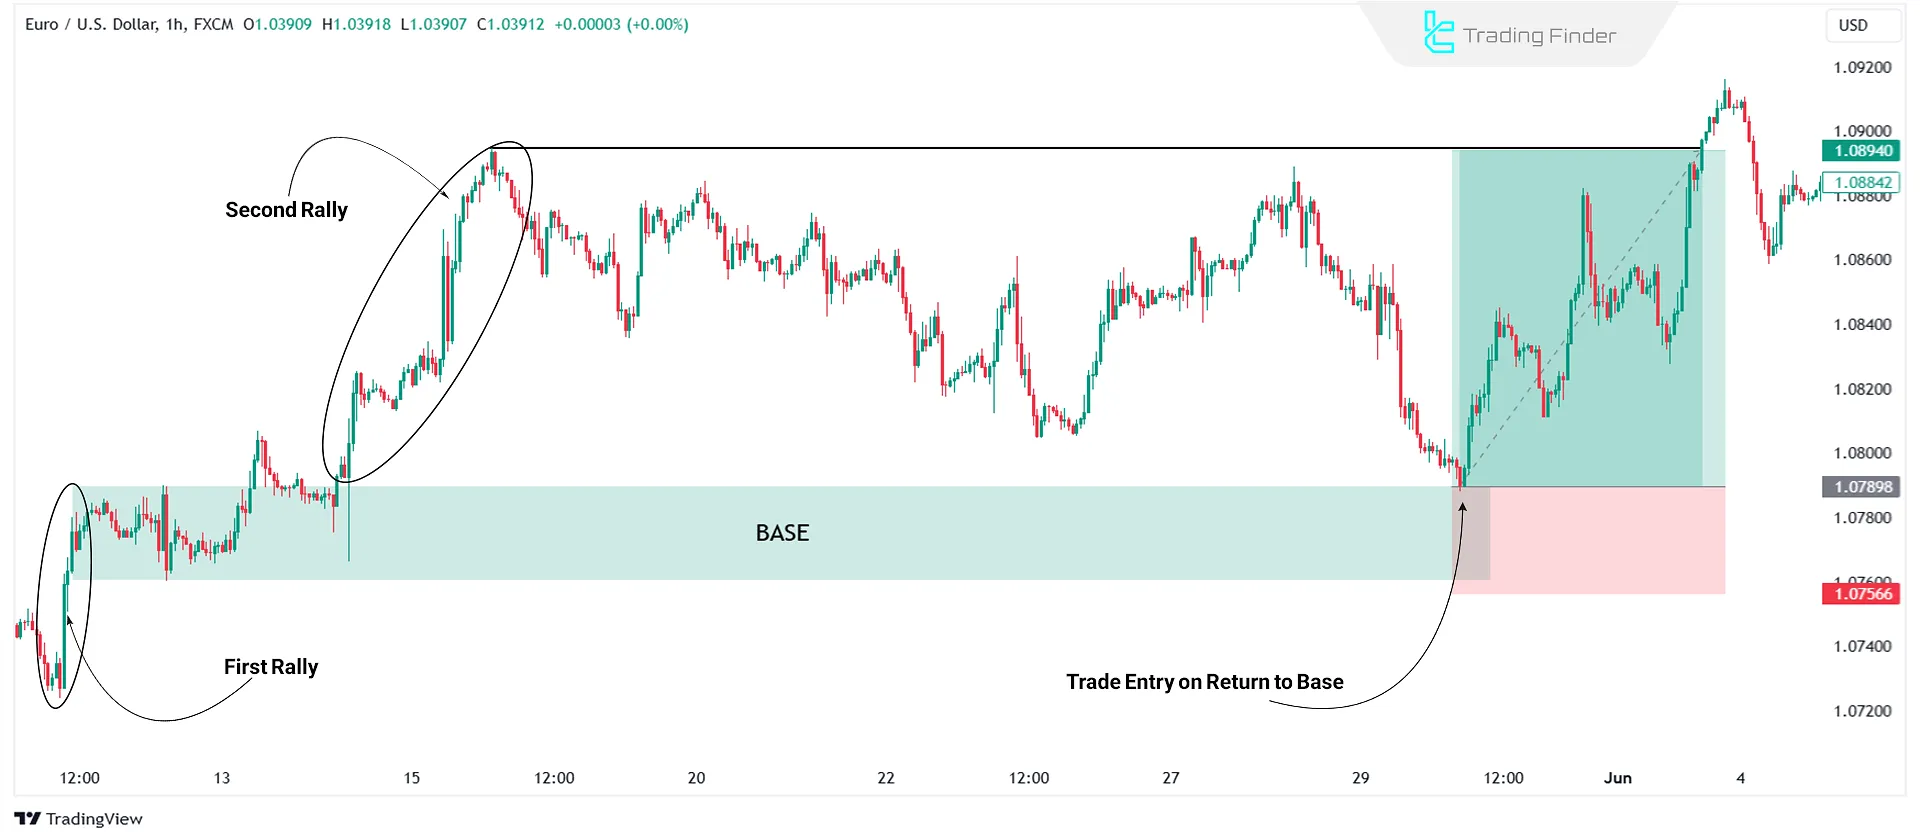
Example of the Second Rally on the Price Chart
On the EUR/USD currency pair chart, an initial rally is formed, followed by a base or candlestick range. In this same area, price encounters fresh buying pressure and begins the second rally, or secondary rally.
The base zone clearly represents the area where price accumulates energy and new buyers initiate the next strong bullish move.
This structure creates a valid signal for future buyers, and when price returns again to the base zone, a fresh bullish reaction and the continuation of the upward trend remain clearly observable.
Role of Candle Body-to-Wick Ratio in the RBR Pattern
To confirm the initial rally, traders should examine two or more consecutive bullish candles with a body-to-wick ratio of 70:30:
- The candle body should cover at least 70% of the total candle;
- The wick should not exceed 30% of the total candle.
The base consists of one or more candles representing a temporary pause in the bullish movement. The body-to-wick ratio for base candles should be 25:75 or lower:
- The candle body should cover no more than 25% of the total candle;
- The wick should form at least 75% of the candle.
Difference Between the Rally Base rally (RBR) and Drop Base Rally (DBR) Patterns
The RBR pattern is structurally very similar to the Drop Base Rally (DBR) pattern. In the table below, their differences are examined:
Comparison feature | Rally Base Rally pattern | Drop Base Rally pattern |
Overall structure | Bullish move followed by base formation and continuation upward | Bearish move followed by base formation and start of an upward move |
Initial phase | Strong bullish rally | Initial drop (sell-off) |
Base position | In the middle of an uptrend | After the completion of a downtrend |
Final breakout direction | Upward (trend continuation) | Upward (trend reversal) |
Analytical logic | Based on supply and demand | Based on supply and demand |
Role of smart money | Entry during continued buying strength | Entry at the end of selling pressure |
Entry location of strong buyers | During bullish retracement (base after growth) | After seller exhaustion (base after decline) |
Primary application | Bullish trend continuation | Reversal from a downtrend |
The educational video from the FX telepath channel on YouTube presents practical examples of price behavior and trading setups and provides the opportunity to closely examine entry and exit logic.
How to Accurately Draw the Demand Zone in the Rally Base Rally Pattern
To draw the demand zone in the Rally Base Rally (RBR) pattern, the main focus is placed on the base area, and precision in this section determines the validity of the zone.
The drawing steps are carried out as follows:
- Identifying the base candle or candles on the chart;
- Marking the highest price (High) and the lowest price (Low) within the base area;
- Drawing a rectangle between these two levels and extending it to the right side of the chart;
- Replacing the low of the last bullish candle before the base as the zone reference, if its low is located below the base low.
This zone forms the exact area from which, upon a price retracement, a strong bullish reaction is expected.
How to Trade the RBR Pattern?
To trade the Rally Base Rally pattern, follow these steps:
- Wait for the initial rally and base to form;
- Once these stages are identified, wait for the base to break;
- A confirmed breakout occurs when a candle closes above the base’s price range;
- If the price retraces to the base area after the breakout, initiate a buy trade;
- If the price does not immediately retrace to the base, wait for it to return and execute the buy trade at that point.
Risk Management
To protect your capital and minimize potential losses when trading the RBR pattern, use Stop Loss (SL) and Take Profit (TP) tools:
- Stop Loss: Place it below the base’s low;
- Take Profit: Set it based on a 1:2 risk-to-reward ratio or the next resistance area.
Weakness of the Rally Base Rally Pattern in Setting Take Profit
One of the inherent weaknesses of the rally base rally pattern is that it does not independently define the exact take profit level. In this pattern, the trader can accurately place the stop loss below the base zone, but determining the take profit requires complementary tools.
To address this weakness, the following tools can be used, and combining these tools with the RBR pattern significantly improves trade accuracy:
- Fibonacci retracement and extension levels
- Key resistance zones on higher timeframes
- Market high and low structure
Additional Confirmations for Trade Execution
Using additional confirmations increases the chances of success:
- Bullish Candlestick Pattern Confirmation: Patterns like a hammer, morning star, or bullish engulfing enhance the likelihood of a successful trade.
- Volume Confirmation: A strong breakout from the base accompanied by high volume signals a high-probability trade.
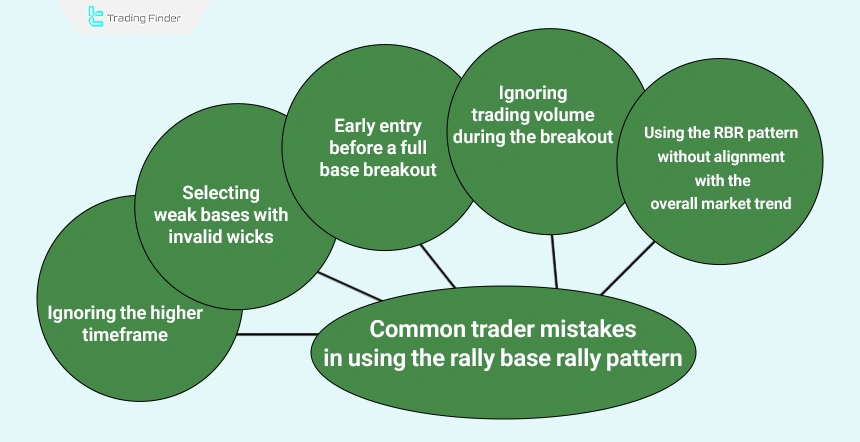
Common Trader Mistakes in Using the Rally Base Rally (RBR) Pattern
Many traders, despite being familiar with the rally base rally pattern, incur losses due to several common mistakes. The most important of these mistakes include:
- Early entry before a full breakout of the base
- Ignoring higher timeframes
- Selecting weak bases with invalid wicks
- Failing to consider trading volume during the breakout
- Using the RBR pattern without alignment with the overall market trend
Avoiding these mistakes significantly increases the success rate of this trading setup.
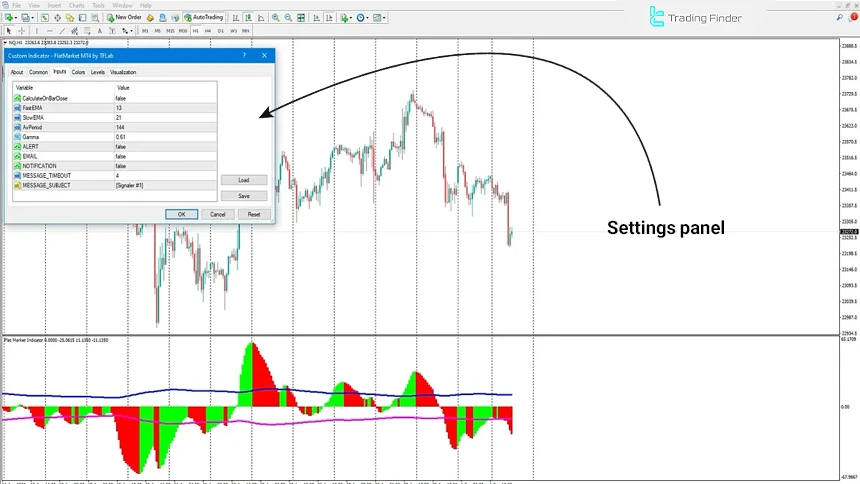
Flat Market Indicator for Identifying Bases in MetaTrader
The Flat Market indicator is one of the smart tools for identifying market indecision phases and the moment new trends begin on the MetaTrader platform.
By relying on an oscillatory structure and a histogram, this indicator visually displays ranging areas on the chart and helps traders avoid emotional entries in directionless markets.
The operating principle of this tool is based on the movement of the histogram between two oscillator bands.
As long as the histogram fluctuates within this range, the market remains in a Range state. However, when the histogram crosses above the upper band or below the lower band, a valid signal for the start of a bullish or bearish trend is generated.
This feature has given the Flat Market indicator a special position in range breakout–based strategies.
This indicator falls into the categories of trend, range, strength, and lagging indicators in MetaTrader and can be used by beginner to professional traders. Its high adaptability has made it widely applicable in scalping, day trading, and intraday trading styles.
This tool also delivers reliable performance across various markets, including forex, cryptocurrency, stocks, indices, and corporate equities, and enables multi-timeframe analysis as well.
In practical examples, on currency pairs in the 30-minute timeframe, the histogram exiting the upper band is interpreted as a buy entry signal. Conversely, the histogram crossing below the lower band signals the start of selling pressure and the formation of a bearish trend.
The advanced settings section of Flat Market includes parameters such as Fast EMA, Slow EMA, Av Period, and Gamma, which allow customization of the indicator’s sensitivity.
In addition, alert features via Alert, Email, and Notification enable traders, even when away from the platform, to stay informed about market phase changes.
Options such as Calculate On Bar Close and Message-Timeout also control calculation accuracy and message management.
Overall, the Flat Market indicator is a reliable tool for filtering low-volatility markets, preventing low-efficiency entries, and accurately identifying the start of new trends; combining this tool with classic technical analysis can significantly enhance the quality of trading decisions.
Conclusion
The ICT-style rally base rally strategy is designed based on supply and demand principles.
By accurately identifying the stages of this pattern and using additional confirmations, traders can recognize the continuation of bullish trends. The rally base rally setup can be applied across all financial markets and timeframes.
The flexibility of this pattern has made the RBR setup applicable and adaptable in all financial markets, including forex, cryptocurrencies, and equities, and across all timeframes.


